|
|
|||||||
|
|
|
|
|
|
|
|
|
|
|
|
|
|
|
|
|
|
|
Bullish Oil Technicals Adam Hamilton July 22, 2011 2633 Words
Averaging $96 so far this summer, crude oil certainly doesn’t feel cheap. Nevertheless, its technicals are looking increasingly bullish. After recently bouncing out of a major correction, oil appears to be embarking on a new bull-market upleg. If one is indeed brewing, speculators and investors alike ought to capitalize on this excellent buying opportunity in oil stocks.
Back during 2008’s once-in-a-century stock panic, that epic maelstrom of fear sucked in oil too. The King of Commodities was throttled to within an inch of its life on stock-panic-spawned economic fears of a new depression. Between July 2008 (when it traded at all-time highs in the $140s) to December 2008, oil plummeted an astounding 75.5%! This commodity is super-responsive to stock-market fear.
But contrary to popular belief back in late 2008, the world wasn’t ending. The global economy kept on chugging along as people still needed countless goods and services to survive, all of them dependent on oil-fueled transportation. So ever since oil’s ridiculously-irrational panic lows, it has been gradually recovering. Global demand remains high while new supplies are getting ever-harder to find and produce.
While the oil price soared 229.9% between its ultimate February 2009 panic low and its recent April 2011 high, it is only now regaining pre-panic levels. It averaged $111 per barrel on close in the first half of 2008 before the massive stock-panic disruptions, and it finally regained this metric only a few months ago. By pre-panic standards, $100 oil is simply not excessive.
Oil’s necessary post-panic recovery has generally unfolded at a moderate and healthy pace. In calendar 2010 for example, crude oil only rallied 14.9%. It was actually something of a laggard in the commodities realm, with gold climbing 29.7% last year while the flagship Continuous Commodity Index clocked in at +30.0%. So the road back to $100 has been gradual, implying oil’s recovery is fundamentally driven.
In fact, during its entire post-panic recovery oil didn’t really start surging until mid-February 2011. As you probably remember, the Arab Spring uprisings spilled into Libya and ignited a civil war in that major oil-producing country. Oil’s resulting spike was certainly fundamentally-justified, as Libya was the world’s 17th-largest producer and 15th-largest exporter before rioting and violence choked off its oil exports.
That Libyan revolt ignited an impressive 34.8% oil rally over the following 2.4 months, propelling this commodity to its post-panic high near $114 in late April. While speculators certainly piled into oil after it started surging, this latest upleg was initially fundamentally driven. Oil was definitely overbought after such a big and fast run, leading to its recent 20.2% correction over 1.9 months.
Big news during this correction was the Obama Administration tapping the US Strategic Petroleum Reserve. Since it exists for times of severe supply disruptions like full-blown Middle East wars, this move was immediately attacked as being a politically-motivated price manipulation. Realize though that this didn’t drive oil’s correction! Oil prices had already weathered 5/6ths of their correction before this announcement was made. Oil actually finally bottomed just a few trading days after this news hit.
Ever since, despite troubling economic news out of Europe and the Obama Administration’s chronic inability to live within its means, oil has been gradually regaining ground. Not only has it failed to hit a new correction low even in the face of terrible US jobs data (and its bearish economic implications), oil has actually rallied 8.5% in the past several weeks. Its technicals are steadily improving.
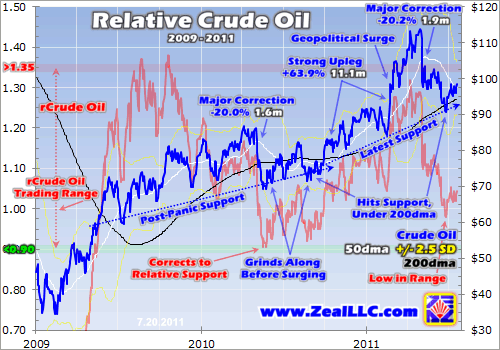
This is readily apparent in this chart, which highlights today’s bullish oil technicals. Oil itself is rendered in blue and slaved to the right axis along with some of its key metrics. A technical indicator called Relative Crude Oil is shown in red off the left. Regardless of how $100 oil feels, charts don’t lie. Technically this popular commodity appears to be basing before its next upleg starts marching higher.
Following its recent correction, oil fell to a couple major support lines. Note that since mid-2010, oil’s original post-panic support has steepened into a new support line. This latest support was briefly hit in mid-February 2011 before the Libyan-revolution surge and again a few weeks ago in late June. In its entire post-panic recovery, oil has yet to fall materially below these uptrend support lines. So the recent bounce dead-on support after a major 20.2% correction has to be taken seriously.
Even more important is oil’s 200-day moving average, shown in black. 200dmas are generally the highest-probability bounce points for healthy corrections within ongoing bull markets. In late June for the first time since September, oil briefly fell under its 200dma. This recent 200dma approach, and the subsequent multi-week recovery, is strong technical evidence that oil’s recent correction has given up its ghost.
Last summer offers a perfect example of why these technicals are so bullish. After falling 20.0% over 1.6 months in a major correction, oil knifed through its 200dma and hit its uptrend support line. The recent 20.2% correction over 1.9 months was nearly identical in magnitude and duration. Following its initial bounce last summer, oil generally ground sideways gradually regaining ground before a new upleg started surging.
And powering 63.9% higher over 11.1 months, the subsequent upleg was pretty awesome. We traded it aggressively at Zeal, buying the beaten-down oil stocks last summer and selling them earlier this year. Our subscribers enjoyed some awesome realized gains, as our 10 oil-stock trades surged an average of 61% each in just 6 months, annualizing to 122% returns! Oil stocks can be very lucrative if purchased soon after a major oil correction.
Oil appears to be in a similar situation this summer, beaten down to major support lines and out of favor. I have to use these wiggle words because oil didn’t get quite as oversold recently as it did last summer, a potential monkey wrench in the works. This is best understood through my Relativity trading indicator, which is the light-red “rCrude Oil” line tied to the left axis. In relative terms, oil didn’t fall as low in late June as it ought to have.
Relativity trading recasts prices as multiples of their own 200-day moving averages. The oil price is simply divided by its 200dma and the resulting multiple charted. Over time it forms a horizontal trading range. 200dmas are perfect baselines from which to measure prices in trending markets. They are slow to move yet they do gradually follow bulls and bears, and they are where countertrend reversals (corrections in bull markets) are most likely to end. This system is powerful and profitable, well worth your time to learn.
We define relative trading ranges using the past 5 years of data. In oil’s case, it tended to meander between 0.90x its 200dma on the low side to 1.35x on the high side. In other words, oil tended to top around 135% of its 200dma after major uplegs and then subsequently fall to near 90% of its 200dma after major corrections. Note above that in last summer’s correction, oil indeed hit this relative support line.
But recently in late June after our latest correction, oil only fell to 0.979x relative. This is definitely an oversold level based on oil’s bull-to-date performance, but it still remained a bit above the high-probability bottoming level of 0.90x. So in Relativity terms, the odds of oil’s latest correction being over are significantly lower than the support-line technicals alone imply. Oil could still slump to a new correction low before the next upleg launches.
The wildcard that may or may not drive further near-term weakness is the US stock markets. Provocatively commodities in general, and oil in particular, have a strong positive correlation with the flagship S&P 500 stock index. When the stock markets are rising, oil traders feel good and assume the global economy is healthy and growing. This means improving oil demand. So they buy oil, bidding it up with stocks. But when stock markets fall, oil traders get scared and worry that the global economy is weakening. Since this would lead to lower oil demand, they aggressively dump oil and drive it down in concert with stocks.
So if we see a sharp stock-market selloff in the coming weeks, certainly possible given the lack of fear in the stock markets, oil is going to get sucked in. And it may very well hit a new correction low in this scenario. But if such an eventuality indeed comes to pass, neither the stock markets nor oil will stay depressed for long. And there is a growing chance the US stock markets will merely continue consolidating sideways, slowly rebalancing sentiment without the need for a sharp correction.
Even with the significant sentiment-splash-damage risk the stock markets pose to oil, deploying in the beaten-down oil stocks is still very attractive. Whether the next oil upleg already started a few weeks ago or is born a few weeks from now after a secondary low, oil stocks are very undervalued relative to oil. So not only will they enjoy their usual oil-upleg-driven buying, but their gains ought to significantly leverage oil’s to catch up.
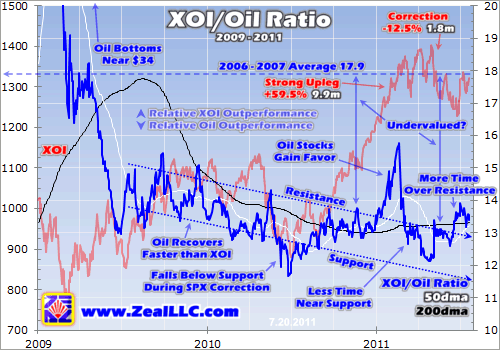
This chart shows why. It looks at the flagship XOI oil-stock index divided by the price of oil. The resulting ratio shows the evolving relative strength between oil stocks and oil. When this ratio is rising, oil stocks are outperforming the commodity that drives their profits and thus ultimately their stock prices. When this ratio is falling, oil is outperforming the elite oil stocks. Since the stock panic, these stocks have lagged dramatically.
While both oil and the XOI (shown in light red here) recovered since the panic, oil prices have been rallying faster than the large oil stocks’. The XOI/Oil Ratio has been grinding lower on balance since mid-2009 as oil recovered faster than the XOI. This ratio fell under support last summer as the stock-market correction hammered oil stocks even more than oil itself. And oil stocks briefly gained favor and surged earlier this year, temporarily bursting above this ratio’s post-panic resistance line.
While this surge soon plunged back down within trend as the Libyan revolt drove up oil prices much faster than oil stocks’, this ratio is still showing marked improvement in 2011. It is spending a lot less time near support, and much more time over resistance. Technically this implies that if this ratio hasn’t already broken out of its downtrend, it should soon do so. Oil stocks are finally starting to outperform oil again, a long overdue reckoning.
Today this ratio is running around 13.5, which isn’t even high yet in post-panic terms. Back in late 2009 and again earlier this year it traded above 15.0. The XOI oil-stock index would have to rally about 11% (assuming oil stays flat) to merely hit 15.0 again. But I am far more interested in where this ratio traded in 2006 and 2007, the last normal years before 2008’s wild stock-panic dislocations. Throughout this long normal environment, the ratio between oil stocks and oil averaged 17.9!
In order to merely regain this pre-panic-average relationship, the giant oil stocks of the XOI would have to rally by about a third from today’s levels. And this assumes oil prices remain flat. If oil is indeed embarking on or soon to start a major new upleg as its technicals suggest, the elite oil stocks would have to rally a lot higher to rectify their post-panic undervaluation relative to oil.
For example, assume oil rallies 50% or so in this coming upleg. That isn’t too extreme, as its last upleg that ended in late April powered 64% higher. And this would only take oil to $136 or so if its late-June lows indeed marked the end of its latest correction. This remains well below its pre-panic high near $146 from July 2008. To merely regain its 17.9 average historic ratio with crude oil, at $136 the XOI would have to soar to 2435! This is about 85% higher than today’s levels, a heck of a run!
And for a variety of reasons, this is actually a pretty-conservative scenario. Today the XOI’s market-cap-weighted-average price-to-earnings ratio is only running at 11.6x. This is well under the broader S&P 500’s 18.8x, even though oil stocks are much more profitable and have far-more-certain future business prospects than most other stocks. So even if we see a massive oil-stock rally to return the major oil stocks to pre-panic levels relative to oil, they still won’t be overvalued at the end.
In addition, the XOI component companies are the gigantic elite oil stocks. Their average market capitalization at the end of June was a staggering $125b! This was 5x the S&P 500’s average of $25b. Companies this enormous have vast price inertia, kind of like an oil supertanker. It takes tremendous capital flows to move them either way. But most speculators, including us, gravitate towards much-smaller oil producers. These high-potential stocks often have market caps 1/10th or less of the average XOI component’s. So they can and should surge far faster than their giant elite brethren.
Finally, when ratios are driven way out of whack by an extreme event like a stock panic, they often overshoot considerably when they eventually rebound back. We’ve certainly seen this in spades in the Silver/Gold Ratio recently! It took a couple years to stabilize, but once silver regained favor in investors’ eyes it rallied so fast it radically overshot its historical average ratio to the upside. There is no reason oil stocks can’t do the same thing relative to oil if they really start to become popular among traders again.
In light of oil’s increasingly-bullish technicals and the vast potential in smaller oil stocks, we recently started a new campaign of redeploying into them. Yes, short-term risk remains if the stock markets finally decide to correct. But the resulting oil-stock carnage will be short-lived and the oil upleg will resume soon after. Oil’s very-bullish fundamentals virtually guarantee it, as global demand continues to grow while new supplies are getting harder and harder to find and more expensive to extract and process.
If you want to see exactly which small oil stocks we buy, and when, subscribe to our acclaimed weekly or monthly newsletters. At Zeal we’ve been actively trading these secular commodities bulls for over a decade, yielding priceless wisdom, knowledge, and instincts that few others can match. Our real-world track record over this long span has been outstanding. Since 2001, all 591 stock trades recommended in our newsletters have averaged annualized realized gains of +51%!
We truly walk the walk, and can help you learn to thrive in the stock markets. The profitable fruits of our ongoing research efforts are shared with our newsletter subscribers, who finance our hard work. In our newsletters I weave together all our research and experience to show what the markets are doing, why, and where they are likely heading. And when probabilities grow favorable, like in oil stocks today, we recommend specific stock trades you can mirror. Subscribe today and start thriving!
The bottom line is crude oil’s technicals are looking increasingly bullish. Though it remains at risk of getting sucked into any sharp stock-market selloff, its recent major correction and support approaches are pretty compelling. And even if falling stock markets drive it to a secondary low, a new upleg is likely to emerge soon after anyway. Oil’s global supply-and-demand fundamentals remain overwhelmingly bullish.
A new oil upleg offers fantastic opportunities for stock traders, as oil stocks remain very undervalued relative to the commodity they produce which drives their profits and hence ultimately stock prices. Despite oil’s post-panic recovery, the large oil stocks have lagged considerably. This sector will have to rally far faster than oil for a long time to merely regain its pre-panic levels relative to the oil price!
Adam Hamilton, CPA July 22, 2011 Subscribe |
|||||||
|
|
|
|
|
|
|
|
|
|
|
|
|
|
|
|||