|
|
|||||||
|
|
|
|
|
|
|
|
|
|
|
|
|
|
|
|
|
|
|
Trading Stock Fear Adam Hamilton June 17, 2011 2645 Words
The stock markets’ sharp June selloff is waking traders from their complacent slumber. The risk of a significant selloff, long ignored, has surged back to the forefront of market psychology. These pullbacks and corrections are healthy and necessary within ongoing bull markets, but they don’t end until fear grows great enough to rebalance sentiment. And today, stock fear is still too low for a bottoming.
Sentiment, the collective greed and fear of all traders, drives the vast majority of all short-term financial-market action. Like a great pendulum, it perpetually swings back and forth between excessive greed and excessive fear. In bull markets, maturing uplegs generate widespread greed while maturing corrections spark universal fear. But these emotional extremes are self-limiting, they soon burn themselves out.
After prices have advanced long enough and high enough in a major upleg, greed peaks. All traders interested in buying stocks anytime soon have already deployed their capital, leaving only sellers. Their selling spawns a correction. This is self-feeding, as the lower that prices fall the more traders are frightened into selling. Eventually all traders interested in selling anytime soon have sold, so fear climaxes, and then this endless cycle begins anew.
This leads to ongoing bull markets advancing two steps forward in greed-driven uplegs before retreating one step back in fear-driven corrections. Trading these upleg-correction cycles is wildly profitable, buying low when everyone is fearful and selling high when everyone is greedy. But in order to trade sentiment, we need some way to attempt to quantify this ethereal construct. Enter the implied-volatility indexes.
Volatility simply measures how much markets are moving, either within individual trading days or between them. A day when the flagship S&P 500 stock index (SPX) sees a 3% trading range is way more volatile than a 1% one. While volatility doesn’t measure sentiment directly, it is closely tied to it. Since fear is a more immediate, visceral emotion than greed, fearful times witness far-higher volatility than greedy ones.
Implied volatility extends this concept into the near future. It looks at stock-index options prices, which reflect what options traders believe about near-future market action. The prices at which they make their options bets mirror their expectations. And when they are scared, which only happens after stock prices have already fallen significantly, ballooning options prices imply higher volatility ahead.
So implied volatility is effectively a fear gauge, with the famous VIX (short for “Volatility IndeX”) being the most-popular index. It measures the implied volatility of a weighted blend of SPX index options expiring over the coming month. While today’s VIX works well, I still prefer its old-school predecessor for a variety of reasons. It was the original VIX until September 2003, when that classic index’s calculation methodology was heavily modified.
This new “VIX” replaced the original VIX, which was renamed the VXO. The VXO measures implied volatility of S&P 100 at-the-money index options expiring one month out. At-the-money options are a purer, less-diluted measure of volatility than the out-of-the-money ones introduced in the new VIX. And the giant S&P 100 stocks (top 20% of the S&P 500) are much more liquid and hence the first and fastest to be sold in fear episodes. Thus the classic VXO remains more responsive to fear spikes than the new VIX.
Whether you prefer the VXO or VIX, trading stock fear is easy to understand. Speculators should sell their positions to realize profits after major uplegs when the VXO is low, indicating no fear and hence widespread greed and complacency. And then after corrections when the VXO is high, both speculators and investors can buy stocks at relative-bargain prices. Sell on a low VXO, buy on a high VXO. Simple!
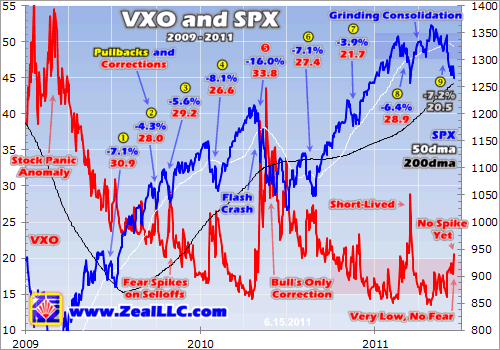
As always, this principle of selling greed and buying fear has proven very profitable in the SPX’s current cyclical bull since 2008’s stock panic. This first chart superimposes the SPX (blue) over the VXO (red), with every stock-market pullback (4% to 10%) and correction (over 10%) labeled. The highest VXO close within the trading week surrounding each SPX selloff’s bottom is noted in red. This comparison reveals what kinds of VXO levels are associated with major bottoms. Today it is too low, fear hasn’t climaxed yet.
As 2008’s once-in-a-century stock panic was an epic fear event, the biggest of our lifetimes, the VXO skyrocketed to crazy-high levels in late 2008 and early 2009. So most of the VXO’s trading action in 2009 was anomalous, a gradual post-panic normalization. Nevertheless, all the major stock-market pullbacks and corrections still tended to see a tight range of VXO levels marking their bottoms.
So far in this cyclical bull, the SPX has weathered seven pullbacks and a single correction. The average high VXO close marking the fear climax within two trading days before and after these major SPX bottoms was 28.3. The high reading was 33.8, at the end of last summer’s massive 16.0% SPX correction. The low one was 21.7, after the minor 3.9% SPX pullback seen last November. Exclude these two extremes and the average fear peak is still 28.5 in VXO closing terms, with a very-tight 1.5 standard deviation.
Thus bull-to-date precedent is very clear in showing a VXO close around 28 is necessary for a high-probability bottoming following a pullback or correction in the SPX. So far in our current selloff, the highest VXO close we’ve seen was merely 20.5. This is way below the fear levels likely necessary to fully rebalance stock-market sentiment. Stock fear is still too low for a major bottoming in the SPX!
Without greed and fear, the stock markets would gradually rally in a nice straight line in an ongoing bull market. The sentiment pendulum swinging back and forth between collective greed and fear pushes and pulls this ascent into something like a meandering sine wave. Greed near the ends of uplegs pushes the stock markets higher than their linear uptrend, while fear near the ends of selloffs pulls them lower.
The longer that one of these extreme emotions persists, the more unbalanced sentiment becomes. Hence the longer and farther the sentiment pendulum must swing in the opposite direction to rebalance sentiment. Consider last summer’s SPX correction. The SPX had powered higher for so long without any meaningful selling, driving such low VXO levels in April 2010 (14s), that it took a major correction to generate enough fear to eradicate that entrenched greed.
Conversely in most of the SPX’s pullbacks of this bull, the stock markets hadn’t rallied as far or as long so the necessary rebalancing was much smaller. Note that the VXO was also considerably higher heading into most of those pullbacks compared to how low it was before last summer’s correction. But recently by late April 2011 near the SPX’s latest interim highs, the VXO had slumped down into the 13s! Greed and complacency were extreme, and fear hardly even existed anymore just 7 weeks ago.
Back then I warned about the high risk for an imminent correction, a lonely contrarian voice in a sea of irrational bullishness. I wrote an essay then showing how precarious the stock markets looked based on key sentiment indicators including the VXO. I advised our newsletter subscribers to realize profits on their short-term positions and remain heavily in cash. Cash is the best “trade” to own during a correction, as it preserves your capital to buy the resulting bargains after that rebalancing selloff has run its course.
Like last summer, the VXO reads heading into this latest selling event were incredibly low. Thus we are likely to need a lot more stock-market selling to drive the levels of fear necessary to totally erase the recent greed. This is self-evident in this latest pullback’s interactions between the SPX and VXO. Though this selloff has already been substantial, fear still remains far too low for a bottoming.
Since the final trading day in April when the SPX peaked at a new post-panic high of 1364, this flagship stock index has fallen 7.2% over the past 7 weeks or so. This already makes today’s selloff the second-largest (and longest) pullback (4% to 10%) of this entire cyclical bull. Similar 7%ish pullbacks drove VXO levels to 30.9 in July 2009 and 27.4 in August 2010. So to see today’s latest VXO high of merely 20.5 indicates a lot of sentiment-rebalancing work is still left to be done.
The stock markets essentially ground sideways in a high consolidation between February and May. And since the SPX stayed near highs, complacency remained stellar. The only interruption was that early-March 6.4% pullback that climaxed at a VXO read of 28.9 just after that terrible Japanese earthquake and tsunami. Other than that, we haven’t seen any meaningful fear since last summer.
In April 2011 the VXO averaged just 15.2 on close, very low. This was even worse than April 2010’s average VXO close of 16.1 just before last summer’s massive SPX correction. The longer that fear is absent from the markets, the more complacent and greedy traders become. Thus the more selling is necessary to ignite the necessary fear to create a high-probability bottoming. Prudent traders who can patiently wait for these fear levels, safe in cash, enjoy an incredible buying opportunity.
So until the VXO shoots up above 28 or so on close, or into the mid-30s if this SPX pullback extends to a correction-magnitude 10%+ as I expect, I would be very careful here. Pullbacks and corrections within ongoing bull markets don’t end until sentiment is rebalanced, and it takes well-defined levels of fear to accomplish this. And so far, even despite June’s aggressive selling, we have yet to see it. This means there is likely more selling to come.
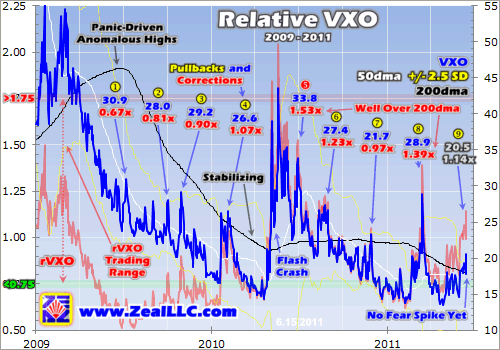
While the VXO (or VIX if you prefer) is a perfectly-fine fear gauge, there is an alternate approach I’ve used in past years. It is based on my Relativity Trading system, using the VXO’s 200-day moving average to establish a recent volatility baseline. While absolute VXO levels are generally pretty comparable over time, occasionally baseline volatility is driven higher or lower than normal. In these situations it can be useful to measure the VXO as a multiple of its 200dma baseline, which highlights changing volatility.
This next chart shows the raw VXO in blue, along with the Relative VXO (rVXO) in red. The rVXO is simply the VXO divided by its 200dma. Charted over time, this creates a horizontal trading range. The time to buy stocks is when the rVXO is high in this range, like back in the summer of 2010 after the only SPX correction of this cyclical bull. And today, the rVXO is still nowhere close to signaling a high-probability bottoming in the SPX yet.
While this chart encompasses the past couple years or so, in Relativity trading we consider the past 5 to 6 years to define relative trading ranges. The rVXO’s current range runs from 0.75x on the low side to 1.75x on the high side. Our subscribers can log in to our website and see the large high-resolution long-term rVXO chart from which this range was derived, which is updated weekly.
When the rVXO gets low in this range, around its 0.75x support zone, volatility is too low. This means greed and complacency are too high and an imminent SPX selloff is likely. This only happens after stock-market uplegs. Conversely when the rVXO gets high in its range, around its 1.75x resistance zone, volatility is too high. This means fear is excessive and an imminent sharp SPX rally is likely. This only happens after stock-market pullbacks and corrections.
Like sentiment forever oscillates between greed and fear, so does volatility perpetually meander between low and high states. Whenever it gets too low or too high, the smart contrarian bet to make is the mean-reversion one. Any extremes in the financial markets, no matter where they occur, almost always eventually revert back to their long-term averages. Mean reversion is a critical principle for success in speculating and investing alike, always be aware of it whenever something is out of whack.
Note today that despite the recent sharp SPX selloff, the rVXO has merely climbed to 1.14x at best. This is still well below the midpoint in this indicator’s secular trading range! Last summer’s SPX correction saw an rVXO peak near its end of 1.53x, and the last pullback in March 2011 went as high as 1.39x in the trading week surrounding the SPX’s bottoming. So just like in absolute terms, also in relative terms the VXO remains too darned low to signal the end of this selloff. Fear just isn’t high enough yet.
Stock-market corrections are exceedingly-crafty devils. They often advance two steps lower before rebounding one step back to keep fear from building too rapidly. These countertrend rallies within corrections keep traders fully deployed as long as possible. Big up days in between the selling stretches convince traders that the selloff must be ending, so they keep their capital in harm’s way. By the time the correction is truly finally maturing, it is too late and they’ve already suffered big losses in their positions. Nothing generates fear like watching your own trades hemorrhage your capital!
So buying again just because the stock markets start rallying and sentiment feels a little better is a fool’s errand. Speculators and investors alike are far better off watching the VXO, VIX, or some other well-established sentiment gauge. Selloffs should only be aggressively bought once fear is high enough, as measured by the precedent from the ends of previous pullbacks and corrections, to mark a high-probability bottoming. And the VXO remains far from that metric in our current selloff.
Trading stock fear is wildly-profitable, but demands iron discipline and emotional self-control. Traders have to learn to totally ignore their own fear, because the best time to buy is right when it looks like the stock markets are ready to plunge over a cliff. When everyone else’s fear peaks, when all hope seems lost, that is when the relatively-cheap post-selloff stocks should be bought. And the VXO is an excellent non-subjective metric for traders to gauge popular fear. Always watch it carefully.
At Zeal we’ve long traded stock fear with great success. I wrote my first essay on the VIX way back in August 2002, and in the many years since we’ve greatly refined our knowledge and timing of trading stock fear. And this critical tool in our trading arsenal has certainly helped generate our spectacular trading results. Since 2001, all 583 stock trades recommended in our subscription newsletters have averaged annualized realized gains of +52%! Such rapid appreciation really multiplies wealth.
And since greed and fear are the biggest drivers of short-term price movements by far, sentiment is always a key focus in our acclaimed weekly and monthly subscription newsletters. In them I weave together our vast research, knowledge, and wisdom to help speculators and investors better understand what the markets are doing, why, and where they are likely heading. When high-probability-for-success trading opportunities arise, we recommend specific trades you can mirror. Subscribe today and start thriving!
The bottom line is trading stock fear yields the best buying opportunities within any ongoing bull market. Traders can only expect to buy low when everyone else is scared and selling, driving down stock prices to bargain levels. The implied-volatility indexes, particularly the classic VXO, offer the best way to objectively measure collective fear. Waiting for levels where past selloffs bottomed leads to great buying ops.
And today’s stock-market selloff, though substantial, has yet to get anywhere close to the fear levels seen after the rest of this bull’s pullbacks and corrections. This means sentiment is not rebalanced yet, hence more selling is highly likely to spark the necessary fear levels to eradicate residual greed. So be careful here, don’t get suckered in to the countertrend rallies until the VXO signals fear is high enough to buy.
Adam Hamilton, CPA June 17, 2011 Subscribe |
|||||||
|
|
|
|
|
|
|
|
|
|
|
|
|
|
|
|||