|
|
|||||||
|
|
|
|
|
|
|
|
|
|
|
|
|
|
|
|
|
|
|
Post-Panic Stock Rallies Adam Hamilton January 16, 2009 3458 Words
2008, of course, was the worst year for the stock markets in memory. We’ve never seen anything like it in our lifetimes. The Great Depression of the 1930s was worse, but in order to have been old enough to care about the stock markets back then a trader would have to be around 95 years old today. For all but that elderly infinitesimal fraction of today’s traders, 2008 was utterly unprecedented.
Until the end of August, 2008 was a garden-variety bear year with the flagship S&P 500 stock index (SPX) sporting a manageable 12.7% year-to-date loss. But then the stock panic ignited and equity prices fell off a cliff. The SPX’s losses snowballed, falling another 29.6% to end the year down a colossal 38.5%. I’ve never seen anything like it. And neither has anyone else who hasn’t been around for nearly a century.
I’ve written plenty about this stock panic in recent months. It was defined by epic volatility that rocketed off the charts to levels never before witnessed. But as discussed in our current monthly newsletter, by mid-December this extreme panic volatility had finally bled away. Normal market conditions were gradually returning, the Great Stock Panic of 2008 had ended. And not a day too soon, good riddance to it!
While the technical damage wrought by this panic was enormous, it was dwarfed by the sentiment damage. Today the great majority of investors and speculators have lost faith in the equity markets. The optimists expect stocks to grind sideways on balance for the rest of 2009, another bad year. And the pessimists expect the end of the world, a plunging 2009 with more unprecedented stock-market losses.
Like everyone else, I am trying to divine what surprises 2009 might hold so I can position my own capital accordingly as well as advise our subscribers about the highest-probability-for-success strategies this year. So this week, I decided to see what stock market history tells us about years following stock panics. Do the markets tend to grind sideways after big down years? Plunge farther? Even rise?
Before we begin, it is really important to consider the distinction between a stock panic and a stock-market crash. Although used interchangeably by most investors, they are very different events. The dictionary defines a panic as “a sudden widespread fear concerning financial affairs leading to credit contraction and widespread sale of securities at depressed prices in an effort to acquire cash.” Sound familiar?
This is certainly what we witnessed in late 2008, a bubble in fear. Excessive government intervention led to extreme fear about what the government knew that the general markets did not. In this hyper-fearful environment, investors dumped stocks at frightening rates to raise cash. While cash wasn’t yielding anything, at least it would preserve principal through the surrounding conflagration. As this choking fear spread to banks, they quit lending so credit dried up. This is classic panic stuff.
Meanwhile a crash is “a sudden general collapse of the stock market”. Technically crashes are more extreme than panics, a 20% decline in major stock indexes in 2 days (3 at most). During 2008’s panic, the SPX’s biggest 2-day and 3-day declines were just 12.4% and 13.9%. Bad, no doubt, but still nowhere close to the classic 20%+ crash metric. October 1929 (DJIA) saw 23.0% in 2 days while October 1987 (SPX) saw 24.6% in 2 (20.5% in 1). Crashes are not panics and panics are not crashes.
They even happen at different times. Crashes emerge suddenly off of very high stock prices after a powerful secular bull. As events spawned from euphoria, they generally aren’t taken too seriously at the time. Within the weeks immediately after, enthusiastic bulls are aggressively buying “the dip”. These events are perceived as a mere technical anomaly at the time, not the harbinger of a coming secular bear which is usually what they portend.
Conversely panics cascade into existence in weak markets. They happen near the ends of bears off of already-low stock prices. They slowly evolve over months, not days like crashes. They lead to such morose sentiment that nearly everyone assumes the panic-driven stock lows are going to persist indefinitely. Instead of being seen as a technical anomaly, at the time they are viewed as fundamentally rational and the herald of depressed stock prices for years to come.
So as you read this essay, realize that panics and crashes are different types of events that are not interchangeable. They do both result in stock prices falling far faster than normal. But they happen at different times, unfold at different speeds, and portend very different post-event outcomes. This distinction is not just academic, it could make a world of difference in how your capital performs in 2009.
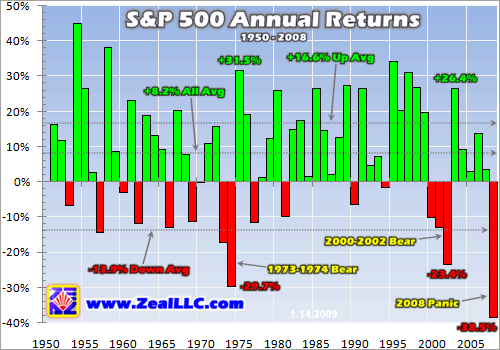
To start this analysis, I looked at the calendar-year returns in the SPX. It is the best representation of general-market performance today, the benchmark from which all market professionals measure their own performance. It has a broad cross section of strong companies representing the entire US economy. It is also market-capitalization weighted, meaning large companies have more of an impact on this index than small companies. This is far superior to stock-price-weighted indexes like the Dow 30.
It is true that calendar-year returns are somewhat arbitrary. We could just as easily consider annual returns from August 9th to August 8th, or any other permutation of dates. Nevertheless, we all think in calendar-year terms so they are the most relevant for market psychology. It is a standard everyone finds acceptable despite its inherent arbitrariness. Here’s how the SPX did over its entire 58-year history.
Over the past half century, generally the stock markets rose. The average return across all these years, including 2008’s horrific loss, was +8.2%. This is impressive considering all the turmoil seen since 1950. And it understates how equity investors did over this span since this is pure capital gains not including dividends. The SPX’s up years averaged 16.6% gains while its down years averaged 13.9% losses.
2008’s 38.5% loss is clearly unprecedented within the SPX’s history. We only saw 2 other years come remotely close, 1974 and 2002. Both were at the ends of big cyclical bears within secular bears in the same phase in their respective Long Valuation Waves. But still, compared to 1974’s 29.7% loss and 2002’s 23.4% loss, 2008’s massive 38.5% was off the charts. It was isolated too, not the end of a multi-year decline like these previous big down years. 2008 was truly the first stock panic witnessed in modern history.
The uniqueness of this panic aside, let’s just lump all big down years together for this study. To me, a big down year is a 20%+ loss in the US stock markets. Anything much less is not all that uncommon and fairly typical in bear markets. Interestingly if you remove 1974, 2002, and 2008 from the equation, the SPX’s average down year was only 10.0%. And its all-year average return jumps to +10.3%.
And what happened after big down years? After falling 20%+ in a calendar year did the stock markets grind sideways like the optimists expect today? Did they plunge even farther like the pessimists expect in 2009? Neither of the above! 1974’s 29.7% loss was followed by 1975’s massive 31.5% gain. And 2002’s 23.4% loss was followed by 2003’s 26.4% gain. These were huge up years, among the best in the SPX’s entire history.
Did January 1975 and January 2003 feel much different than January 2009? Was everything idyllic back then with hyper-bullish traders looking forward to great years? Heck no! Both times felt exceedingly awful. You probably remember how bad early 2003 felt, and ask any older trader about early 1975. At the starts of both of these big up years, the landscape looked very bleak and hopeless. In fact in Q1 1975, the US economy shrunk at a brutal 4.8% annual rate. The markets always feel horrible right after big down years.
But it’s crucial to remember the central axiom of contrarianism, that the markets are self-balancing mechanisms. The markets abhor emotional extremes. If greed grows too great, the markets fall sharply to eradicate it. If fear spirals out of control, the markets rise sharply to bleed it off. The more extreme one of these emotions, the more extreme the reaction to wipe it out. Since 20%+ down years generate extreme fear, the years immediately after tend to have incredible overshooting gains to offset the fear bubbles.
The average losses in 1974 and 2002 were 26.5%, and the average gains in 1975 and 2003 were 29.0%. This makes a reversal factor of 1.1x. In 2008 we saw a 38.5% loss. If 2009 sees a reversal of similar magnitude to the average of every other post-20%-down-year year in SPX history, this 1.1x suggests we’ll see a 42.4% gain in the SPX in calendar 2009. How many people have you seen forecasting a 40% up year in 2009? Zero I bet.
Now this probably sounds like sheer lunacy if you’re steeped in popular market culture today, which universally expects a flat-to-rotten year. But consider the mathematics of losses, which make such an outcome much more plausible. After a big loss, a big gain is far easier to achieve than one might expect. Gains after big losses, even if they exceed the loss, are not symmetrical and don’t fully undo the decline.
Imagine a stock index at 100. It falls to 50 one year, a 50% loss. The next year, it rises 50%. Yet this doesn’t wipe out the panic year. A 50% rise from an indexed level of 50 only takes it to 75. It is still down 25% from when the panic year began. So if the SPX rises 40% in 2009, an outcome Wall Street considers flat-out impossible, then this index would still be down 13.9% from the end of 2007. The markets can still remain weak overall, yet the post-panic rebound year is utterly awesome.
As a student of the markets, I couldn’t just end this thread of research here. The SPX is today’s benchmark, but 58 years is still not enough time to find another panic with which to compare 2008. So I also looked at the classic Dow Jones Industrial Average. Also known as the Dow 30 today, its history extends way back to 1885. While it is a flawed price-weighted index (a $100 stock has twice the influence on this index as a $50 stock even if the latter company has a much larger market cap), it is the classic historical benchmark.
Over 123 years, the DJIA (it wasn’t increased to 30 stocks until 1928) has averaged returns over all years of +6.8%. This does not include dividends of course. Its average up year was 19.5% while its average down year was 14.1%. As you can see in this chart, even in the context of this long swath of market history 2008’s 33.8% loss was extraordinary. There have only been 5 other years that saw 30%+ declines and 10 that have seen 20%+ declines. Losses this big are pretty darned rare.
2008 was actually this index’s third worst year ever, after an unbelievable 52.7% loss in 1931 in the bowels of the Great Depression and the 37.7% witnessed in the Panic of 1907. That’s right, a panic. In all the historical books on the stock markets I’ve read, the 1907 event is always the most prominently discussed panic even if the book was written after the Great Depression. 1907 is probably the closest analogy to 2008.
But before we delve into those 1907 events of a century ago, the Great Depression is very relevant. In 1929, the DJIA fell 17.2%. This is really pretty mild considering the mystique the infamous 1929 crash has today. This crash happened at the top after a long secular bull. The analogous event in modern times is the sharp selloff in March and April 2000 after the secular stock bull of the 1980s and 1990s climaxed in the tech-stock bubble. 2008, nearly a decade into a secular bear, is not the time to look for a crash.
The Great Depression snowballed between 1930 and 1932 when the DJIA’s calendar-year losses ran 33.8%, 52.7%, and 23.1%. Interestingly, 1933’s enormous 66.8% gain in the Dow 30 was its second best year ever witnessed, so the rebound principle held even after the Great Depression. The best year ever was 1915’s colossal 81.7% gain. If you think we had it bad in 2008, in 1914 during World War I the US stock markets closed their doors totally from late July to mid-December. There was no trading for almost 5 months!
Many people think we are entering a new Great Depression today. If that is the case, then 2009 will indeed be bad. But I don’t see a neo-Great Depression emerging for a wide array of reasons, as I discussed in depth for our subscribers in the 12/08 issue of Zeal Intelligence. The primary reason is the Great Depression saw the US economy literally cut in half between 1929 and 1933. Even the most raging bear today doesn’t expect US economic output a few years from now to be half of 2007’s levels.
To get to half, US GDP needs to shrink by 15.9% annually over each of the next 4 years or 20.6% annually over each of the next 3. It ain’t gonna happen. A panic is a fear event, nothing more. The economy may contract by 1% to 3% annually for a couple years on the outside, but there is no way we will see Depression-like economic contractions. If you study the Great Depression, you’ll probably categorically dismiss the chance of a similar event today. It was totally unique and driven by conditions radically different than 2008’s.
So yes, during that Great Depression era there were big down years followed by big down years. But this occurred nowhere else in stock-market history. Year after year of double-digit economic contraction certainly warranted such an outcome. Today even the raging pessimists think 2009’s overall economic growth will be flat to mildly negative. So I think we are justified in excluding the Depression years from this analysis.
Ex-Depression, after 20%+ down years the average DJIA gain in the subsequent year was 25.3% across 7 episodes. The worst year was 1894’s 0.6% loss following 1893’s 24.6% loss. Every other subsequent year was positive, with only 2 being in the teens and 4 seeing big gains over 28%. So unless you are betting on a neo-Great Depression, you are fighting history if you expect 2009 to be down. 123 years of history suggests it will be up big, at least the 25% average of all such years outside of the early 1930s.
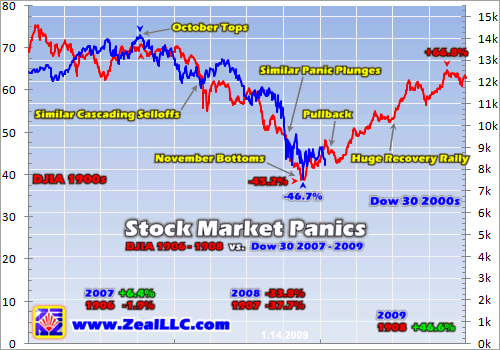
Among these historical episodes, perhaps the most relevant to today is the infamous Panic of 1907. It was the most famous event in market history until the Great Depression, even though most investors today aren’t aware of it. In 1907 the DJIA plunged 37.7%. As the next chart shows, this decline looked uncannily like today’s. Then in 1908, despite the widespread fears in late 1907, the DJIA soared 46.6%.
Realize there is no trickery in this chart. Both axes are zeroed so that there is no distortion in the relative slopes of the DJIA in 1907 (when it had 12 stocks) and the Dow 30 in 2008. The resemblance of these two panics, separated by the vast gulf of a century, is uncanny. I am sure I could pass one chart off for the other and almost no one would be the wiser. This pair of panic events was incredibly similar.
How can this be? The markets are vastly different today than 101 years ago. Very true. But one thing that hasn’t changed is human emotions. Greed and fear drives speculators today just like it did a century ago. The interaction of these emotions with herd psychology works the same way today as it did back then. A 10% or 20% selloff episode in those markets was just as scary to those investors as a similar decline is to us today.
In October 1907, a major brokerage (Gross & Kleeberg) collapsed after a stock-cornering speculation scheme failed. In September 2008, a major investment bank (Lehman Brothers) collapsed after a hyper-leveraged real-estate speculation scheme failed. Both events led to a cascading loss of confidence among investors and bankers, the latter becoming too frightened to lend resulting in credit becoming scarce. Then selling begot more selling, mushrooming the panics, until everyone remotely interested in selling had sold.
Both panics had tops in October of the previous year (on the very same day, October 9th!). Both had similar cascading selloffs in the panic year before the panic erupted in October. Both had similar sharp panic plunges in October and November. Both bottomed in November (1907 on the 15th, 2008 on the 20th). Both saw similar peak-to-trough losses over that entire sliding year (45.2% in 1907 and 46.7% in 2008). Both felt like the end of the world at the time, and both helped drive sharp economic contractions. The parallels in time and selloff magnitude are amazingly similar.
But after its November 1907 bottom, that panic started to gradually recover despite horrendous sentiment. It even saw a couple of sharp pullbacks after this recovery stealthily started. In 8 days in December 1907, the DJIA retreated 8.0%. I’m sure that scared traders into thinking the panic wasn’t over yet. In January 1908, there was a second 6.9% pullback in 8 days.
These are provocative as we’ve just seen a January 2009 DJIA pullback of 9.0% in 6 days and everyone is freaking out. But it looks like par for the course. The initial recovery out of panic lows is during a time of great uncertainty and residual fear, so it is not just a nice smooth climb back to normalcy. As usual in an uptrend, the stock markets take two steps forward then one step back. November 2008 to January 2009 fits this post-panic pattern perfectly.
Of course over the next year following the November 1907 panic lows, the DJIA surged 66.8% higher! It peaked on November 13th, exactly one year after the panic low (the 15th was a Sunday). This recovery rally was enormous and exceedingly profitable for those brave contrarian souls who bought in the midst of the panic at the depths of popular despair. And this big rally happened despite the economy not expanding again until Q3 1908. It’s a fascinating and encouraging parallel, no?
Everywhere you look today, Wall Street and market professionals expect 2009 to be flat to horrible. The economy is not recovering, they claim. Yet history shows the markets really don’t care outside of a Great Depression-like catastrophe. Stock markets recover sharply after big down years even if the economic recovery takes longer to arrive.
As a hardcore contrarian, I expect 2009 to follow this big-recovery-rally pattern so I am fighting the crowd and going heavily long. Odds are 2009 will be awesome. In late December I wrote to our Zeal Speculator subscribers regarding the SPX, “…2009 should be outstanding for the US stock markets. I suspect a 25%+ year is virtually a certainty. And a 50% year would not surprise me one bit.” I still believe this today.
At Zeal, we do all our own original research. We are not swayed by popular opinion and we don’t care what people think. We study the markets ourselves to define probable outcomes and then trade accordingly. If you are tired of the endless Wall Street groupthink, and running with the hysterical herd emotionally, give our acclaimed monthly newsletter a try. We’ll illuminate today’s markets for you based on history and show you what specific trades we are making to capitalize on these opportunities. Subscribe today!
The bottom line is stock-market history is crystal clear on post-panic stock years. Big down years are almost always followed by really big up years. The only major exception is the Great Depression, when the US economy was cut in half. If you don’t expect a 50% economic contraction today, then the only sound bet to make based on market history is for a massive up year in 2009. We are talking 25% up to maybe even 50% gains in the SPX!
It may be hard to believe a great year is even possible today, but things always look bleak emerging out of a panic. Residual fear lingers a long time, actually until stock indexes finally rise far enough to fully dispel it 6 months or so later. Stocks rebound way before the underlying economy finally starts to recover. Going long right after a panic is the ultimate contrarian bet, very challenging psychologically but promising huge potential rewards.
Adam Hamilton, CPA January 16, 2009 Subscribe |
|||||||
|
|
|
|
|
|
|
|
|
|
|
|
|
|
|
|||