|
|
|||||||
|
|
|
|
|
|
|
|
|
|
|
|
|
|
|
|
|
|
|
Trading HUI Volume Spikes Adam Hamilton February 19, 2010 2742 Words
After surging 11.9% higher in just 7 trading days, the flagship HUI gold-stock index is starting to recapture traders’ attention. Right as this rally launched a couple weeks ago, I pointed out this sector’s exceedingly bullish technicals. Since then, I’ve been examining secondary indicators including volume to see if they corroborate the key primary ones.
Trading volume, the number of shares changing hands in a given day, offers a valuable window into the ethereal realm of prevailing sentiment. When traders are complacent and bored, volume dwindles. Few get excited about trading lethargic stocks. But when emotions run high, volume often spikes dramatically. This is the case whether traders are suffering from excessive greed or fear. Volume surges when traders get excited, for any reason, and want to trade more.
Precious-metals-stock traders can capitalize on these volume tendencies to help fine tune our entry and exit points. Big volume spikes, depending on where they occur within prevailing short-term trends, can signal various important trading milestones. These include the launch days of big and fast rallies, the births of major corrections, and the capitulation episodes signaling the ends of these corrections.
For speculators and investors alike, no technical events are more important to discern than the major short-term reversals. These critical transitions from upleg to correction and vice versa mark the exact moments when it is most advantageous to buy low or sell high. Volume spikes, while being too ambiguous to be primary indicators, offer excellent secondary confirmations of major reversals.
Unfortunately in the HUI’s case, this volume analysis isn’t easy. Despite gold stocks’ spectacular 1331% gains over a 7-year span where the general stock markets lost 7%, gold stocks still get no respect. As a neglected and highly-contrarian sector even this far into its secular bull, the HUI doesn’t actually trade. It is merely a tracking index, so there is no conventional index-futures volume data available to analyze.
Working around this limitation is possible using HUI composite volume. Today the HUI gold-stock index is comprised of 16 individual-stock components. By adding together the individual trading volumes of all these component stocks, we get a composite of HUI volume as a whole. While technically easy to do, this task is still data-intensive and requires plenty of spreadsheet time. Thus HUI volume isn’t analyzed often.
While I’ve analyzed HUI composite volume in the past, trading it requires delineating between normal and exceptional activity. Defining volume spikes as exceptional in real-time is only possible if there is some baseline from which to make these judgments. The raw composite-volume data is so wildly volatile that it is hard to recognize significant volume events out of the incessant cacophony of background noise.
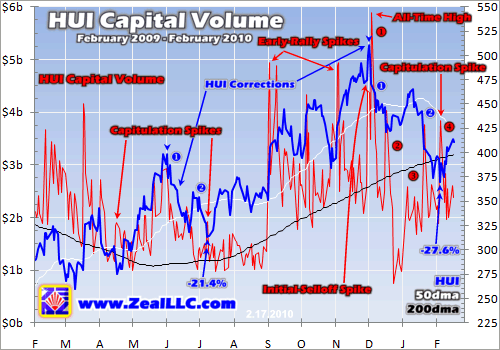
As I’ve pondered this puzzle lately, I came up with a couple ideas for solutions. HUI capital volume is fairly conventional, while HUI relative volume is an entirely new construct. Together they work to identify exceptional volume spikes in real-time to use as secondary confirmations of primary trading indicators. While I examined nearly a decade of this data in doing my research, I’m limiting this essay’s discussion to this past year to keep it a manageable length.
While conventional volume looks at shares changing hands, capital volume looks at the actual capital being traded. This distinction is important. Imagine two stocks, each doing 1m shares today. They’d naturally have equal impact in conventional volume analysis. But what if one is trading at $3 and the other at $30? While their raw volumes are equal, 10x more capital changed hands in the second. Therefore it is far more important. Capital volume is a much purer measure of actual trading activity.
This first chart looks at daily HUI capital volume over the past year. Capital volumes for all individual HUI component stocks are computed daily and then added together. Since actual capital changing hands is far more important than the raw shares traded, this perspective helps exceptional volume spikes stand out more boldly. These spikes tend to correspond with several very specific tradable events.
The three primary types of exceptional volume spikes are capitulation spikes, early-rally spikes, and initial-selloff spikes. Capitulation spikes occur late in ongoing corrections when frustrated traders trying to ride out the selling finally surrender and sell in disgust. These are fear-driven events that coincide with big down days late in corrections. My initial motivation to do this research was to see if February 4th’s 5.9% HUI selloff to a new interim low qualified as a correction-ending capitulation spike.
It kind of did. 146m shares of HUI-component stocks changed hands that day, worth $3.0b. That selloff marked the biggest raw-volume and capital-volume day in a couple weeks. Back on January 21st, a mid-correction 4.4% down day, the HUI traded 156m shares worth $3.8b. In general, the bigger the capitulation volume spike the more fear and hence the better the buying opportunity. So although I’d hoped to see a bigger spike on February 4th, that event still fit the capitulation-spike mold.
Capitulation spikes mark the critical transitions between major corrections and major uplegs. Obviously speculators and investors alike want to aggressively add long positions whenever a correction is reversing into a new upleg. We’ve been doing this at Zeal recently, aggressively buying and recommending elite gold and silver stocks in our popular subscription newsletters. This wasn’t because of volume though, which is only a secondary confirmation. The primary buy signals were the HUI technicals and the HUI/Gold Ratio.
Interestingly the day after this capitulation spike (February 5th) was a more meaningful volume spike, and brings us to the second type. It is an early-rally spike. That day the HUI surged 5.3% higher which started getting traders excited about gold stocks again. They bought aggressively, pushing through 168m shares worth $3.8b in capital terms. Early-rally spikes, as you can see in this chart, tend to happen early in big rallies. They are clear signals that sentiment is turning bullish again, that buyers are flocking back in.
The third type of exceptional volume spike is the initial-selloff spike. We last saw one in early December just after the HUI’s latest upleg topped. On December 4th the HUI plunged 5.2% thanks to a steep 4.1% gold selloff (driven by a sharp US dollar rally). That day a staggering 207m shares of HUI-component companies changed hands, worth an all-time record $5.9b! Such heavy selling was a sign that the upleg to that point had just rolled over.
Since exceptional volume spikes occur more often than just at major upleg-to-correction and correction-to-upleg transitions, we can’t rely on them as primary trading indicators. As this chart reveals, even in capital-volume terms it is not uncommon to see exceptional volume spikes in the middle of both ongoing uplegs and corrections. But when you get an exceptional volume spike corresponding with other primary technical signals, it really ramps up the odds that these primary signals are correct.
Capitulation spikes often mark the ends of major corrections, the point where the holdout traders succumb to their fears and finally surrender at exactly the wrong time. They help illuminate correction-to-upleg transitions in real-time. Conversely, initial-selloff spikes often mark the ends of major uplegs. Traders getting nervous about how fast and far gold stocks have run are quick to jump on the first significant selling, and the resulting volume spike betrays the end of the greed that drove the preceding upleg.
Interestingly both the transitions from correction to upleg and upleg to correction are selling events. The heavy volume occurs on large downside days driven by fear. But if the HUI happens to be coming off a significant interim low, exceptional volume spikes tend to happen on big up days. Heavy buying in early-rally spikes signals the return of greed, a second chance to get long to ride the rest of the upleg if you missed the primary buying opportunity at the end of the preceding correction.
Gold-stock speculators and investors alike would be well-served looking for these volume spikes. If gold stocks have run higher for months without a significant correction, and you see a high-volume selloff, odds are it marks the end of that upleg. Greed was getting too excessive so a rebalancing correction is necessary to rebalance sentiment. Large high-volume selloffs just after major interim highs are great secondary indicators that a new correction is likely underway.
Conversely if gold stocks have ground lower for many weeks or months without any meaningful rallies, and you see a high-volume selloff, it likely signals the final capitulation. Fear was getting out of control so a new rally needs to be born to rebalance sentiment. Large high-volume selloffs leading to major interim lows are a great secondary indicator suggesting the ongoing correction has finally run its course.
A couple more points before we move on. Note above that our latest correction since early December has witnessed 4 separate exceptional volume spikes. We had the initial-selloff one, a couple much smaller mid-correction ones, and the latest a couple weeks ago which will probably prove to be the final capitulation spike. Back in the HUI’s last correction in June and July, we saw a similar pattern. As discussed a couple weeks ago, HUI corrections are often two-staged. So late in a correction after two distinct legs down, the odds of a big-volume down day being a capitulation spike increase considerably.
In addition, check out the anemic capital volume during the summer months. During the usual PM summer doldrums in June, July, and August, the HUI averaged just $1.5b worth of component shares changing hands per day. Summer usually yields nothing but lethargy in the gold stocks, so don’t expect much from them then. But once the busy autumn trading season launches, volume returns. In September, October, and November, HUI capital volume doubled to $3.0b per day.
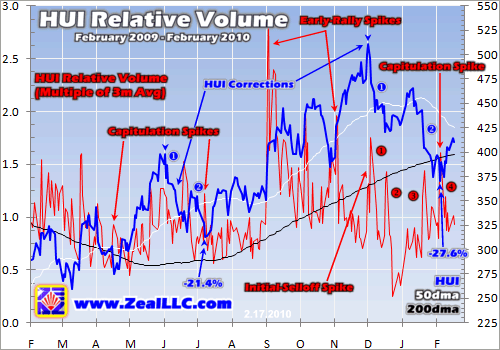
While exceptional capital-volume spikes corroborate other primary technical indicators at key reversal points, there is still plenty of noise (volume spikes not corresponding to major reversals) in this chart. So I decided to try a new construct I’ve been wondering about, HUI relative volume. It looks at daily HUI volume as a multiple of its recent average. This is similar to the principles behind my Relativity trading system.
In order to define a volume spike as exceptional, we first have to define a baseline establishing normal. If I tell you I ate a couple chocolate-chip cookies today, it is meaningless. Without knowing what I normally eat, you can’t draw a conclusion. If I told you I usually eat a dozen a day, you’d assume I went on a diet. If I told you I usually eat one a month, you’d think I had a party. Context is essential for interpreting data!
In conventional volume analysis, the baseline average most often used is 3 months. With an average month encompassing 21 trading days, this is essentially a 63-day moving average. You Zeal subscribers have seen me compare exceptional days to this average as a multiple many times when analyzing individual stocks we are trading. I’ll write something like “ABC stock rocketed higher that day on heavy volume running 3.4x the 3m average”.
HUI relative volume just extends this concept to chart form. Every trading day’s raw volume is divided by the trailing 3-month average that day, which forms a baseline “normal” level for that point in time. The resulting multiple, charted over time, offers another complimentary perspective on what constitutes an exceptional volume spike on any given day. The HUI relative-volume multiple is shown in red below.
Note in this initial analysis I used raw HUI volume, actual shares traded, not capital volume. While we could certainly look at HUI relative capital volume, I didn’t want to unduly complicate this new potential tool right out of the gates. I’ll probably look at it some time in the future though and write another essay on it if it proves interesting. But for now, this is based on straight share volume.
While relative volume reveals the same exceptional volume spikes we saw above in capital-volume terms, it paints them in a different light. This perspective reorganizes their magnitudes compared to each other, highlighting deviations from prevailing norms instead of actual capital changing hands. While the biggest capital-volume spike was in early December, the biggest relative-volume one was in early September.
On September 3rd the HUI rocketed 5.8% higher. The heavy buying resulted in a huge 202m-share day ($4.9b in capital volume). But emerging right after the slow market summer, this early-rally spike ran a huge 2.9x normal volume. It was a radical change compared to prevailing conditions to see such a massive volume spike at that time. Meanwhile the December 4th initial-selloff spike saw 207m shares ($5.9b) change hands, but the 3-month average base at the time was much higher so it was only a 1.7x relative spike.
Obviously in relative-volume terms we can see the same three types of exceptional volume spikes. There are initial-selloff spikes here marking the ends of uplegs, capitulation spikes marking the ends of corrections, and early-rally spikes signaling the return of greed-driven buying. Relative volume highlights the importance of big deviations from prevailing norms in defining exceptional volume spikes.
So which is superior as a secondary trading indicator, capital or relative? I pondered this question a lot this week as I analyzed a decade’s worth of both data series. At this point my conclusion is neither is superior, they just offer different perspectives. Capital volume reveals when big money is moving in and out of gold stocks, a very valuable tool. And relative volume shows when trading patterns change radically from their recent normal baseline.
It is probably best to use these tools in concert, much like we do with the Relative HUI and HUI/Gold Ratio as primary trading indicators. The higher both the capital volume and relative volume in any given spike relative to recent precedent, the greater the odds that spike marked an important trading event. Paying attention to these HUI volume spikes increases traders’ odds of recognizing critical short-term reversals transitioning between upward-trending and downward-trending markets.
Just after major interim highs these high-volume spike events signal the dawns of healthy corrections, the time to sell longs and get short or neutral. And during major interim lows these events mark the capitulations of mature corrections, the time to add longs and close shorts. While only a secondary indicator, it is always nice to have corroboration on primary ones. Watching volume spikes can help you more efficiently buy low and sell high in real-time.
At Zeal we are lifelong students of the markets, constantly looking for tools to increase our odds of executing profitable trades. Over the recent weeks we’ve been aggressively adding new positions in elite gold and silver stocks to ride the next upleg. While the latest volume spike agrees with the primary indicators in suggesting this upleg is already underway, it is not too late to get deployed. Both gold and silver tend to have strong seasonal rallies climaxing in May, which tend to drive big moves higher in PM stocks.
For just $10 a month, you can share in the profitable fruits of all our hard work at Zeal. This trifling sum buys you a subscription to our acclaimed monthly newsletter, Zeal Intelligence. In each issue I examine the markets, explaining what is going on and why. Against this current backdrop I apply all our hard-won knowledge, experience, and wisdom to uncover high-potential-for-success speculation and investment opportunities for our subscribers. Subscribe today, and learn how to thrive in the markets!
The bottom line is paying attention to HUI volume spikes can really help traders fine-tune their buy and sell timing. Volume surges when emotions run high, and sentiment extremes mark the critical transitions between uplegs and corrections. So when an exceptional volume spike occurs near or at a major interim high or low, it is often a sign that a reversal is imminent or already underway.
But volume spikes can be ambiguous, signaling different things in different circumstances, so they are a secondary indicator. A volume spike alone doesn’t offer enough information. It must be considered in context. Is it near a major interim high or low? Was the HUI rising or falling, and for how long, prior to the spike? And was the spike a greed-driven event on a big up day or a fear-driven event on a big down day? With a little perspective, volume spikes help traders identify key transitions in real-time.
Adam Hamilton, CPA February 19, 2010 Subscribe |
|||||||
|
|
|
|
|
|
|
|
|
|
|
|
|
|
|
|||