|
|
|||||||
|
|
|
|
|
|
|
|
|
|
US Dollar Bear Rallies Adam Hamilton February 12, 2010 2924 Words
In recent months, the US dollar has been surging higher. This impressive strength is a radical change from last year’s relentless grind lower. Across the globe, the majority of analysts expect this run higher to persist for a variety of reasons. This prospect is troubling traders of commodities and commodities stocks.
When the dollar strengthens, the prices of commodities denominated in it naturally tend to retreat. It takes fewer stronger dollars to buy a given unit of anything than weaker dollars. This inverse relationship is especially evident in the commodities investors and speculators love, like gold, oil, and copper. So for the commodities realm, the likely future trajectory of the US dollar is very important to consider.
With consensus for the US dollar very bullish today, I’m going to offer a contrarian perspective. Rather than being the start of a new cyclical bull, technically this dollar surge merely looks like a garden-variety bear-market rally within its secular bear. And provocatively, given bear-to-date precedent this particular rally looks mature. Odds are today’s dollar rally is either already over or soon will be.
I built several charts this week to flesh out this thesis, using the popular US Dollar Index to represent the US dollar. This USDX, born in the early 1970s, measures the US dollar against a trade-weighted basket of major foreign currencies. This geometrically-averaged index is dominated by the euro, at nearly 58% of its weight. The Japanese yen and British pound are the next largest components at about 14% and 12%. Just as the S&P 500 measures broader stock-market progress, the USDX measures the US dollar’s.
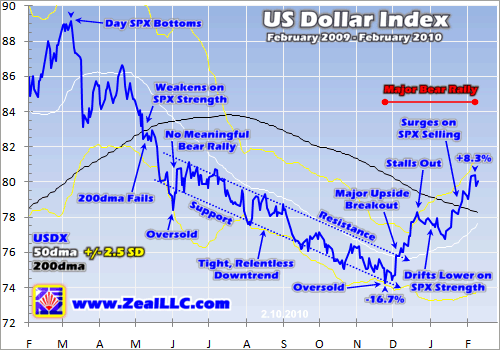
Since late November, the USDX has surged 8.3% higher. Compared to the downside trading action over this past year, this dollar rally is totally unique. So naturally it is leading to a bullish outlook on the US dollar. Technical action creates sentiment, traders grow excited and positive when prices rise quickly but worried and pessimistic when prices fall quickly. And technically it is easy to see why bullishness reigns.
For most of last year, the USDX ground relentlessly lower with nary a meaningful rally. Despite rallying US stock markets and gradually improving economic prospects in 2009 as the stock panic faded into memory, the dollar couldn’t catch a bid. After watching this currency slide all year, by November traders were growing exceptionally bearish. Bearish analysis was as dominant then as bullish analysis is today.
But then in early December, the USDX rocketed higher on a big positive surprise (119k fewer jobs lost than expected) in the monthly employment report. That day’s massive 1.4% surge drove the USDX above its downtrend’s resistance and its 50-day moving average. This was the best technical news the dollar had had in 6 months, so technically-oriented futures traders started buying aggressively. They drove a major upside breakout which enticed in even more buyers and the dollar was off to the races.
While this powerful dollar rally soon stalled out in late December, it started surging again a few weeks later on general-stock-market selling. During the stock panic, and to a lesser degree since, the USDX had an incredibly-strong inverse correlation with the S&P 500 (SPX). You can see a stunning chart of this in an essay I wrote in August. And interestingly, the March USDX interim high shown above happened on the very same day the SPX bottomed. When stocks are weak, flight capital floods into dollars.
This rekindled panic trade sparked by the nascent SPX pullback led the USDX to surge again in late January. And this second rally was very important technically as well since it drove the USDX above its critical 200-day moving average. These 200dmas are high-probability resistance points in bears, technical zones where bear rallies usually fail. So with the USDX back above its key 200dma, does this mean the dollar is entering a new cyclical-bull phase? Most traders today assume so.
And if this short-term chart is all one considers, that interpretation is certainly understandable. But in investing and speculation, perspective is absolutely crucial. If you want to understand short-term tradable trends, you first have to consider how they fit into the long-term context. And provocatively if you zoom out to the USDX’s broader secular bear, the dollar’s recent rally looks a heck of a lot less impressive.
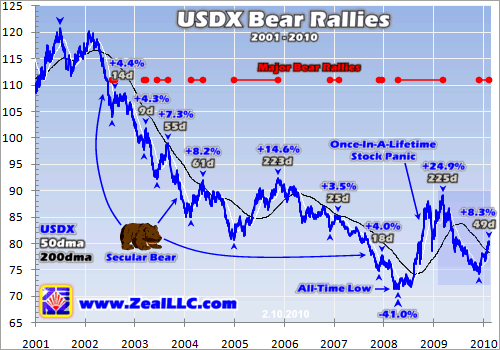
The US Dollar Index actually topped way back in July 2001, an eternity ago in trader-time. Over the intervening years between then and its all-time low in April 2008 before the stock panic ignited massive dollar buying, this index plunged by a jaw-dropping 41.0%! Yes fellow Americans, our great and glorious currency managed to hemorrhage nearly half of its international purchasing power in just 7 years! Ouch.
The shaded area in the lower right of this chart highlights the myopic short-term perspective the previous chart offered. Obviously the USDX’s latest rally looks far less impressive in this broader context. Unfortunately most analysts and traders today, who can hardly be bothered to consider any price action beyond the last few months, lack this critical perspective. It sheds a whole new light on the USDX’s newfound strength.
Every major bear rally the dollar has experienced in its entire secular bear is highlighted above. And there have been plenty of them. The recent 8.3% surge we’ve seen over 49 trading days (10 weeks) is not exceptional compared to previous bear rallies. In early 2004 for example, the USDX very similarly blasted 8.2% higher in 61 days. Back then it also forged above its 200dma, yet that certainly didn’t kill its bear.
In fact, in terms of “normal” bear rallies, today’s specimen has advanced about as far as precedent suggests it is likely to. The majority of bear rallies see USDX gains around 4%, while the larger 7% to 8% range is slightly less common. Remember that the purpose of bear rallies is to rebalance sentiment, to bleed off the excessive fear that prevails at their preceding interim lows. And so far in this secular bear, fast 4% to 8% surges have easily accomplished this mission.
But every few years or so, there is an “exceptional” bear rally. The first one unfolded in 2005, when the USDX gradually climbed 14.6% higher over 223 trading days (almost 11 months). Interestingly despite this mid-secular-bear renaissance of global dollar demand, commodities fared well. Over this very span, the Continuous Commodity Index (CCI) rose 16.7%, gold rose 9.3%, and oil soared 33.2%. This is important because many traders assume a massive dollar rally guarantees a commodities selloff, but this isn’t necessarily the case. Over longer periods of time, commodities move on their own fundamentals.
The second exceptional bear rally erupted during 2008’s stock panic, when the flight capital fleeing plummeting stocks deluged into the dollar so fast that it drove the USDX’s biggest and fastest rally ever witnessed. Never before had the USDX skyrocketed 22.6% higher in just over 4 months! It was amazing, and crushed commodities since it happened so fast. But this was a once-in-a-lifetime event, the first true stock panic since 1907. You can’t weight dollar precedent too heavily based on a 101-year anomaly.
The more years I spend studying the markets, the more I respect subtle patterns that few recognize. That stock-panic-driven USDX rally lasted 225 trading days, nearly identical to the 223 days of 2005’s exceptional bear rally. I have no idea why two radically different events would share the same duration, but it is interesting. Also, note that major interim lows in the USDX are most common in the months straddling new years. The last interim low in late November 2009 fits right into this probability band.
The key question today is whether or not the dollar’s current bear rally will stretch beyond the normal into the exceptional. I really doubt it technically and fundamentally (which I’ll touch on later). Exceptional bear rallies have only happened once every few years, and our latest one ended less than a year ago. You also need extraordinary demand circumstances to drive such rallies. And despite the media frenzy these days, the sovereign-debt problems (such as Greece now) are nothing new. They aren’t panic-grade.
Within the context of the dollar’s broader secular bear, the USDX’s recent surge merely looks like a garden-variety bear-market rally. Both its magnitude and duration are right in line with the normal bear rallies we’ve seen in past years. It is truly nothing special. And until there is strong technical evidence that suggests otherwise, prudent traders will throw in their lot with history rather than something new.
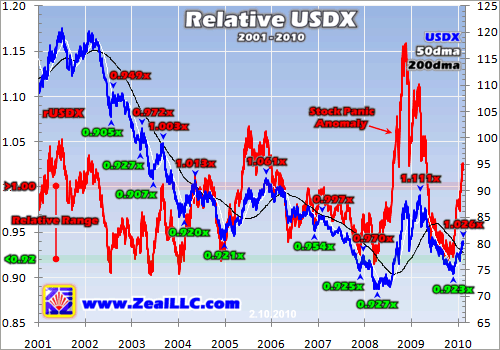
Delving deeper into dollar-bear-rally technicals, it is very useful to consider them in Relativity terms. Relativity is a trading system I developed years ago that analyzes where a price is relative to its 200-day moving average in order to discern high-probability-for-success buy and sell points in real-time. The Relative USDX, or rUSDX, simply takes the USDX close divided by its 200dma and charts it over time.
The result is rendered below in red. It reveals where the dollar is relative to its 200dma as a constant multiple, ensuring percentage changes are perfectly comparable across time. The 1.00x line represents the dollar’s 200dma. The rUSDX falls lower in the dollar’s bear downlegs and then shoots back up towards its 200dma in the subsequent bear rallies. The result is a horizontal rUSDX trading range between 0.92x (major interim lows) and 1.00x (ends of bear rallies).
The rUSDX values for the beginnings (green) and ends (red) of each major bear rally from the second chart are noted here. Back in late November 2009, the rUSDX fell to 0.923x (the dollar was trading at 92.3% of its 200dma). Interestingly this was about as low as the dollar ever gets in relative terms. If you look at all the major interim lows shown in green, values around 0.92x are the most common by far. Thus this is the bottom of our horizontal rUSDX trading range, the equivalent of support.
Why does the dollar tend to bottom around 0.92x? Just as prices get overbought and need to correct in bull markets, they get oversold and need to rally in bear markets. Both types of countertrend moves are necessary to rebalance away extreme sentiment. In the case of the dollar, whenever it sells off fast enough to approach a relative 0.92x odds are there is unsustainable near-term fear so a rebalancing bear rally is imminent. Over the years we’ve accurately called many gold corrections (triggered by dollar bear rallies) using this oversold-dollar metric.
The dollar’s rally in recent months conformed perfectly to this well-established secular-bear pattern. As I warned our subscribers at the time in November, the US dollar was way too oversold. There was too much pessimism and fear in it to be sustainable. Then right on cue as we’ve seen so many times before, the dollar soon started surging higher. So realize that the birth of our latest USDX rally was very typical and predicted in advance. It was nothing new.
Conversely, earlier this week the rUSDX surged to 1.026x (the dollar edged 2.6% above its 200dma). If you examine the red rUSDX readings at all previous major-bear-rally tops, this is right in line with normal bear rallies. This is why 1.00x is the top of our rUSDX trading range, resistance. Once the USDX rallies far enough and/or fast enough to hit its 200dma, all the fear from the preceding interim low is long gone. This sentiment reset clears the air and allows the dollar’s fundamentals to once again reassert themselves.
Before we get into these fundamentals, it is important to understand just how normal and unremarkable the dollar’s recent advance has been in technical terms. It was a textbook-perfect bear-market rally, right in line with the majority of bear rallies we’ve seen in this long secular bear to date. With this rally looking mind-numbingly typical, today’s bulls have a heavy burden of proof in trying to argue it is anything beyond a normal bear-market rally. And if it is indeed a normal bear rally, it is probably mature and ready to roll over.
As always after a sharp USDX rally, bullish analysts love to make fundamental arguments to rationalize their popular stance. In the last couple weeks for example, I’ve seen a surprising number of analysts on CNBC claiming that the euro currency is in jeopardy due to sovereign-debt issues. This death-of-the-euro talk is woefully exaggerated though. One of many countries growing its government too large and getting into trouble is no more of a threat to the European Union than California defaulting on its “sovereign debt” would be to the United States. Though the euro is a strange composite currency, it isn’t going to implode.
The real issue with the US dollar today is not the euro, but its own fundamentals. The US dollar’s own unique supply-and-demand profile is what is going to drive its international price in the coming years. And there is no doubt at all that the dollar’s fundamentals remain terribly bearish. The goofy US government is creating vast new fiat-dollar supplies at the same time global demand is waning.
No matter which socialist party is in power, the falsely-so-called Republicans or Democrats, Washington perpetually lives far beyond its means. Despite the crushing tax burdens it imposes on us Americans, it still can’t quit spending vastly more dollars than it forcefully steals from us. So it is constantly issuing new debt and creating new currency to finance these appalling deficits. Because of out-of-control government spending, the US dollar supply continues to expand rapidly and relentlessly.
According to the US Federal Reserve’s own data, since this dollar secular bear began in July 2001 the broad MZM money supply of US dollars has surged 82.5%! Given such a mammoth increase in the dollar supply, it is actually pretty amazing the USDX was only down 33.8% bear-to-date as of this week. This huge surge in the dollar supply equates to a compound annual growth rate over this secular dollar bear of 7.3%. On average, 7.3% more dollars compete for goods and services in each subsequent year!
But even while supplies relentlessly increase dollar demand is waning globally. Hardly a month goes by without some development among major central banks detailing them scaling back their heavy exposure to US dollars and US Treasuries. They have seen their so-called dollar reserves plummet in value this decade due to Washington’s gross fiscal mismanagement. They see Washington running gargantuan deficits leading to mushrooming debt that will ultimately be inflated away. There is no other option.
Even today, pushing 9 years into this secular dollar bear, all around the world central banks and large investors have far too much capital allocated to US dollars. In many cases, 80% to 90% of reserves are still denominated in falling US dollars! Even if the dollar was in a secular bull, it would be prudent to diversify such heavy exposure into other currencies like the euro or even better physical gold bullion. But with the dollar still relentlessly grinding lower and Washington laughing about it, the global diversification away from the US dollar will only accelerate. The Fed’s asinine zero-rate policy hurts terribly too, robbing dollar investors of fair returns.
The dollar’s own supply-and-demand fundamentals remain exceedingly bearish, which buttresses the technical case that this currency’s recent advance was merely a short-lived bear-market rally. In order to argue a bullish case, the bulls have to dream up some fanciful scenario where global dollar demand grows faster than Washington is printing the darned things. I have yet to hear a remotely plausible one. If supply is growing at a faster rate than demand, the only possible outcome is falling prices.
At Zeal, we were not surprised at all by the recent dollar rally. For weeks in November as the USDX became increasingly oversold, we warned our subscribers that a sharp reversal higher was imminent. We pointed out that a fast dollar bear rally would hammer commodities and commodities stocks. And indeed it came to pass, especially in dollar-sensitive gold and gold stocks which plunged in December and January on the USDX’s strength. Conversely today with the USDX apparently topping, we’ve been aggressively buying back into elite gold and silver stocks heading into the strong spring seasonals.
We’ve devoted our professional lives to diligently studying the markets to vastly improve our odds of multiplying wealth through investment and speculation. The deeper you understand the markets, their past precedents and tendencies, the more high-probability-for-success trading opportunities you can discover and ride. For as little as $10 a month, a pittance, you can share in the profitable fruits of our hard work, knowledge, and wisdom. Subscribe today to our acclaimed monthly or weekly newsletters!
The bottom line is despite all the dollar enthusiasm and bullishness these days, so far all we’ve seen is a typical garden-variety bear-market rally. Throughout the dollar’s long secular bear, similar rallies have periodically erupted to erase oversold conditions and rebalance away excessively pessimistic sentiment. These are merely technical events, they don’t herald new bulls. Until global dollar demand growth starts to exceed supply growth, the US dollar’s strong secular bear will continue grinding lower on balance.
This is great news for commodities and commodities-stock traders. A maturing dollar bear rally means the headwinds driven by this sharply-rising currency will likely soon be behind us. This has already created fantastic buying opportunities in precious-metals stocks that are spreading into other commodities-stock sectors as well. Once the dollar’s secular-bear retreat resumes and mainstreamers catch on, the entire commodities realm will again see massive capital inflows.
Adam Hamilton, CPA February 12, 2010 Subscribe |
|||||||
|
|
|
|
|
|
|
|
|
|
|
|
|
|
|
|||


