|
|
|||||||
|
|
|
|
|
|
|
|
|
|
Global Gold 3 Adam Hamilton July 6, 2007 3354 Words
As American investors and speculators in precious metals and their miners, it is really easy to lapse into a provincial perspective. Although the American PM markets are certainly very important, there is a massive world out there beyond our country. The entire populace of the United States represents less than 5% of the world’s people, and a similar tiny fraction of potential investors.
We Americans have been incredibly blessed with unparalleled per-capita wealth, and it is great to see other nations around the world thriving economically too. In any country more free enterprise ultimately leads to better standards of living and more surplus capital to invest. Some of this capital will certainly find its way into gold, the ultimate long-term investment throughout human history.
And even though per-capita levels of investment outside the US generally remain small by American standards, since those living outside the US outnumber Americans by over 22 to 1 they will collectively have a huge impact in the world markets. So it is important for us to try to understand how gold is perceived outside of the United States.
As every speculator knows, it is price action that shapes perspective. When prices are high and rising, people get excited and want to deploy more capital. When prices are low and falling, people get bored or scared and walk away in disgust. So by viewing gold through the lenses of major local currencies worldwide, we can get a good idea of how locals are likely to perceive it and whether they are likely to buy or sell.
In this essay series, I have been using ten major currencies to track gold’s bull-to-date progress. They span every populated continent and encompass how the vast majority of the world’s population views gold. Some currencies are obvious choices, like China’s and India’s since they represent such huge populations. Other currencies, like Brazil’s and South Africa’s, were chosen because they are leading regional currencies on their respective continents.
In years past these charts have covered the entire gold bull to date, but this time I zoomed in to the last two-and-a-half years to increase our resolution on current technicals. If you would still like to see the original full-bull versions, our newsletter subscribers can access these high-resolution charts covering this entire bull in the private Subscriber Charts section of our website.
These charts also have a few peculiarities of which you should be aware. First, the gold prices are forex-implied, they are not true local gold quotes. Unfortunately actual local gold-price histories from around the world are notoriously difficult to find. Thankfully they are not necessary though due to the way the gold markets trade around the world today.
Since the US dollar has been the world’s reserve currency for decades now, the dollar gold price still dominates world gold trading for the time being. Virtually everywhere on the planet, the local gold price is still a function of the dollar gold price and the exchange rate between the local currency and the dollar. These forex-implied gold prices are not perfect, but in my experience they’re very close. Periodically over the last six years I have spot-checked true local prices with forex-implied prices and found them well within 1% of each other.
Second, in all these charts a rising red currency-exchange-rate line means that the local currency is gaining in value against the US dollar. A falling currency line means it is losing value against the dollar. In order to make all these charts consistent, in some cases I had to use the inverse of customary currency quotations. For example, the Japanese yen is always quoted in yen per dollar. But if charted this way, a rising yen would mean a falling chart line. This is counterintuitive, so I changed all exchange rates to the dollar cost per local unit of currency.
Finally, all gold prices are in local currency per troy ounce, even if this is not the local custom. Gold in Asia, for example, is typically quoted in price per gram on local exchanges. But in the West we are used to seeing gold prices quoted in troy ounces. In order to keep all these prices and charts consistent and comparable, all gold prices are rendered in local currency units per troy ounce regardless of custom.
After building all these charts to examine global gold technicals since 2005, some common themes emerged that you should keep in mind while you look at these charts. First, gold enjoyed a massive upleg from mid-2005 to mid-2006, the mightiest of this bull market by far. Since this upleg culminated in the major interim highs of May 2006, gold has been consolidating in tightening wedges between support and resistance all over the world.
While this long consolidation has certainly tested the patience and commitment of PM traders, it is really very bullish. Across the globe gold is now trading at high levels that would have been considered a nearly impossible dream only a couple years ago. But today these same high levels, since we have seen them for over a year now, seem routine and boring! This consolidation is acclimatizing traders around the globe to considering today’s prices as normal. It is building a rock-solid base from which the next major upleg will soar heavenwards.
As these wedge-shaped consolidations all over the world tighten, gold will soon have to break out one way or the other. With its fundamentals still remaining so bullish, and it suffering through such negative sentiment today, the odds heavily favor this breakout happening to the upside. So as you digest these charts, look at the parallels between gold in these major currencies and realize the high consolidations are forming new bases to support gold’s next big upleg.
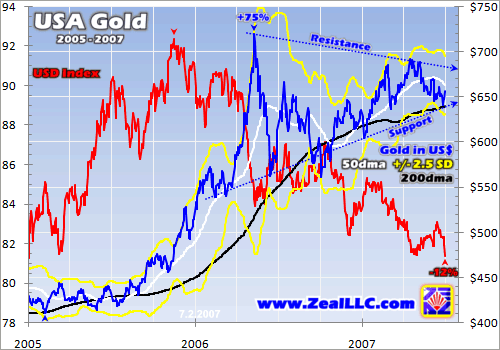
Since the US dollar gold price still dominates the global gold market for the time being, this is the reference chart off of which all others should be compared. From February 2005 to May 2006, gold soared a breathtaking 75% in dollar terms. This was an awesome upleg, but as it matured sentiment became irrationally exuberant so a correction was necessary and expected. Over the 14 months since, the consolidation has done its job of crushing euphoria and gradually shaking weak hands out of this market.
Although even American gold enthusiasts are generally despairing and negative today, this chart is really impressive. Gold has been climbing higher on balance since early 2006 as its rising support line shows. Resistance is descending to create a consolidation wedge, but this is only because of May 2006’s euphoric surge. If that short-lived surge is erased, gold would actually be within a nice uptrend channel today.
In any case, the highest-probability-for-success time to buy any asset within a secular bull is when its price temporarily falls back down to its 200-day moving average and support. Today gold is in just such a bullish place. It is from situations like today’s, where gold is unloved and languishing low technically, that mighty uplegs launch. Note above that gold traded sideways throughout most of 2005, consolidating like today, before it soared in its biggest upleg of this bull. Consolidations precede big uplegs.
Finally, note the US Dollar Index here, the red line. Since late 2005 the dollar’s secular bear market has reasserted itself and dragged the dollar down another 12%. The dollar is so low today that it is within spitting distance of hitting new multi-decade all-time lows! And since there are few things better for gold than a loss of faith in major fiat currencies, the USDX tracking under 80 should lead to a major boost in global gold investment demand.
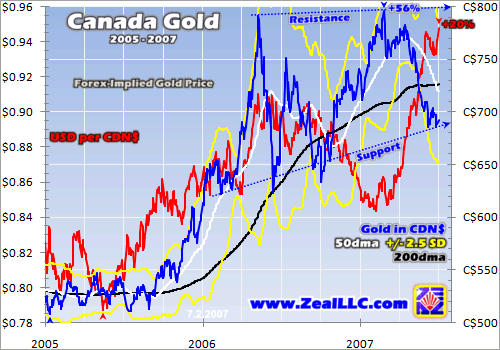
The Canadian dollar is thriving on the relentless US dollar weakness. Just this week, it came within a penny of hitting a 30-year high versus the ailing US dollar! Although the strengthening Canadian dollar ate up some of the gains in US-dollar gold, Canada gold is still up 56% since early 2005. Provocatively it just made a new high back in late February of this year that even slightly exceeded its May 2006 high. So Canadian gold investors haven’t had to wait as long for new bull-to-date gold highs as the rest of the world.
Despite the wild currency fluctuations, the same key technical pattern is readily evident in Canada gold. It has been consolidating sideways for over a year now, its rising support creating a wedge. This is getting Canadian gold investors comfortable with the idea of C$700 to C$800 gold being the new normal range. It is from this base created by this consolidation that the next major gold upleg will launch. And with Canada gold at its support and under its 200dma, it is a great time for Canadians to buy gold.
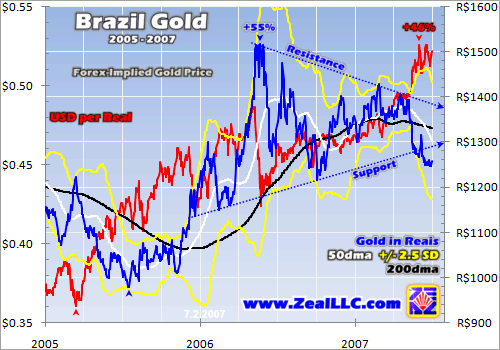
Brazil’s currency has soared over the last couple years, up an incredible 46% against the US dollar. This has certainly neutralized some of dollar gold’s gains, but real gold has still had an awesome 55% run. Brazil gold has been coiling in a tightening wedge too, and intriguingly it is the only one of these currencies where gold has apparently broken out to the downside. A recent surge in the Brazilian real drove gold lower under support. But I suspect this downside gold action will be short-lived, as the overdue global gold rally will quickly push Brazil gold back up into its wedge.
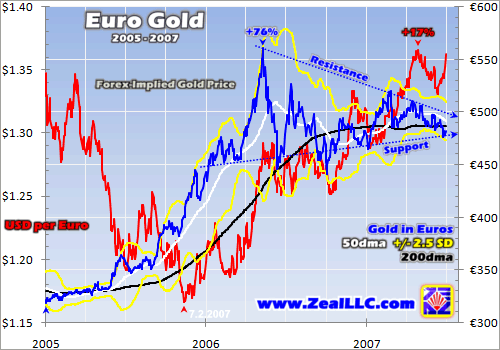
The gains in euro gold over the last couple years have been amazing, 76%! Since the euro-block countries contain around 8% of the world’s population, and since European investors are so wealthy in a per-capita sense compared to most of the world, and since Europeans have long had a solid cultural affinity for gold, I think this euro gold price is extremely important. When euro gold breaks out of its wedge and powers higher, European investors could really accelerate this upleg as they chase gold.
While euro gold is down under its 200dma and at its support today, the narrowing mouth of its consolidation wedge is the tightest out of all these currencies. This means that euro gold will have to break out soon, one way or the other. Just like euro gold finally breaking €350 back in June 2005 announced the birth of the much more powerful Stage Two gold bull, it could again be a euro gold breakout above this wedge that triggers enough European buying to ignite the next major upleg.
With the euro itself near an all-time high against the US dollar, Europeans are going to be getting more and more nervous about their US investments. Currency losses can quickly crush any gains achieved overseas. What better place than gold to park capital if fears of big dollar losses and new all-time lows start to grow in popularity.
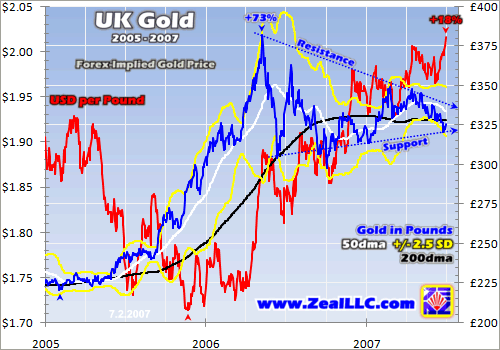
Interestingly UK gold is in a very similar position to euro gold. While the pound has soared 18% versus the dollar since late 2005, UK gold still managed a massive 73% run higher between early 2005 to mid-2006. The same currency-crisis dynamics should affect British investor thinking too, as the pound just made a 26-year high versus the US dollar. If British investors see further gains in the pound, they are going to be less comfortable owning US stocks and bonds and may start buying gold instead.
All these multi-decade currency highs relative to the dollar ought to frighten the US Fed and Washington. Fiat-paper currency is a very fragile thing based on nothing but faith in the issuing government. It is quite literally a confidence game. If the Fed keeps printing money like there is no tomorrow and the dollar keeps falling to new all-time lows, it really could create a crisis of confidence in which gold will thrive.
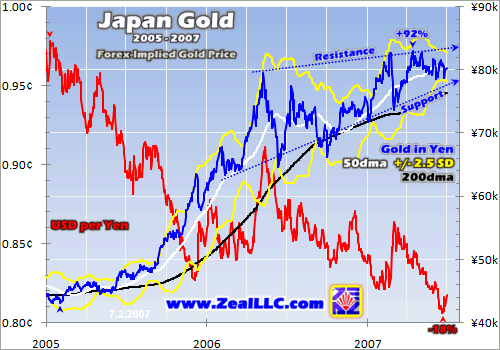
If the US Fed wants lessons on how to utterly destroy a currency, it can look to Japan. Despite the latest downleg in the secular US dollar bear, the Bank of Japan still managed to create an impressive 18% loss in the yen relative to the dollar. It’s a race to worthlessness! Naturally this has made gold look exceptionally strong in Japan, up 92% since early 2005. And yen gold just made its latest bull-to-date high in mid-April. While it has indeed been consolidating, the eroding yen has created a rising wedge in Japan gold.
Japan is destroying its own currency through irrationally low interest rates and excessive money-supply growth in order to subsidize its export industry. This is incredibly stupid. Free markets only thrive when monetary policy doesn’t play favorites between savers and debtors. Since savers are getting slaughtered in Japan, more and more are flocking to the immutable stability of gold. The spark that ignites the next global gold upleg could very well prove to be Japanese investors starting a heavier migration into gold to protect their enormous savings.
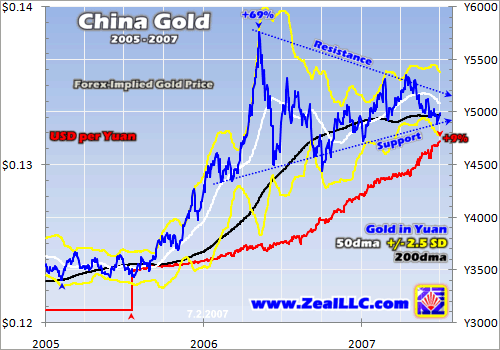
As a student of the markets, I find this China gold chart the most intriguing of all. For a decade or so ending in July 2005, the yuan was pegged to the US dollar. So up until this point the yuan gold bull was a perfect mirror of the dollar gold bull. But since the yuan was quasi-freed to float a bit, it is up 9%. This strength is eroding some of dollar gold’s gains in yuan terms, but yuan gold still shot 69% higher in its last major upleg. It is also at support and under its 200dma today, the ideal time to buy technically.
China is especially interesting today in gold terms because its stock-market bubble is imploding, mirroring the early NASDAQ bust in 2000 remarkably well. In the West when investors face a stock bubble bursting, some flock to gold as a safe haven of protection from the turbulent stock markets. And since the Chinese have a much deeper cultural affinity for gold than we Americans will ever have, I suspect they will pile into gold once their accelerating stock slide starts really scaring them.
If this happens, overall global gold investment demand will really start growing. The Chinese investors sure aren’t rich by American standards, but there are so many of them that the capital they collectively control is massive. Coincidentally, the Shanghai Gold Exchange is launching a new gold-trading service for individual investors that will make it far easier for Chinese investors to buy and keep physical gold. And with China gold’s technicals looking gorgeous regardless of stock-market action, Chinese gold demand should really start to grow and help drive up world gold prices.
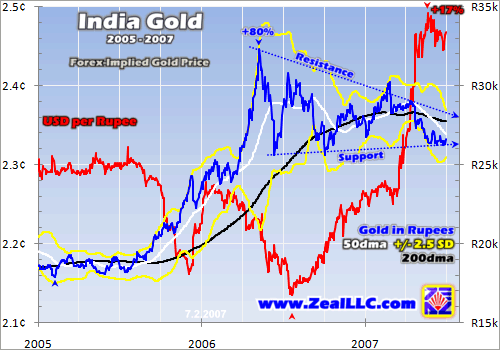
While the Chinese have liked gold forever, I don’t think anyone loves it more than the Indians. Gold is such a huge part of Indian culture that it is probably the world’s biggest growth market for gold investment demand. And with India gold up 80% in the last major upleg, Indian investors are paying attention. Rupee gold is also in a wedge, and it is tightening just like the other wedges and will soon break out. If the Americans, or Europeans, or Japanese, or Chinese start buying, rupee gold will soar in short order.
And interestingly Indian wedding season is approaching at the end of summer, after the harvest. Gold is a huge part of these marriage rituals as wealth in the form of dowries is often converted into beautiful gold jewelry for the brides. While in the States we tend to separate jewelry gold from investment gold, in India jewelry often serves as investment. With Indian gold demand on the verge of its usual seasonal surge and looking very bullish technically under its 200dma, Indian investors will be buying gold too.
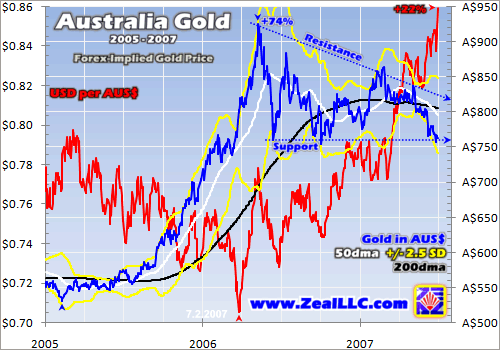
Since the Aussie dollar has been so strong over the past year or so, the Australia gold wedge is much flatter than most other countries’ wedges. With a dead-flat support line around A$760, Australians have had a tougher time psychologically in this consolidation than Americans. At least our support line has been rising which is a subtle confirmation of bullish underlying technicals. But this weakness has made gold an even better buy in Australia in technical terms than it is in much of the rest of the world.
And Australian investors are much more likely to buy gold than American investors. It is just more accepted down under since such a big fraction of Australia’s economy and exports is driven by the natural-resources industry. So despite the flat Australia gold support, the necessary gains to drive renewed interest in investing in gold won’t need to be as great as in the States where gold is still largely reviled by the mainstream.
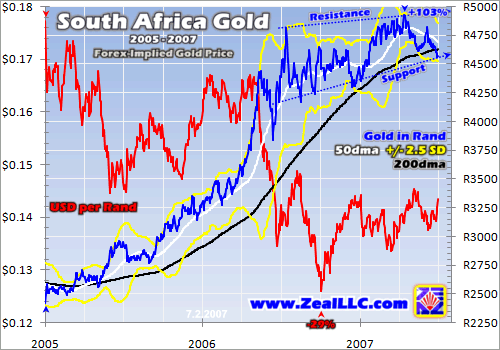
Finally I’d like to close with South Africa, which has the strongest currency on a continent full of incredible inflation and fiat-currency destruction. Yet despite South Africa’s relative strength and natural-resource-intensive economy, its Marxist government has somehow managed to drive the rand even lower versus the falling dollar. This certainly isn’t easy, as only the Japanese government has had similar success in debasing its own currency.
Because of these ongoing rand problems, the 103% gain in rand gold since early 2005 is the best of all these major currencies. While Africa’s investment community is not very large, it naturally gravitates to gold since the continent’s fiat currencies are such a mess. Right now South African investors have a rare opportunity to buy gold under its 200dma and at support, the best time within a secular bull.
Once again with these ten charts digested, major themes exist in gold that are common all over the world. Gold soared in a massive upleg ending in mid-2006. Since then gold has been consolidating, generally grinding sideways. This consolidation has gutted sentiment and made traders really negative on gold, but it is really quite bullish. It has convinced traders that today’s gold prices are the new norm, so once they start buying again gold will launch much higher from here.
Within any secular bull driven by a continuing worldwide supply-and-demand deficit, the very best times to buy in probability terms are just like today. Prices fall under their 200dmas and down to support, and sentiment remains pretty bearish since there haven’t been any serious price gains in some time to attract in the momentum-seeking bulls. All over the world today we are seeing this, great gold prices in technical terms coupled with lackluster sentiment that cannot persist.
At Zeal we are unrepentant hardcore contrarians. We add new long positions when others don’t want to, when they are paralyzed by fear or worries. With pessimism in the entire PM realm at such irrational highs today, it seems we aren’t too far from extremes of fear. Just as markets abhor extremes of greed at major tops, they don’t allow fear extremes to last too long either. Instead a major rally happens to obliterate the fear.
All over the world, gold looks like it is on the very verge of such a major rally. Odds are it will turn out to be a major or perhaps even massive upleg. As always, gold’s renewed strength will spill over into silver and the precious-metals miners. We’ve been aggressively buying elite gold and silver miners in recent months in order to lay in positions ahead of this highly-probable new upleg. Subscribe today to our acclaimed monthly newsletter and mirror our trades before this exceptional buying opportunity ends when gold explodes higher!
The bottom line is all over the world as these charts revealed, gold appears to be near the end of maturing consolidations. It won’t take much buying to break gold free from its tightening consolidation wedges and then technically-oriented traders will pour in and drive it higher. And since gold’s fundamentals remain awesomely bullish, the wedge breakouts should indeed occur to the upside. Mined supply and even central-bank sales just cannot keep pace with relentlessly rising investment demand worldwide.
All around the globe, investors have great technical reasons to add new long positions in the precious-metals realm right now. Sooner or later, just as in 2005, this new buying will reach critical mass and gold will soar again. Today’s irrational fears will rapidly evaporate and we’ll be off to the races in gold’s next major upleg.
Adam Hamilton, CPA July 6, 2007 Subscribe |
|||||||
|
|
|
|
|
|
|
|
|
|
|
|
|
|
|
|||

