|
|
|||||||
|
|
|
|
|
|
|
|
|
|
Global Gold Breakouts Adam Hamilton December 23, 2005 3321 Words
Emotionally the financial markets are pressure cookers, great crucibles of concentrated greed and fear. But these dangerous emotions are wholly our own, the markets don’t create them. Like a metaphysical mirror the markets simply reflect the strong feelings in our own hearts when we win or lose real capital.
While capital represents hard work and stored time from past labors as well as hopes and dreams for future prosperity, it doesn’t have to be emotional stuff. The best investors and speculators strive to be emotionally neutral. True neutrality, while it is a difficult skill to master, enables accomplished investors and speculators to transcend the emotional morass of the markets and see things as they truly are. It grants them perspective.
Based on my talks with clients as well as trolling Internet forums since last Monday, it sure looks like this crucial perspective is missing in the gold world today. Without proper perspective, a destructive descent into an emotional whirlpool of poor decision making is inevitable. I am penning this essay in the hopes that it will help restore perspective and combat the spiking gold fears I am encountering today.
To start to understand what is going on emotionally in the gold world now, we have to revisit the past half year or so. In June, July, and August, gold traded in a rather uninspiring range between roughly $425 and $450. Then in September it broke above $450 and headed into a new range from about $460 to $475 for the next couple months. This range-bound behavior, despite new bull highs in September and October, left gold investors fairly frustrated.
Then in early November, just as gold looked like it was falling out of its two-month range to the downside, gold bottomed. It closed just over $456 on November 4th and then started resolutely marching higher. Over the next 25 trading days it barely retreated and a whopping 15 of these days witnessed fresh new bull-to-date closing highs. This incredible period of strength culminated with gold closing over $528 last Monday, December 12th.
Now on every single trading day in December up to the 12th, gold closed at consecutive bull-to-date highs. It was up 8 days in a row! An 8-day streak in the same direction in any market is rare. Random daily noise introduces enough variability to ensure there are down days even during strong uptrends. Having a price move the same direction 8 days in a row is similar to tossing a coin 8 times and getting heads every time. It can happen of course, but it is rare and is not the expected outcome per probability theory.
This magnificent 25-day run that saw gold blast 16% higher coupled with a statistically improbable winning streak in December led gold to become overbought. There was a little too much excitement and euphoria and the only way the markets could bleed this off was to correct. So gold corrected. Over the next four days it lost 5%. As of this week it closed at $494 the day before I wrote this essay, down 6%.
Now is a 6% pullback after a 16% surge higher the end of the world? Is the gold sky falling? Of course not! Gold ran up fast as it approached and eclipsed $500, it became technically overbought, and it fell back to retrace a fraction of its recent surge up. I always think it’s ironic when investors get worried when a few down days string together in a row but these same investors think long strings of up days are totally normal.
Just four trading days, a trivial amount of time by any reasonable standard, of gold pulling back have led to a surge of dark fears in the gold world. At this stage I believe these fears are totally irrational. In order to combat them, I would like to share the latest charts of this secular gold bull in ten major currencies from six continents. When we have the big picture in perspective, the little stuff rightfully seems trivial all of a sudden.
If you are interested in the background and methodology behind these ten charts, I discussed it in depth in October’s “Global Gold Highs” essay. In a nutshell they show the price of an ounce of gold in major currencies superimposed over these currencies’ dollar exchange rates. Something truly wonderful is happening in gold worldwide as it breaks out concurrently everywhere. This is the single most important development in this entire gold bull to date.
Gold is decoupling from the dollar that has long oppressed it with dazzling speed, and entering Stage Two of its bull market. Stage Two witnesses gold rise across the globe in all major currencies which draws in legions of newly-interested investors who haven’t yet contributed capital to fuel this bull. It creates a virtuous circle where higher gold prices draw in more investors which drive prices even higher. Fear at the dawn of Stage Two is just plain silly.
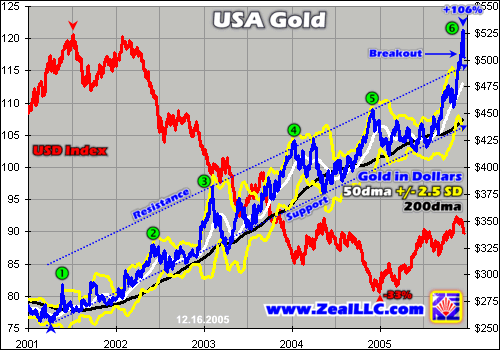
The reference chart of choice for this gold bull continues to be the usual dollar-gold chart. From early 2001 until earlier this year, gold could only move significantly higher when the dollar was falling. This led many foreign investors to rightly question whether there was really a gold bull or just a dollar bear driving up local US dollar gold. Note the strong inverse relationship between the dollar and gold up until last spring or so.
But gold’s deference to the dollar’s dominance radically changed in 2005. During Q2 gold held solid around $425 while the dollar continued its biggest bear-market rally to date. In Q3 and Q4 gold’s campaign of dollar independence intensified dramatically when it started rising independently regardless of the dollar’s machinations. This behavior was totally unprecedented in this bull market, a watershed event.
Gold’s newfound independence as it was throwing off the dollar shackles led it to an upside breakout over its five-year secular uptrend channel rendered above. It blasted up to a 106% bull-to-date gain, its sixth major new bull high. Incidentally the six numbers above that mark each of these six dollar-gold highs occur in all the charts below at the same dates so it is easier to compare global gold highs with these particular times dollar gold was brilliantly shining.
After gold exploded vertically to burst above its resistance just under $500 and of course the psychologically mammoth $500 level itself, it is not the least bit surprising to see it pull back a bit. Unless a full-blown correction is underway which is pretty improbable given soaring gold investment demand worldwide, gold will probably bounce near its upper resistance line, in the $490s, before regrouping and heading higher.
You have to admit that within the context of an entire secular bull market gold’s minor pullback in the last week really looks trivial. Perspective is everything! This gold chart is incredibly bullish and nothing short of a wicked correction that decisively breaks support (falls way under $440 or so) can change this fact. Gold looks wonderful despite the irrational fears the recent pullback has spawned among gold investors.
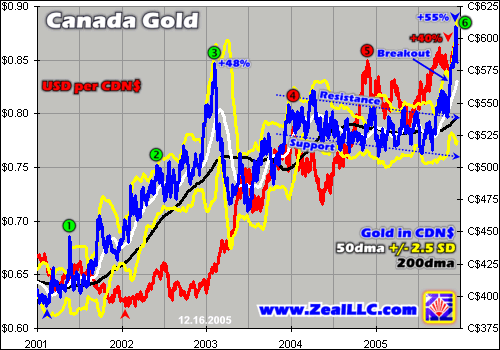
Due to exchange rates with the dollar (which are graphed in red on all these charts), our friends in the Great White North had not experienced a new bull-to-date gold high since early 2003. In fact, for all of 2004 and most of this year gold was actually in a demoralizing downtrend that is rendered above. But when gold started decoupling from the US dollar it pushed Canadian-dollar gold into a sharp breakout higher as well.
This breakout was so powerful that it blasted Canadian-dollar gold up to new bull-to-date highs above C$600! Of course Canadian-dollar gold has shared in the expected gold pullback after such a massive vertical spike, but new gold highs in Canada are very bullish. They will help convince more mainstream Canadian investors to take a serious look at gold. And the more Canadians who buy gold, the bigger global investment demand grows pushing gold even higher.
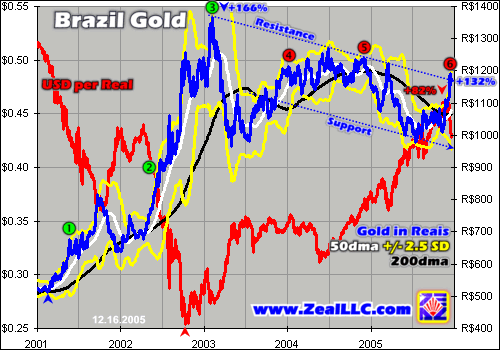
Brazil certainly doesn’t have a strong currency by world standards, but relative to the horrifically poor currency records of all the Marxist dictators who flock to South America Brazil is doing fairly well. I used it here to represent the continent. Due to the Brazilian real crashing in 2002 Brazil gold’s bull-to-date high was carved in early 2003. Despite the recent gold strength it has still not yet been able to break out of its downtrend in Brazil.
But it is getting closer. Brazilian-real gold just poked its head above its resistance line for the first time since its 2003 currency-crash top. And despite the lack of a new bull-to-date high in the last few years, Brazilian gold investors who deployed capital early on in this gold bull are doing well. Brazil gold is up 132% bull to date these days, considerably higher than the 106% gains with which we have been blessed in the States.
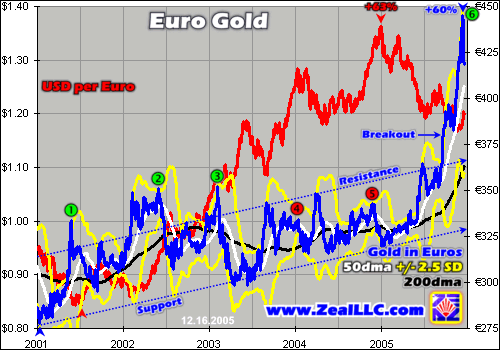
I believe this euro-gold chart remains the most important global gold chart. For years now I had been advancing the theory that euro gold breaking above its vexing €350 resistance would be the most likely catalyst to trigger Stage Two. This glorious euro-gold breakout finally happened in June and gold has not behaved the same since. The entire global gold market pivoted around the long-awaited €350 breakout.
European investors control vast amounts of capital and have a deep cultural affinity for gold so new euro-gold highs seemed destined to generate a surge of European investment demand driving gold higher. Indeed this is proving to be the case. Once gold hovered above €350 for a couple months to convince European investors that this gold bull was the real deal, they flooded in and helped drive gold higher in two sharp surges that witnessed it shatter its secular uptrend.
If you are a European investor, realize how magnificently bullish this chart is. Seven months ago your peers were worried that €350 would never fall, and now we just challenged €450! After such a blistering surge it is totally normal for gold to pull back and consolidate a bit. It needs to find a new range, a higher basing zone which unites buyers and sellers, before it surges again. This process is cause for celebration, not fear.
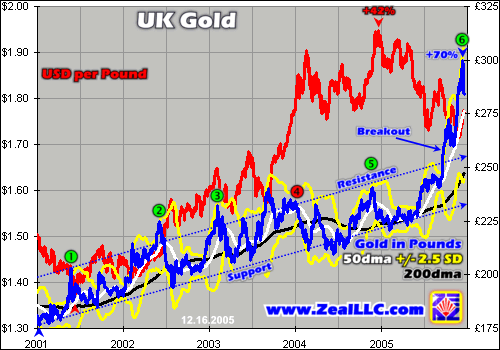
UK gold looks similar to euro gold in many ways. For nearly five years UK gold marched higher in the modest yet well-defined uptrend rendered above. And then the global gold breakout suddenly drove it not only through £250 but to £300 in the blink of an eye! Once again it is totally normal and expected for a pullback to occur after such a stellar breakout. UK gold will probably consolidate at a new higher level and form a base here.
Incidentally the knuckleheads running the Bank of England back in 2000 and 2001 that sold your country’s gold near multi-decade lows are still involved in politics in the UK. In particular Gordon Brown comes to mind. This guy was Chancellor of the Exchequer and spearheaded a terrible injustice in liquidating the British people’s accumulated gold at rock-bottom prices. If you live in the UK and vote, you ought to vote against any party involved in gutting British gold at a secular bear bottom. The gold they sold under £200 is now 70% higher!
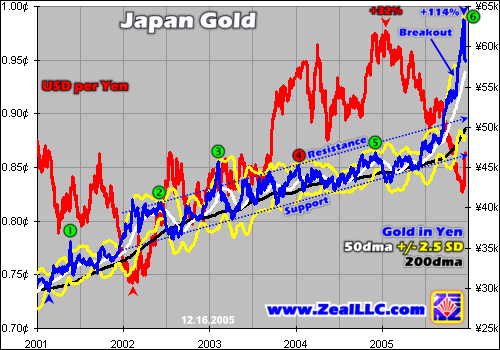
Like Europeans the Japanese investors also have a strong cultural affinity for gold. Yen gold has broken out to dazzling new highs that would have been unthinkable earlier this year. Its secular uptrend that seemed so broad only months ago is now condensed down into a narrow little band with this expanded chart. Yen gold is now up 114% bull-to-date to nearly ¥65k per ounce! The weak yen has even accelerated this breakout compared to other currencies’ gold charts.
Now the Japanese are world-renowned for their high savings rates and the terribly low interest-rate yields with which they have suffered for over a decade. If you were a Japanese investor frustrated at your lack of options and you witnessed gold, the world’s safest investment, rocket over 30% in a matter of months wouldn’t you get interested? It is not like you are earning fat yields in other investments so why not deploy some of your precious capital into the timeless safe haven of gold?
I suspect a lot of Japanese investors will make this decision in 2006. Japanese investment demand for gold should soar. Nothing begets investment demand like higher prices and these are capturing everyone’s attention. The pool of capital available to chase after gold in Japan is so massive that Japanese demand alone could probably easily sustain this current gold upleg. It is silly to get fearful of a major gold correction when the Japanese are gearing up to invest in gold in a big way.
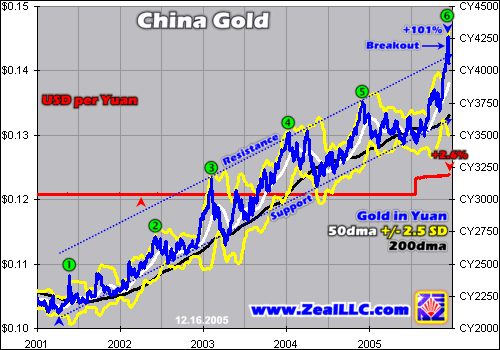
The Chinese of course are not as wealthy as the Japanese, but the raw power inherent in a huge number of investors each buying a little bit of gold is immense. Not only are Chinese investors witnessing new bull-to-date gold highs, but gold has broken out technically in yuan terms. This year alone yuan gold is up about 21%. Since the yuan was tightly pegged to the dollar until this year, Chinese bull-to-date gains are similar to US gains.
The Chinese not only have a very strong cultural affinity for gold, but they are trusting their oppressive government less and less. As the world shifts manufacturing jobs to China the average Chinese investors are growing more wealthy and have very high savings rates. With gold shining it is inevitable that Chinese capital will shift into it since it doesn’t represent mere government promises to pay like paper money. Interestingly the Chinese government is even trying to encourage this by allowing new gold exchanges to open. It understands that gold is the most-important long-term store of wealth that makes a nation financially strong.
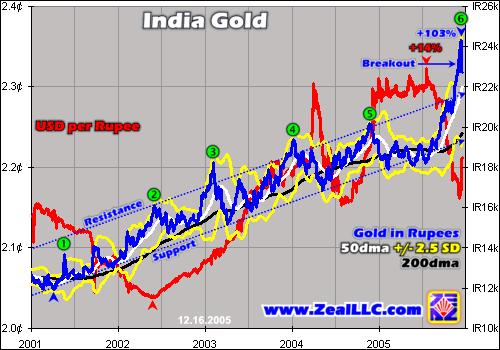
India is the biggest market for gold demand in the world because Indians also have a very deep cultural affinity for gold. Countless Indian families invest in gold and many actually wear their gold in the form of jewelry so they can enjoy their investments. Gold is a very important wedding gift in this country as well. In Indian terms gold has also just broken well above its long-term secular uptrend channel. This will interest even more Indians in gold.
The core message across all these charts is that dazzling new bull-to-date highs in gold are being carved worldwide. I have talked with investors from all over the world and investor psychology is the same everywhere. The higher the price of an asset rises, the more people want to invest in it. Indian investors are no exception. They will naturally shift more capital into gold in order to ride the bull market in the metal they already love.
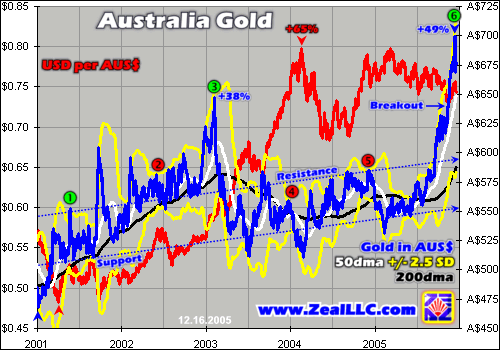
The Australian-dollar gold breakout, like the Canadian one discussed above, just led to the first new bull-to-date highs since early 2003. Many Australian investors I have spoken with in recent years have expressed concerns that the bull market in gold was not extending into Australia due to its currency strength. Since the fall of A$650 in the last few weeks though all these concerns are rapidly evaporating. In Stage Two the gold bull erupts everywhere, even Australia!
Australian contrarians have long been watching and investing in gold, buts its mainstream investors have not. But seeing gold at new bull-to-date highs and big round numbers like A$700 is exactly the kind of thing that excites investors who have not yet “discovered” this powerful global secular gold bull. There is nothing that could be more potent for igniting fresh new Australian gold demand than the events of the last few months.
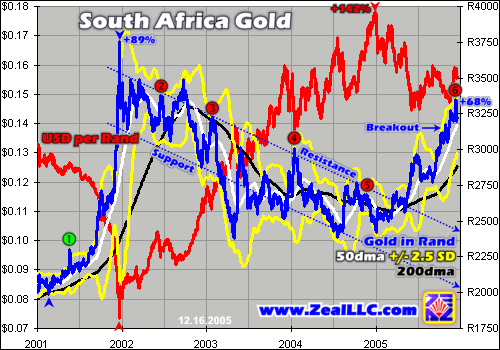
Finally we end our journey around the continents with South Africa. The rand isn’t a particularly strong currency by world standards but it is pretty impressive compared to the rest of Africa. Because the rand crashed in 2001 and drove rand gold ballistic it has since been relentlessly grinding lower in a secular downtrend. That trend was broken earlier this year but the additional surge higher in recent months drives home the point that rand gold’s downtrend is history.
Today gold is back above R3250 while the rand itself remains stable, a far cry from the similar rand gold levels witnessed in early 2002 while the currency tried to stabilize itself after great turmoil. Steadily rising gold prices in South Africa while the rand is just lazily meandering along like a normal currency will help spark interest in gold investing among mainstream South African investors.
After reviewing these charts of the global gold breakouts in the 10 most important global and regional currencies, I hope you feel some of the same sense of awe and wonder that I do. Despite gold’s trivial little pullback in recent days the metal has performed phenomenally well across the globe. It is breaking out of long-term secular trends simultaneously all over the world, an unprecedented event in this bull!
Remember how excited we were in the States when gold closed over $500 for the first time in 18 years on December 1st? Huge psychological numbers like this one are falling like dominos across the globe as gold breaks out simultaneously worldwide. Stage Two is upon us, the middle third of a secular bull market where global investment demand replaces dominant-currency weakness as the primary driver of gold.
And the greatest thing about surging global investment demand for gold is it rapidly becomes a self-feeding phenomenon. Everywhere rising prices capture the attention of investors who have not yet made the plunge into a bull market. These new investors then buy gold, which drives its price even higher and makes them happy. This in turn entices in even more capital which creates a powerful, sustainable virtuous circle, a positive feedback loop.
These global gold breakouts also show that the fears surrounding gold’s recent minor pullback in the US are totally irrational. The gains we are likely to see in Stage Two should dwarf those of Stage One and the global gold breakouts are confirming that Stage Two is here. This gold bull radically changed in fundamental terms in late 2005 and the opportunities it now holds for the future are likely to be nothing shy of tremendous.
At Zeal we have been riding this gold bull since its very beginning five years ago, through thick and thin. I have never been so excited about its prospects as I am today. We currently own gold stocks that are thriving and we have another 18 or so on our official Watch List, published in each monthly Zeal Intelligence newsletter, that we’d like to buy if gold stocks pull back far enough. These are thrilling times!
As you reflect on where to deploy your capital next year, realize that gold is shifting from a dollar-bear driven bull to a global-investment-demand driven bull right before our very eyes. The opportunities coming up in gold in the years ahead should be breathtaking. Please subscribe to our acclaimed newsletter and join us today for the new Stage Two gold bull. Fortunes will be won and we can’t wait to uncover these opportunities.
The bottom line is gold is breaking out of multi-year secular trends all over the world simultaneously. The minor pullback in recent days that is spooking investors in the US and Europe is really trivial in the grand scheme of things. Keeping the big picture in mind, perspective, is essential to short-circuiting the dangerous emotions of greed and fear that lead to poor trading decisions.
We are now being blessed to witness something truly extraordinary in gold. With the metal rising in all major currencies concurrently and enticing in new capital worldwide it is not business as usual anymore. I hope you enjoy the new stage of this powerful bull as much as I will.
Adam Hamilton, CPA December 23, 2005 Subscribe |
|||||||
|
|
|
|
|
|
|
|
|
|
|
|
|
|
|
|||

