|
|
|||||||
|
|
|
|
|
|
|
|
|
|
|
|
|
|
|
|
|
|
|
Gold Miners’ Q2’26 Fundamentals Adam Hamilton August 14, 2026 3184 Words
Despite a rough quarter for gold, its major miners just reported their second-best results ever. While their metal suffered a serious drawdown exacerbated by Fed-rate-hike fears, the miners still earned fat near-record profits. Those combined with gold stocks’ parallel selloff pounded sector valuations to their lowest levels in at least a decade and likely ever. With such strong fundamentals, the miners are great buys.
The GDX VanEck Gold Miners ETF remains this sector’s dominant benchmark. Birthed way back in May 2006, GDX has parlayed its first-mover advantage into an insurmountable lead. Its $28.0b of net assets midweek dwarfed the next-largest similar competitor ETF’s by nearly 12x! GDX is undisputedly the trading vehicle of choice in this sector, with the world’s biggest gold miners commanding much of its weighting.
Gold-stock tiers are defined by miners’ annual production rates in ounces of gold. Small juniors have little sub-300k outputs, medium mid-tiers run 300k to 1,000k, large majors yield over 1,000k, and huge super-majors operate at vast scales exceeding 2,000k. Translated into quarterly terms, these thresholds shake out under 75k, 75k to 250k, 250k+, and 500k+. Those two largest categories account for almost 48% of GDX.
Gold didn’t fare well at all last quarter, plunging 14.1% in Q2’26 proper! That was the heart of a larger serious 26.3% drawdown from an extreme peak in late January to mid-July. Gold suffered plenty of outsized down days in Q2, particularly in June. Those included a 3.7% plummeting on a US-monthly-jobs-report beat upping Fed-rate-hike odds, and a 4.3% thrashing on gold’s backward war trade flaring again.
The gold miners are essentially leveraged plays on their metal, due to their big inherent profits leverage to prevailing gold prices. With Q2’26 proving gold’s worst quarter since Q2’13, gold stocks must have been savaged. The major gold miners dominating GDX tend to amplify material gold moves by 2x to 3x. Yet very impressively, GDX only fell 17.8% in Q2 proper making for incredibly-resilient 1.3x downside leverage!
And GDX’s total drawdown from late February to mid-July was ‘only’ 38.9%, merely 1.5x gold’s parallel one. At 2.5x which would’ve been average and normal, GDX would’ve cratered a soul-crushing 65.9%! So gold stocks really outperformed in gold’s recent reckoning after its biggest cyclical bull ever in dollar terms climaxed at its most-overbought levels in nearly a half-century. Miners’ huge profits are one key reason.
For 41 quarters in a row now, I’ve painstakingly analyzed the latest operational and financial results from GDX’s 25-largest component stocks. Mostly super-majors, majors, and larger mid-tiers, they dominate this ETF at 79.9% of its total weighting! While digging through quarterlies is a ton of work, understanding the gold miners’ latest fundamentals really cuts through the obscuring sentiment fogs shrouding this sector.
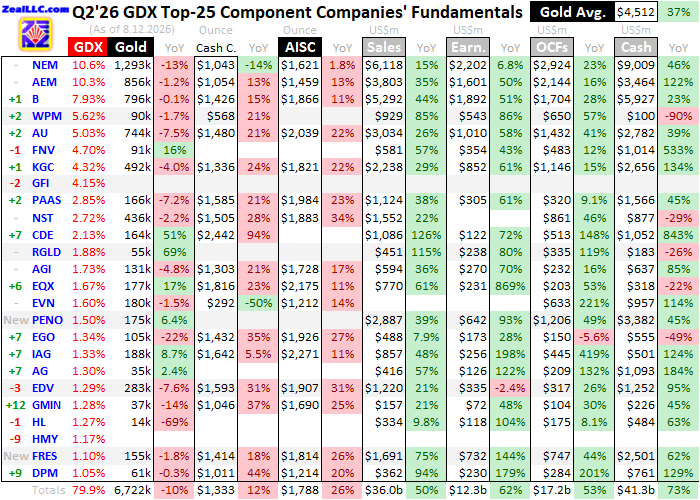
This table summarizes the operational and financial highlights from the GDX top 25 during Q2’26. These gold miners’ stock symbols aren’t all US listings, and are preceded by their rankings changes within GDX over this past year. The shuffling in their ETF weightings reflects shifting market caps, which reveal both outperformers and underperformers since Q2’25. Those symbols are followed by their current GDX weightings.
Next comes these gold miners’ Q2’26 production in ounces, along with their year-over-year changes from the comparable Q2’25. Output is the lifeblood of this industry, with investors generally prizing production growth above everything else. After are the costs of wresting that gold from the bowels of the earth in per-ounce terms, both cash costs and all-in sustaining costs. The latter help illuminate miners’ profitability.
That’s followed by a bunch of hard accounting data reported to securities regulators, quarterly revenues, earnings, operating cash flows, and resulting cash treasuries. Blank data fields mean companies hadn’t disclosed that particular data as of the middle of this week. The annual changes aren’t included if they would be misleading, like comparing negative numbers or data shifting from positive to negative or vice-versa.
Back in early July before Q2’s earnings season even started, I wrote an essay predicting gold miners’ near-record Q2. It concluded “The bottom line is gold miners will soon report near-record results, with Q2’26 proving their second-best quarter ever. Last quarter’s ongoing high prevailing gold prices combined with stable mining costs and rising production will fuel fat windfall profits.” That indeed came to pass!
That being said, last quarter wasn’t all rainbows and unicorns for major gold miners fundamentally. The GDX top 25’s total output in Q2 fell 10.4% YoY to just 6,722k ounces, the lowest seen in the 41 quarters of this deep-research thread! To be fair, that’s overstated because two South African supermajors have not yet released their latest quarterlies. Both Gold Fields and Harmony Gold will publish those in late August.
South African financial reporting is done in half-years, not quarters. And Harmony’s fiscal years end in calendar Q2s, so full-fiscal-year results have a looser deadline. For reference in the preceding Q1’26, GFI and HMY produced a massive 633k and 350k ounces respectively! They’ll have similar production in Q2. Because of their late financial reporting, my comparable Q2’25 data also excludes both supermajors.
Operating at such vast scales, the world’s biggest gold miners dominating GDX have long struggled to overcome depletion and grow. The top four are Newmont, Agnico Eagle, Barrick, and AngloGold. They combined for a colossal 3,689k ounces last quarter, 55% of the GDX top 25’s total! Yet that was still down 6.5% YoY from Q2’25 and 10.0% from Q2’24. These relentless output declines are major-specific.
About a month after every quarter-end, the World Gold Council publishes the best-available fundamental data on global gold supply and demand in fantastic must-read Gold Demand Trends reports. The latest reported that global gold mined supply in Q2 actually grew 1.9% YoY to 31,044k ounces. So the GDX top 25’s production plunging 10.4% YoY is troubling and doesn’t reflect the industry trend, majors well underperform.
That’s why we’ve always specialized in trading smaller mid-tier and junior gold miners at Zeal. Over a quarter-century now to Q2’26, we’ve realized 1,648 stock trades in our weekly and monthly subscription newsletters. The vast majority gold and silver stocks, their average annualized realized gains over that long span are running +19.8%! That includes all losers, and is the kind of track record hedge funds would kill for.
Mid-tiers have always been superior to the majors. Running smaller stables of typically one-to-four gold mines, any sizable expansions or new mine-builds really move the needle to grow mid-tiers’ production. They not only easily overcome depletion unlike their larger peers, but consistently achieve sizable output growth as a group. Smaller gold stocks enjoy outsized gains around new expansions and mines coming online.
Production growth is essential in gold mining because it provides the cashflows necessary to continue expanding existing mines and building or buying new ones, ultimately driving stock prices higher. And surprisingly mid-tiers often have lower mining costs than majors, despite the latter’s supposed economies of scale. That makes mid-tiers much more profitable relative to their production, supporting bigger stock gains.
Next week I’m going to write about the GDXJ-top-25 gold miners’ Q2 results, GDX’s little-brother mid-tier-dominated gold-stock ETF. They should trounce the GDX top 25’s like usual. GDX includes many great gold miners, but I’d never want to own it because deadweight supermajors and majors command most of its weighting. Over the last 41 quarters, GDX-top-25 gold output peaked way up at 9,525k way back in Q4’16!
Unit gold-mining costs are generally inversely proportional to gold-production levels. That’s because gold mines’ total operating costs are largely fixed during pre-construction planning stages, when designed throughputs are determined for plants processing gold-bearing ores. Their nameplate capacities don’t change quarter-to-quarter, requiring similar levels of infrastructure, equipment, and employees to keep running.
So the primary variable driving quarterly gold production is the ore grades fed into these plants. Those vary widely even within individual gold deposits. Richer ores yield more ounces to spread mining’s big fixed expenses across, lowering unit costs and boosting profitability. But while fixed costs are the lion’s share of gold mining, there are also sizable variable costs where recent years’ raging inflation hit hard.
Cash costs are the classic measure of gold-mining costs, including all cash expenses necessary to mine each ounce of gold. But they are misleading as a true cost measure, excluding the big capital needed to explore for gold deposits and build mines. So cash costs are best viewed as survivability acid-test levels for the major gold miners. They illuminate the minimum gold prices necessary to keep the mines running.
Last quarter GDX-top-25 average cash costs surged 12.3% YoY to a record $1,333 per ounce. That was roughly proportional to their production decline. With gold averaging a radically-higher $4,512 in Q2, the gold miners were light years away from turning off the lights. And cash costs were skewed high by Coeur Mining’s crazy $2,442, without which the average retreats to a better $1,267 which wouldn’t have been a record.
CDE’s staggering ‘cash costs’ are a temporary accounting fiction. In late March it finished buying out the great mid-tier New Gold. For reasons unclear to me as a CPA who cut my teeth auditing mining companies for a Big Four firm long ago, Coeur added to its Q2 costs “$140 million related to purchase price allocation ascribed to inventory, which added $834 per ounce”. Without that, they would’ve run a normal $1,608.
But interestingly the biggest driver of cash-cost inflation over this past year has been far-higher prevailing gold prices. Why? Many gold miners pay royalties on some of their production, based on percentages of gold prices. Pan American Silver breaks out royalties separately, and in Q2’26 they skyrocketed 270.0% YoY to $74m! Plenty of GDX-top-25 Q2 quarterlies attributed rising costs partially to soaring royalty payments.
IAMGOLD has the clearest reporting on royalties’ impact, publishing unit mining costs with and without royalties. In Q2 cash costs ran $1,642 with, but just $1,289 without. Royalties fueled over 1/5th of IAG’s cash costs! Though an outlying example, royalties have been a major driver of rising mining costs. And all the cash costs necessary to mine gold including royalties are the largest component by far of broader AISCs.
All-in sustaining costs are far superior than cash costs, and were introduced by the World Gold Council in June 2013. They add on to cash costs everything else that is necessary to maintain and replenish gold-mining operations at current output tempos. AISCs give a much-better understanding of what it really costs to maintain gold mines as ongoing concerns, and reveal major gold miners’ true operating profitability.
In Q2’26 the GDX top 25’s $1,333 average cash costs accounted for 3/4ths of their average AISCs that ran $1,788 per ounce. Those were record-high all-in sustaining costs that blasted 25.6% higher YoY, way outpacing these elite majors’ 10.4% output decline! Every single GDX-top-25 gold miner reporting AISCs saw substantial increases, including the world’s largest gold miner Newmont despite reporting just +1.8%.
Financial reporting is a game, companies trying to present their operations in the best-possible light to maximize their stock-price appreciation and thus executive compensation. So they are constantly reframing results to look more favorable while still being mostly truthful. Over this past year, Newmont switched its lead unit mining costs from being co-product to byproduct ones. The latter lowers reported unit costs.
Byproduct cash costs and AISCs are far more common since they credit sales of other metals mined to gold yielding more-favorable costs. NEM’s AISCs are only up 1.8% YoY since that company led with co-product in Q2’25 then switched to byproduct since. On a byproduct-to-byproduct basis, Newmont’s AISCs actually surged 17.9% YoY in Q2’26! For this research thread, I use whichever each company leads with.
Another byproduct distortion helped drive the GDX top 25’s record 25.6% AISC surge. A year ago in Q2’25 and for many quarters before, Peru’s polymetallic Buenaventura ranked in GDX’s top 25. An unusual non-primary-gold miner still choosing to report in gold-centric terms, BVN credits larger silver, copper, zinc, and lead production as gold byproducts. That drags its AISCs to super-low and even negative levels.
They ran -$668 per ounce in the comparable Q2’25. Excluding that crazy anomaly, the GDX top 25’s average AISCs climbed a more-modest 14.4% YoY in Q2’26 which is more proportional with waning output. Had Buenaventura not fallen out of the GDX top 25 by this week to 33rd place, its absurd reported Q2’26 byproduct AISCs of -$7,129 per ounce would’ve dragged the GDX top 25’s average down to just $1,264!
In the entire 41-quarter history of these results studies, I’ve always included all reported data no matter how anomalous it was. The vast majority of outlying AISCs over that decade were high ones, so BVN’s fanciful negative ones also had to be included. I hope Buenaventura never makes the GDX top 25 again, as it isn’t a primary gold miner and doesn’t belong. In Q2’26 gold accounted for under 32% of its revenues.
Rather than worrying about absolute AISC changes, more relevant is their ratio relative to prevailing gold prices. Last quarter the GDX top 25’s record $1,788 AISCs ran just 39.6% of Q2’s lofty average gold prices at $4,512. That was the second-lowest mining costs have been compared to their metal over the last 41 quarters, and likely ever. Naturally the record was the preceding Q1’26’s 35.8% on record $4,873 gold.
After my quarter-century-plus of intensely studying this sector, I’ve found the best metric for measuring gold miners’ collective fundamental performance is their implied unit earnings. That simply subtracts the GDX-top-25 average AISCs from the quarterly-average gold price. This is way cleaner than bottom-line accounting profits, since a varying GDX-top-25 subset’s are usually distorted by big noncash charges or gains.
That second-highest-ever $4,512 average gold in Q2 soared 37.3% YoY, well outpacing even distorted AISC surges to $1,788. Those combine for spectacular sector unit profits of $2,724, indeed the second-best on record after Q1’26’s $3,129! Those soared 46.3% YoY despite much-higher mining costs, which makes for fantastic growth across all the general stock markets. And that’s just the latest in a long trend.
Astoundingly over the last twelve consecutive quarters ending Q2’26, these GDX-top-25 implied unit earnings have soared 87%, 47%, 31%, 75%, 74%, 78%, 90%, 78%, 83%, 106%, 113%, and that 46% YoY! There can’t be any other sector in all the stock markets even remotely competing with such massive consistent profits growth, it is phenomenal. And this parade of windfall earnings surges ain’t over yet.
Halfway though Q3’26 today, gold is still averaging an outstanding $4,120 despite that serious drawdown bottoming in mid-July at $3,973. The GDX top 25 are guiding full-year AISCs to midpoints of $1,730, which is in line with their $1,744 and $1,788 actuals in Q1 and Q2. Many gold miners are predicting higher output and lower mining costs in Q3 and Q4, so odds are this currently underway quarter will enjoy lower AISCs.
Conservatively assume they shake out near $1,725, and gold continues recovering into quarter-end as its strong autumn rally matures. That should make a $4,200 quarterly average easily achievable. Though AISCs could be even lower and gold well higher, this still implies fantastic unit profits of $2,475 in Q3 which would surge another 29% YoY! The major gold miners sure aren’t done earning money hand over fist.
Gold miners’ incredibly-strong fundamentals last quarter were confirmed in their hard accounting results reported to securities regulators under GAAP or other countries’ equivalents. The GDX top 25’s revenues soared 50.0% YoY to $35,982m in Q2’26, narrowly the third-highest ever after the prior two quarters. And that was without those late-reporting South African supermajors, which will later push sales well higher.
That fueled massive bottom-line profits of $12,301m, which blasted up 62.2% YoY! Though I always look for large unusual items like mine writedowns that skew net profits either way, Q2’s GDX-top-25 earnings were remarkably clean. With near-record gold prices making all the world’s gold mines super-profitable, the miners shouldn’t be doing any writedowns. Q2’26’s accounting profits were also narrowly the third-best ever.
Perhaps most bullishly of all for gold stocks, their ongoing fat-and-rich earnings drove down the GDX top 25’s average trailing-twelve-month price-to-earnings ratios to their lowest levels in at least the last 41 quarters and likely ever! Amazingly midweek these elite majors are now trading at just 16.5x earnings, which is dirt-cheap for this high-flying sector! Fundamentally the gold stocks remain screaming buys today.
That certainly warrants some emphasis. From early October 2023 to late February 2026, GDX rocketed 347.1% higher mostly paralleling gold’s monster record cyclical bull. At worst since then, GDX again dropped a serious 38.9% into mid-July. But Q2’26’s $88.35 average GDX closes still remained fully 3.0x higher than Q4’23’s when this bull was born, yet majors’ earnings-season P/Es have still collapsed by over 2/3rds!
The GDX top 25’s cashflows generated from operations also blasted up 52.5% YoY to $17,215m in Q2, also the third-highest on record. That helped catapult the major gold miners’ cash treasuries up 72.7% YoY to a record $41,297m! The big gold miners that need to buy smaller miners to refill their gold pipelines have colossal cash war chests to fund acquisitions. There’ll be more buyouts in this busy year of them.
So though the major gold miners have long failed to consistently grow their production and chronically underperform their smaller mid-tier and junior brethren, damn they just reported another fantastic quarter! Sooner or later some critical mass of professional investors running funds will increasingly recognize the extreme value in this small contrarian sector. Them flooding in to chase will catapult gold stocks way higher.
Successful trading demands always staying informed on markets, to understand opportunities as they arise. We can help! For decades we’ve published popular weekly and monthly newsletters focused on contrarian speculation and investment. They draw on my vast experience, knowledge, wisdom, and ongoing research to explain what’s going on in the markets, why, and how to trade them with specific stocks.
Our holistic integrated contrarian approach has proven very successful, and you can reap the benefits for only $12 an issue. We extensively research gold and silver miners to find cheap fundamentally-superior mid-tiers and juniors with outsized upside potential. Sign up for free e-mail notifications when we publish new content. Even better, subscribe today to our acclaimed newsletters and start growing smarter and richer!
The bottom line is the major gold miners dominating GDX just reported their second-best quarter ever. Despite gold’s serious reckoning in Q2 after its late monster record bull, the miners continued earning money hand over fist. Gold remained high enough to fuel miners’ near-record unit profits, which drove gold stocks’ valuations to their lowest levels in at least a decade and likely ever. Talk about a bullish setup.
And major gold miners’ remarkable twelve-consecutive-quarter streak of massive profits growth isn’t over. Halfway through this current Q3, gold is tracking for levels that will continue fueling windfall earnings. Gold stocks ought to be one of the more-popular sectors in all the stock markets putting up numbers like these. Sooner or later investors will return in force, so get deployed before this overlooked sector returns to favor.
Adam Hamilton, CPA August 14, 2026 Subscribe |
|||||||
|
|
|
|
|
|
|
|
|
|
|
|
|
|
|
|||