|
|
|||||||
|
|
|
|
|
|
|
|
|
|
|
|
|
|
|
|
|
|
|
Silver Near-Crash Adam Hamilton May 13, 2011 3141 Words
In a single week, the manic euphoria gripping silver recently was utterly obliterated. After promising such rapid wealth creation, this metal collapsed in what can only be described as a near-crash. New investors were left stunned, while leveraged speculators were slaughtered. Sadly, they could have easily avoided these devastating losses. Silver’s massive reversal was both inevitable and predicted well in advance.
How? Before its near-crash, silver was rocketing higher in a parabolic ascent. Its daily gains had been so large for so long that its price was accelerating vertically, shooting straight up on the charts. But as every student of the markets knows, parabolic ascents are never sustainable. For a variety of ironclad technical and sentimental reasons, these surges are inherently self-limiting and soon burn themselves out.
And once a parabola breaks, prices never agreeably plateau near their highs. Instead they start plummeting, ultimately falling far faster than they had risen in their parabolic ascent. The aftermath of this near-crash is just what you’d expect, outraged wailing and gnashing of teeth. But the investors and speculators who suffer the gargantuan post-parabola losses have no one to blame but themselves.
They didn’t do their homework and bought silver at the most-dangerous time possible, in a euphoric parabola. They foolishly believed all the feeble fundamental arguments predicting indefinite parabolic gains. Their hubris led them to ignore radically-overbought technicals and wildly-bullish sentiment. They refused to study this silver bull’s history of near-crashes immediately following all parabolic ascents. And as always in the financial markets, the fruits of this willing ignorance were big and fast losses.
I tried hard to warn traders about the hyper-riskiness inherent in silver’s parabolic surge. Back in mid-March in an essay on silver toppings I wrote, “The odds are very high that silver is in store for another one of its brutal and unforgiving corrections. These are dangerous events not to be trifled with, as silver tends to plummet by nearly a third in less than 6 weeks! Silver stocks usually amplify these losses. Traders caught unaware by a major silver correction are ripped to shreds.”
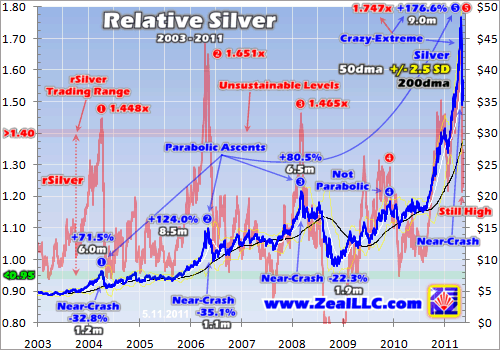
This analysis was simple and easy to understand, based on a single chart of today’s silver bull that is updated here. Silver’s past parabolas in this bull market always ended badly, plummeting in near-crashes. And since the popular greed and fear that drives these parabolas and their aftermaths never changes, there was no reason to expect the recent parabola to play out any differently. Parabolas always fail spectacularly, in any market in any country at any time in history. There is no riskier condition.
In addition to the silver price in blue, I included a metric called Relative Silver in red. Based on my very-profitable Relativity trading system, rSilver is the result of dividing the silver price by its 200-day moving average. When the resulting multiple is plotted over time, it forms a horizontal trading range. Visualize this as silver’s black 200dma line being flattened to horizontal, and then silver’s price converted to reveal where it traded relative to its 200dma in perfectly-comparable constant-percentage terms.
While silver’s latest parabola was crazy-extreme, it certainly wasn’t the first in this silver bull. Silver had witnessed three other parabolic ascents and subsequent near-crashes in the springs of 2004, 2006, and 2008. While these parabolas appear dwarfed by our recent monster, on their charts of their times they looked almost as large. For an example, check out an old chart in an essay I wrote in April 2004 just after the first silver parabola collapsed in a near-crash. It looks remarkably like today’s silver chart!
I am using this term “near-crash” because silver’s post-parabola plunges haven’t yet qualified as true crashes. In stock-market terms, a crash is a 20%+ plunge in less than two trading days. Despite how brutal it felt, silver’s worst two-trading-day performance in the last couple weeks was merely a 17.6% slide. So technically these events are very crash-like, but don’t quite live up to the formal definition of that word.
All parabolas in all markets always end badly, that is just the nature of these beasts. And this chart clearly shows that silver is no exception, despite the perpetually-bullish fairy-tale mythology that surrounds this particular metal. Every couple of years or so silver traders get excited enough to drive it vertical, capping big uplegs with parabolic surges. And then just as the deafening euphoria and overwhelming bullishness climaxes, silver plummets in another near-crash like clockwork.
Visually these past parabolas can’t be measured precisely, which is where rSilver comes in. It shows where silver was trading as a multiple of its 200dma at past parabolas’ tops. Silver simply can’t sustain levels 40%+ above its 200dma for long. Once rSilver stretches beyond 1.40x, which not coincidentally only happens in parabolic ascents, odds are it is due for an imminent sharp correction. The markets abhor extremes, and the epic greed necessary to drive such overbought silver levels soon burns itself out.
In this silver bull’s first parabola that climaxed in April 2004, rSilver hit 1.448x. In silver’s second parabola giving up its ghost in May 2006, which was far larger and much more similar to our recent one, rSilver shot up to 1.651x. And in the March 2008 parabola the Fed interrupted prematurely with a massive 75-basis-point rate cut, rSilver achieved 1.465x. Note how short-lived each of these silver spikes above 1.40x relative were on this chart. Buying silver when it is so overextended is a fool’s errand.
And this is why I was aggressively warning our subscribers to avoid the temptation of buying into the exciting silver parabola in late March and April, when rSilver stretched to a new bull record of 1.747x. $35 silver is no problem in an absolute sense, but this metal had simply rallied to these levels too fast. It was overbought, drenched in greed and euphoria, and way overextended technically. Silver’s past performance after similar extremes was uniformly rotten.
Once the sentiment pendulum stalls at extreme greed, it starts swinging back the other way towards fear. The only thing that can drive this necessary and healthy rebalancing after a parabola is a big and fast plunge. It was inevitable, a certainty. And the longer that silver’s latest parabola persisted, the greater the odds that its reckoning was imminent. Silver’s history is so crystal-clear on this that the naive traders who bought over $35 to fuel the parabola were almost certainly new to this metal in recent years.
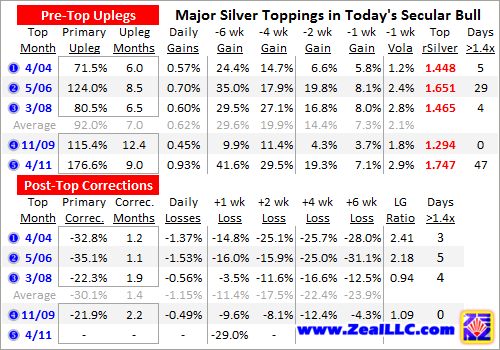
I also published this table back in my mid-March essay, quantifying past silver parabolas and their aftermaths. While silver’s first three major toppings in this bull market climaxed in parabolas, its fourth did not. So key stats from those earlier parabolas are averaged to get some benchmarks to compare the latest parabola to. As I warned our newsletter subscribers at the end of April when silver still traded near $48, this metal’s latest parabola was even more extreme and ominous than its predecessors.
Those three earlier parabolas that silver zealots brazenly chose to ignore capped uplegs averaging 92.0% gains over 7 months each. By its climax in late April, silver’s latest parabola had shattered this precedent with a mind-blowing 176.6% upleg gain over 9 months! I couldn’t believe any rational person would want to buy anything after such a big and fast move. Silver traders should have been buying last summer near $18, when silver was out of favor. Back then I predicted a big autumn silver rally, so our subscribers bought cheap.
The average daily gains of those earlier parabolic uplegs over their entire spans was 0.62% per day. But by late April this latest parabola was running half again as large at 0.93% per day! Nearly 1% gains per day over a 9-month span are unheard of, absolutely unsustainable. Even the most powerful bull markets with the best supply-and-demand fundamentals correct periodically to rebalance sentiment, and silver is certainly no exception.
But parabolic ascents don’t occur over entire uplegs, only near their climactic ends. So along with parabolas’ degree of overextendedness beyond their 200dmas, their terminal gains are a great way to measure their individual intensity. On average, silver’s first three parabolas of this bull witnessed 29.6% gains in their final 6 weeks. Our latest specimen utterly dwarfed this, with an unprecedented 41.6% terminal 6-week surge!
It was also well beyond precedent in its final 4 weeks, up 29.5% compared to the previous parabolas’ milder average of 19.9%. This monster’s final-2-week run of 19.3% was also well beyond the 14.4% average, but its final-week surge of 7.1% was in line with the 7.3% precedent. Considering all its terminal metrics as a whole, this latest parabola was the most extreme yet seen in this silver bull by far.
And look what happened to silver immediately after its earlier parabolic ascents topped. It plunged by an average of 30.1% over less than 6 weeks! That’s right, silver lost nearly a third in not much over a month! I wrote about this past precedent extensively in our newsletters, warning our subscribers that silver was due for a near-crash even bigger than this average since its latest parabola was so mind-blowingly huge.
When silver closed near $48 at the end of April, I wrote in Zeal Intelligence, “…silver is incredibly violent and unforgiving. After major uplegs climaxing in parabolic surges like we saw yet again in April, silver literally plummets. Its average correction is a whopping 30.1% in less than 6 weeks! And this was after smaller uplegs than today’s that saw less-parabolic extremes near their apexes, so the coming correction is likely to be worse.” And we bet capital on this, buying and recommending silver-ETF put options.
The fact that near-crashes always follow parabolas is warning enough. This knowledge alone ought to be plenty to get prudent investors and speculators prepared whenever the odds heavily favor an imminent silver plunge. But why parabolas erupt and then fail so spectacularly is equally important. And this enters the realm of psychology. Over the short term, especially in extreme situations, core supply-and-demand fundamentals are meaningless. Collective sentiment easily overwhelms all fundamental drivers.
Any price rally is driven by differential buying pressure, more capital bidding on something than is trying to exit. Traders naturally buy things, including silver, only when they expect the price to keep rising. This forms a self-feeding virtuous circle. Traders buy silver which drives up its price, which in turn entices in even more traders which accelerates these gains. The faster any price rallies, the more capital wants to participate. Occasionally this dynamic gets so extreme that it drives 20% to 30% gains in a single month.
Mathematically these rates of ascent are absurd, yet parabolas perpetually trap traders who can’t step back and see the bigger picture. If any price could rally 25% a month for just one year, it would surge over 14x higher (a 1355% annual gain)! No price can sustain such stupendous gains for long, but when they are happening in a brief parabola their psychological allure is immense. Investing and speculation are not about getting rich overnight, yet traders can’t resist the pull of rapidly-soaring prices.
These parabolic gains generate incredible greed and a total disregard for context and risk. So as they intensify they attract in every buyer who was going to buy anytime soon. They even steal demand from the future. Traders who may have bought silver later this summer were duped into pouring their capital in at the height of this parabola’s mini-mania. But greed is finite and eventually hits a limit. At some point everyone interested in buying into silver anytime soon has already bought, leaving only sellers.
And then it just takes some trivial catalyst that would hardly faze a market in normal times. In silver’s case as this latest gigantic parabola broke, it was a series of margin increases on silver futures. In normal times, even after silver has just experienced a strong upleg, margin increases aren’t a big deal. Back in November for example, margin hikes only drove a 3.2% single-day selloff in silver. But after a parabola has sucked in all available buyers and capital like a black hole, anything can ignite furious selling.
The only way to eradicate the epic greed present as a parabola climaxes is for prices to plummet. The fear necessary to offset greed as the sentiment pendulum swings back the other way is generated by big and fast price drops. Just as the greed fueling the parabola cascaded and fed on itself, so does the fear in the subsequent near-crash. Silver plunges, scaring some traders into exiting. And their selling drives farther price declines, which take other traders to their psychological breaking points. So they capitulate too.
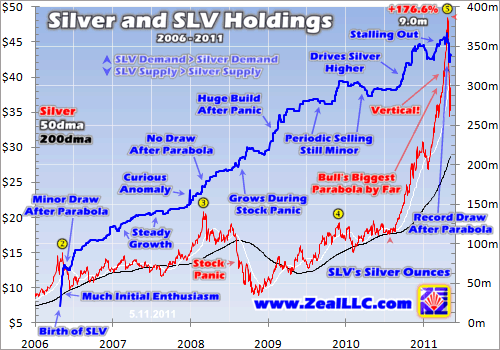
Provocatively, this recent parabola psychology on both sides was amplified by the SLV silver ETF. Back in my recent essay on silver toppings I warned about this. SLV is a conduit that enables the vast pools of stock-market capital to slosh into and out of physical silver bullion. When stock traders get greedy and buy SLV at a faster rate than silver is being bought, its custodians are forced to issue new shares to meet the excess demand. They plow this cash raised into more bullion, shunting stock capital into physical silver.
But conversely when stock traders get scared and dump SLV faster than silver is being sold, this ETF risks decoupling to the downside. To prevent this, its custodians buy back shares to absorb the excess supply. Where do they get the cash to do this? From selling silver bullion, of course! So stock traders feeling fear and putting differential selling pressure on SLV will exacerbate a silver correction. And this latest silver parabola was the first one of this bull where SLV was huge and wildly-popular.
This final chart looks at SLV’s bullion holdings in blue compared to silver in red. Note that in the two previous silver parabolas since SLV’s birth in April 2006, it was far smaller and less popular. And it didn’t see differential selling pressure, it didn’t have to dump much if any silver bullion after the spring 2006 and spring 2008 silver parabolas. Back then SLV was owned by strong hands, true believers in silver’s secular bull that weren’t going to be scared out even by sharp post-parabola near-crashes.
Even during the stock panic, the biggest fear event in a century, SLV’s holdings actually grew despite silver plunging 53.4% between July and November 2008. So in its nearly 5 years of existence before this parabola, SLV had never suffered a major selling event. Its bullion holdings were “sticky”. Its traders would generally buy SLV at faster rates than silver in uplegs, but not sell it at faster rates than silver in corrections. So there was really no precedent of SLV amplifying silver downside until this year.
One of my biggest worries for silver at its late-April parabola top was that SLV’s stickiness would fail when this parabola broke. At the end of April in our monthly newsletter I wrote, “If SLV owners get scared, which is likely if the SPX falls fast and sparks big risk-off momentum, differential SLV selling pressure could easily force this ETF to liquidate 10% to 20% of its silver in short order. This would add 36m to 72m ozs of physical silver to an already rapidly-falling market!” And indeed this is also coming to pass.
On May 4th as silver plunged below $40, SLV experienced such heavy differential selling pressure that it was forced to liquidate 4.8% of its holdings in a single trading day! This was 16.8m ounces of physical silver that hit the markets! To put this in perspective, in all of 2011 elite market-darling silver-streamer Silver Wheaton expects to produce 27.5m ounces. Yet stock-trader fear drove 61% of this silver into the marketplace in just 6.5 hours! We’re now in the first near-crash where SLV selling is accelerating this plunge, an ominous development.
Even though our SLV puts bought and recommended as silver’s parabola climaxed in late April are already wildly-profitable, even though I was right in aggressively warning about an imminent near-crash in silver, I don’t feel very good about all this. Countless small traders, new to silver and unaware of the dangers, saw their precious capital decimated in the last couple weeks. It is a shame, a huge waste, to suffer massive losses that a few hours of research could have protected against.
It was appalling to see so many professional analysts become cheerleaders in the final weeks of silver’s parabola. Instead of researching past silver parabolas or warning about the dangers of extreme greed and bullishness, they dusted off their pompoms and joined the silver-to-the-moon foolishness. It was so rare to find any contrarians, any professionals warning of the crazy danger in silver in late April. Since parabolas are so ridiculously obvious, and they always end badly, professionals are without excuse.
Were you led astray by these cheerleaders? Did you get suckered into buying silver above $35 like a fool? Did you believe the garbage fundamental theories and ignore the hyper-risky sentiment and technicals? If so, you really need Zeal. We are lifelong speculators and hardcore students of the markets. And since we are trading our own capital, we do endless research work and tell it like it is. I first started recommending physical silver near $4 in November 2001, and we and our subscribers have earned fortunes trading silver stocks since. But when silver is overbought and needs to correct, we tell the truth.
If you had subscribed to our acclaimed weekly or monthly newsletters in recent months, you would have had the historical wisdom to know how perilous silver was in its latest parabola. Instead of getting eviscerated in the near-crash, you could have made big money betting on this imminent plunge. Our trading track record is absolutely awesome. Since 2001, all 583 of our newsletter stock trades have averaged annualized realized gains of +52%! Subscribe today, and start profitably anticipating markets instead of reacting in surprise!
The bottom line is silver recently went parabolic, and all parabolas end badly. This latest parabola was massive and blatantly obvious to students of the markets. Silver was accelerating vertically, rallying way too far too fast. It was wildly-overbought, stretching to bull-record extremes beyond its baseline 200-day moving average. And herd psychology was utterly euphoric, predicting $75 to $100 silver very soon.
The only possible outcome of such an unbalanced and unsustainable situation was a massive reckoning. And just as expected in advance and warned about, silver soon collapsed in a near-crash just like it has done after its past parabolic ascents. Traders trapped in this brutal plunge are without excuse, a little bit of homework and perspective easily exposed the supreme danger. The markets slaughter the naive and lazy with extreme prejudice.
Adam Hamilton, CPA May 13, 2011 Subscribe |
|||||||
|
|
|
|
|
|
|
|
|
|
|
|
|
|
|
|||