|
|
|||||||
|
|
|
|
|
|
|
|
|
|
|
|
|
|
|
|
|
|
|
Silver Toppings 2 Adam Hamilton March 11, 2011 2812 Words
After soaring 35% in just 6 weeks, silver has driven trader enthusiasm to a fever pitch. Naturally after such a magnificent surge to new multi-decade highs, silver bullishness is off the charts. Expectations for continuing near-parabolic gains are nearly universal, with ebullient commentators coming out of the woodwork to predict spectacular near-term price targets.
This exuberance is certainly understandable, traders crave big gains which silver can provide in spades. I’ve been a big fan of silver for a long time. Way back in November 2001 when silver traded just over $4, I started recommending physical silver coins to our newsletter subscribers as core long-term investments. Boy let me tell you, back then almost no one was bullish on silver as this secular bull was being born!
Since then, we’ve realized 108 silver-stock trades in our weekly and monthly newsletters. Across all of them, which include all losers and the brutal stock panic’s impact, our average annualized realized gains ran +45.3%. After this decade of successful silver-stock trading, a critical lesson dominates my mind. Like all bull markets, silver doesn’t march up in a straight line forever. It flows and ebbs. Though its bull indeed powers higher on balance, silver’s massive uplegs are followed by brutal corrections.
Now if you are crazy enough to subscribe to this theory that the silver zealots think is heretical, that silver is not going to soar indefinitely, then doesn’t it make sense to look for toppings? At some point after a massive upleg, silver is going to need to correct. Period. It doesn’t matter how bullish silver’s fundamentals may be, how greedy silver enthusiasts get, or what is going on in the physical silver market.
Silver corrected hard in the past despite bullish fundamentals, wildly-bullish enthusiasm, rumored supply shortages, tightness in certain coin markets, foreign buying, and every other silver-to-the-moon argument getting rehashed today. In fact, the more bullish, optimistic, and enthusiastic investors and speculators get, the greater the odds for an imminent sharp correction. These psychological conditions seduce in everyone interested in buying anytime soon. Once they are all in the rally burns out, and only sellers remain.
So how can we recognize dangerous topping conditions in real-time? By studying silver’s technical and sentimental conditions at its well-known past major interim highs. If you know how past silver toppings played out, then you can identify current episodes where the probabilities heavily favor a correction. And this is priceless knowledge to have, as silver’s corrections are wickedly fast, large, and unforgiving.
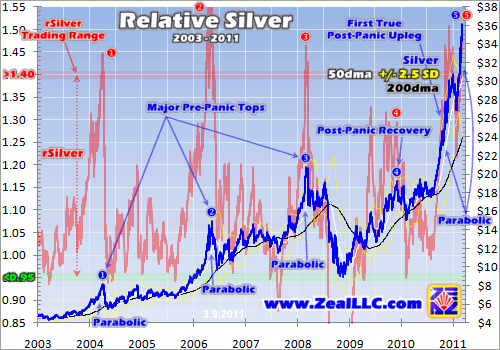
If someone is attempting to convince you silver is going to shoot higher without interruption indefinitely, this chart ought to be very sobering. Silver is no safe haven, no magical investment. It is one of the most-volatile and risky commodities in existence. Yes it can rally very fast, which is a lot of fun. But after its mightiest uplegs it literally plummets and eviscerates the gullible who bought in near the latest topping.
The horrific stock panic of late 2008 was the epic discontinuity of a lifetime, so it is best to consider silver in pre-panic and post-panic terms. During the pre-panic years of this secular bull, silver enjoyed three enormous uplegs that rocketed up to near-parabolic climaxes. Then silver was ripped to shreds in the stock panic, traders rushed to abandon this hyper-speculative metal. Then it recovered after the panic with everything else, and its first true post-panic upleg began last summer.
There are definite technical (price-action) characteristics of past major toppings that silver shares today. The most-obvious one is silver’s near-parabolic vertical ascent. Note that the major pre-panic uplegs accelerated the same way, rocketing skywards in a final manic gasp before collapsing under their own psychological weight. These near-parabolic terminal ascents can be measured and compared.
In every market including silver, when prices surge too far too fast they simply need to correct. This is a psychological phenomenon, supply-demand fundamentals are completely irrelevant. Any price rising too far too fast generates tremendous greed. This unbalanced sentiment sucks in all traders interested in buying in anytime soon. Once all these buyers have bought, only sellers remain. And then some minor catalyst ignites initial selling pressure which quickly snowballs, resulting in a full-blown correction.
But how can we measure this amorphous concept of “too far too fast”? Many years ago I developed a simple trading system that quantifies it. Some kind of objective baseline was needed from which to measure the rapidity of advances, and the perfect one happened to be any price’s 200-day moving average. 200dmas are not static, they gradually rise to reflect an ongoing bull market. Yet they still move slowly enough to filter out all the day-to-day volatility, which can get pretty extreme in silver’s case.
My Relativity trading system considers prices as multiples of their 200dmas. Over time, any price in a bull-market trend tends to carve a horizontal trading range relative to its 200dma. This is readily evident in silver above. If you take the blue silver price and divide it by its black 200dma line, the light red Relative Silver (rSilver) line is the result. Since 2003, silver has tended to trade between 0.95x its 200dma on the low side to 1.40x its 200dma on the high side. This relative trading range defines “too far too fast”.
The best time to buy silver is when it is low, near its 200dma. Thanks to this very tool, back in mid-August when silver was near $18 I wrote an essay claiming a big autumn silver rally was coming. I encourage you to read it, as most analysts were very bearish on silver last summer as it made its usual seasonal lows. But our subscribers were ready in advance for this latest mighty silver upleg.
The best time to sell silver is when it is high, stretched far above its 200dma. Historically in this secular bull, once silver ran 40%+ above its 200dma it was pushing unsustainable advances. How do I know? Check out the chart. Silver soon collapsed each time after exceeding this metric, it had simply rallied too far too fast. And where is rSilver today? This week it hit a breathtaking 1.513x, which is crazy-high. Enthusiastic traders have bid silver over 50% above its 200dma! These levels are unsustainably extreme.
So in technical terms, silver’s recent price action looks very much like past major toppings. Silver has shot vertical in a near-parabolic spike. And it has rallied so far so fast that it has far exceeded its bull-to-date danger zone of 1.40x its 200dma. What happened in the past after these very conditions? The chart doesn’t lie, silver plummeted like a rock. And if you are a newer silver player, you can’t imagine how brutal these post-topping corrections were. They literally ruined countless traders not prepared for them.
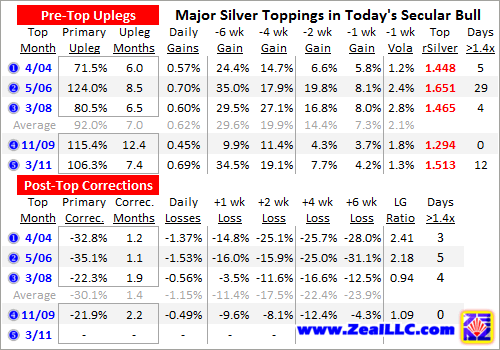
This table summarizes some of the price action surrounding these major past toppings. The topping numbers below correspond with the ones in the chart above. While silver’s post-panic recovery in 2009 was very different from a true silver upleg, I threw in its topping for good measure. This table looks intimidating at first, but it is simple and easy to understand. Heeding its hard lessons could save you from massive losses in your silver-related trading positions.
The most-important toppings to consider are the first three of this bull, April 2004, May 2006, and March 2008. They were normal silver bull-market advances to new bull highs. The fourth one was a recovery from an abnormal and overdone stock-panic selloff, so its technicals are atypical. In addition, that fourth upleg didn’t carry silver to new bull highs like all the other ones. Let’s walk through those early uplegs.
Over an upleg duration averaging 7 months, silver shot 92% higher on average in its massive pre-panic uplegs. So a doubling in silver over such a short period of time is actually par for the course. Many traders are surprised to learn that silver’s entire bull-market gains are won in a handful of relatively-short periods of time. For the vast majority of its bull, silver wasn’t very exciting at all. This curious metal drifts listlessly for a long time, then awakens to surge.
The average daily gains over the entire spans of these uplegs was 0.62%. In the final 6 weeks before these toppings, silver surged almost 30% on average. In the terminal 4 weeks, it rallied nearly 20%. In the final 2 weeks, it blasted over 14% higher. And in its final week before its upleg-ending topping, silver averaged big gains exceeding 7%. The average daily volatility ran 2.1% over this final week. Relative Silver peaked above 1.40x, and exceeded this danger zone for a varying number of days.
These numbers are hard data, not opinion or theory. So it is fascinating to compare what silver has done in its current upleg with what it averaged in its massive pre-panic ones. As of this week, silver has rocketed over 106% higher in just over 7 months! This is a considerably-greater gain than its past uplegs’ average of 92%, over about the same period of time. Distilled into a daily average, this silver upleg’s 0.69% gains were among the biggest ever seen in this bull.
Over the 6 weeks before silver’s latest high this week, it shot up nearly 35%! This is a near-parabolic ascent that almost equals the biggest one yet seen ahead of the May 2006 top. Provocatively, back then silver sentiment and exuberance were as bullish as we’re seeing today. Over the past 4 weeks before its latest high, silver shot up over 19% which is close to the 20% average. So at least over terminal 6-week and 4-week spans, silver’s latest ascent certainly matches past unsustainability thresholds.
Because silver has failed to rally much over the past week or so, its final 2-week and 1-week gains aren’t as extreme as past averages. We are talking almost 8% versus over 14% on the 2-week metric, and just over 4% compared to over 7% on the final-week one. This lackluster action has also dragged down our current upleg’s latest volatility read, but silver has been really volatile in recent weeks as traders well know.
And in rSilver terms, today’s upleg is the most extreme since the massive one topping in May 2006. Silver trading at 1.513x its 200dma earlier this week was the highest seen since that month! Silver has also enjoyed more days above 1.4x recently than at every other major top since that one as well. So when we look at measures of the magnitude and late speed of silver’s current upleg, they track very well with what we’ve seen at past major toppings. And that May 2006 topping is the closest match by far.
What happened after that one? Silver plummeted so fast that many traders called it a crash. It was brutal beyond belief. If you weren’t trading silver or silver stocks back then, it is hard to even communicate how ugly it was and how many traders were wiped out. Silver plunged over 35% in just over a month, a mind-blowing selloff. And lest you think that’s extreme, it really isn’t for silver. Its average post-top correction ran about 30% over a span of less than a month and a half. Yes, under 6 weeks!
A 30% to 35% loss sounds academic to some, so consider it in absolute terms. If silver indeed topped earlier this week, falling by a third would hammer it back down to $24 within a couple months on the very outside! Though this degree of correction would be totally normal and expected, and wouldn’t even come close to jeopardizing silver’s secular bull, the damage $24 would do to silver psychology and silver-stock levels would be catastrophic. Silver stocks usually leverage silver selloffs, amplifying its losses!
On average these pre-panic corrections saw daily losses approaching 1.2%. By the first week after their tops they had fallen over 11%, nearly 18% by the second, over 22% by the fourth, and almost 24% by the sixth. When silver falls 10% a week for a couple weeks, it scares silver speculators to death. They rush to abandon their recent love with blinding speed. And selling begets ever-more selling, as prices spiral lower more and more traders capitulate.
And today we are in a unique situation that makes this potential silver topping even riskier than most. Believe it or not, a major driver of silver’s fortunes is the state of the general stock markets! As such a hyper-risky commodity, silver is heavily buffeted by the sentiment winds emanating from the stock markets. When general stocks enter a correction, silver tends to fall with stocks unless gold is exceptionally strong. And even then silver drifts sideways, torn between following gold (its normal driver) and stocks. As I’ve warned in recent weeks, the US stock markets are due for a major correction today.
The sentiment splash damage from this alone will hammer silver lower, but now stock-market traders have direct access to silver via the popular SLV silver ETF. This vehicle is a direct conduit between the vast pools of stock-market capital and physical silver bullion. As stock traders get scared by the stock selloff, they will likely sell all their risky trades including SLV. If they dump SLV at a faster rate than silver is being sold in the futures markets, this ETF’s custodians will be forced to sell silver bullion (intensifying the silver selloff).
Differential selling pressure forces physical ETFs to sell their underlying assets to raise enough cash to buy back the excessive shares offered for sale. If they don’t do this, the ETF will decouple from its underlying to the downside and fail in its tracking mission. SLV didn’t even exist at the April 2004 topping, was just 2 weeks old at the May 2006 one, and wasn’t super-popular yet by the March 2008 one. So today’s topping may very well be the first one where stock-market selling directly hammers silver prices.
While silver’s secular bull still has awesome potential in the coming years, today silver is very overbought and looks to be topping. It needs to correct to rebalance sentiment, to eradicate the excessive greed and irrational exuberance today. And silver corrections tend to be unbelievably brutal, they are hard and fast and take no prisoners. When most silver enthusiasts hear this message, they get depressed.
But corrections are actually very exciting and bullish! Our goal as investors and speculators is to buy low and sell high, right? The best times to buy low, whether we are talking physical silver coins or great silver stocks, is just as one of these massive corrections matures. Would you rather add new silver investments at $36 or $24? Would you rather buy silver stocks at recent highs or 35% to 50% lower? Corrections are the best buying opportunities ever seen within ongoing secular bulls, they are a great blessing.
At Zeal we are locked and loaded and ready as always. After realizing our large gains on several-dozen commodities-stock positions in this upleg, we are mostly in cash. The resulting bargains after the general stock markets, commodities (including silver), and commodities stocks correct should be awesome. When the time to buy arrives, I will explain why and exactly what we are buying in our acclaimed weekly and monthly newsletters. Our trading track record since 2001 is stellar, 583 stock trades with average annualized realized gains of +52%! Subscribe today and start thriving in these markets.
If you are into silver stocks, times like these when the odds heavily favor a major correction are perfect to craft your shopping list. If silver stocks are soon at fire-sale prices, you need to know which ones you want to buy before the time to pull the trigger arrives. A few months ago we published our latest comprehensive fundamental report on our favorite silver stocks. We researched the entire universe of publicly-traded silver stocks in the US and Canada, and wrote fascinating profiles on our dozen favorites in a 34-page report. This is now available for just $75 ($55 for subscribers). Buy yours today.
The bottom line is silver looks to be topping based on bull-to-date precedent. The odds are very high that silver is in store for another one of its brutal and unforgiving corrections. These are dangerous events not to be trifled with, as silver tends to plummet by nearly a third in less than 6 weeks! Silver stocks usually amplify these losses. Traders caught unaware by a major silver correction are ripped to shreds.
Nevertheless, these are very healthy and necessary events. They rebalance away hyper-bullish and greedy sentiment, resetting the stage so silver’s secular bull can continue powering higher. And corrections yield the best buying opportunities ever seen within ongoing bulls. So investors and speculators looking to add silver-related positions have a rare and valuable opportunity to buy low.
Adam Hamilton, CPA March 11, 2011 Subscribe |
|||||||
|
|
|
|
|
|
|
|
|
|
|
|
|
|
|
|||