|
|
|||||||
|
|
|
|
|
|
|
|
|
|
HUI Upleg Structure Adam Hamilton February 22, 2008 2777 Words
Despite very difficult prevailing stock-market conditions, the HUI unhedged gold-stock index has soared 55% since mid-August! You’d think gold-stock traders would be thrilled with such awesome gains. Instead they are very disappointed, because gold itself is up 45% over this same period of time and the HUI hasn’t adequately leveraged its gains.
To delve into this vexing conundrum, a couple weeks ago I updated my research on HUI leverage to gold. It showed that leverage varies wildly over the course of uplegs, so it is pointless to worry about mid-upleg. Like the weather, it will soon change. As I was doing this leverage research, some fascinating peripheral insights into the technical structure of HUI uplegs became apparent.
Over its entire 1237% bull market since November 2000, the HUI has completed seven major uplegs and seven major corrections. I’ve studied these segments in depth over the years. Analyzing their gains, durations, rhythms, and leverage offers priceless probabilities knowledge to help maximize our odds of realizing big profits in today’s and future gold-stock trades.
The HUI’s seven major uplegs of this bull have coalesced into a very distinctive alternating pattern. First massive uplegs drive the HUI to dizzying new heights, catapulting it over 100% higher in less than a year. Then smaller consolidation uplegs follow, giving traders time to get comfortable with the new higher prevailing gold-stock levels. I recently discussed this critical pattern in depth.
The 2nd, 4th, and 6th major HUI uplegs of this bull market were massive, averaging stellar 136% gains over just 9 months each! The 3rd, 5th, and 7th were consolidation uplegs, averaging much more modest 47% gains over about 9 months each. Since the 7th upleg which ended last July was a consolidation upleg, today’s 8th upleg which started in mid-August is almost certainly going to prove massive.
Looking back at this bull’s past massive uplegs, traders goggle at their incredible 145%, 125%, and 137% absolute gains. Although fantastically profitable for us as we rode each one, hindsight tends to dull their myriad of real-time challenges. None of these massive uplegs offered a smooth ride, and they tried relentlessly to shatter traders’ confidence and shake them out before the uplegs matured.
Now today in the midst of the HUI’s 8th major upleg, traders are yet again grumbling and scared. Many have given up on gold stocks, losing the psychological battle against this wily upleg. This is very unfortunate, as people who lose faith too soon always miss the best gains an upleg has to offer. I don’t think traders would defect so easily if they understood HUI upleg structure.
While no two massive HUI uplegs are identical, they share many similar internal technical traits. But these symmetries are not readily apparent at first glance. Past massive HUI uplegs occurred at very different prevailing HUI levels and ran for different durations, leaving them difficult to directly compare. Yet if they can be rendered in comparable terms, they offer a wealth of insights critical for today’s gold-stock traders.
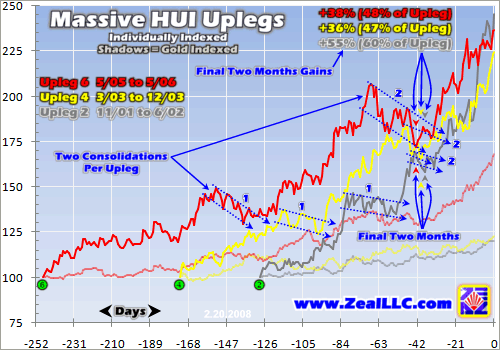
In order to compare the HUI’s massive uplegs 2, 4, and 6 with each other and today’s upleg 8, I indexed each one individually. They all start at 100 and rise accordingly, so at 150 for example each is up 50% from its own starting point. Indexing neutralizes the disparate HUI levels prevailing during each upleg to make their gains, losses, and internal technical structures perfectly comparable with each other.
Even indexed though, these uplegs still had different durations. You can’t render them on a common time scale without adding fake data to shorter uplegs, deleting real data from longer ones, or interpolating middle ground to force a common fictional duration. These data-manipulation approaches are all unacceptable. Thus to maintain pure data integrity, I simply lined up each massive upleg’s ending points.
In addition to indexing the HUI individually for each of its massive uplegs, I also indexed gold over each HUI upleg. It is rendered as the lighter shadowy line trailing each bold HUI line. The HUI’s behavior relative to gold is exceptionally relevant today since leverage is such an intense prevailing concern.
The horizontal axis in these charts is measured in trading days. 21-day increments are used since this is the average number of trading days in a calendar month. Thus each background grid box is essentially one month in duration. I suspect this unique analytical perspective will radically change the way you look at today’s much-maligned HUI upleg.
Gold-stock traders’ fondly idyllic reminiscences about massive uplegs 2, 4, and 6 are incredibly tinted by rose-colored glasses. Just like today’s upleg, these past massive HUI uplegs were very challenging to trade in real-time. Yes their ultimate gains were enormous, but these gains weren’t achieved in a nice linear fashion. They were won in fits and starts which trampled the faith of all but the most stalwart.
Massive uplegs are anything but clean easy runs. Their internal technical structures are a chaotic combination of sharp rallies, sideways drifting, and even downward-trending consolidations. The average trader gets really excited during the sharp rallies, but quickly loses faith during the drifting and consolidations. Traders need to learn to expect mid-upleg weakness even within the biggest uplegs.
Each of these massive uplegs rendered above had two serious consolidations. These consolidations dragged the HUI lower for periods of time long enough to be very psychologically damaging to naïve bulls. They typically lasted about a month each, but could drag on for six weeks at worst. Four to six weeks of downward-drifting gold-stock prices despite a strong gold price really tests traders’ resolve.
These mid-upleg consolidations are necessary and healthy because they bleed off excessively bullish sentiment generated from the sharp moves higher that precede them. The biggest threat to any young upleg is too much greed too soon. These consolidations are a safety valve to prevent popular greed from growing too extreme before an upleg nears maturity. They offer the best mid-upleg buying opportunities.
Another crucial structural attribute of massive HUI uplegs is readily evident in their final two months before topping. About two months ahead of their dazzling apexes, each upleg carved an interim low which I marked above. Then in those final two months following these lows, each upleg rocketed to fantastic terminal gains. Being long and strong heading into an upleg’s final two months is crucial to maximize trading gains.
Massive HUI uplegs 2, 4, and 6 respectively gained an absolute 55%, 36%, and 38% over their final two months alone! This final-two-month surge represented 60%, 47%, and 48% of each upleg’s entire gains! Thus on average over half of each massive HUI upleg’s entire gains occurred in just its final two months!
Traders shaken out by the pair of serious mid-upleg consolidations prior to these incredible terminal gains miss the majority of each massive upleg. Thus I can’t emphasize enough how important it is to ride these massive uplegs to maturity. You’ll know maturity is nearing when the HUI rockets vertically in a matter of weeks and everyone and their dog is ridiculously bullish on gold stocks. Euphoria is impossible to miss.
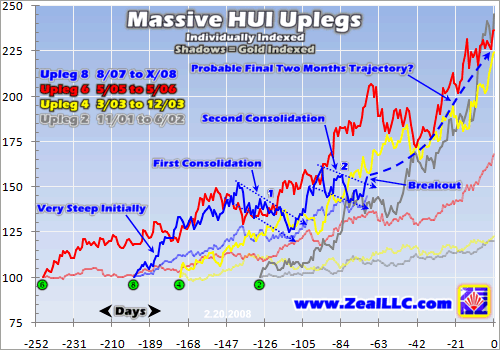
With this superior understanding of past massive HUI uplegs’ general structure, today’s likely-massive HUI upleg 8 will make a lot more sense. On this next chart I added the HUI’s indexed performance since the mid-August low, its 8th major upleg. But since today’s upleg hasn’t yet ended, I ran its chart out to May. Why May?
Provocatively mid-May to early June is the highest-probability topping point for major uplegs in this HUI bull by far, with three of seven topping then. Also, if today’s upleg 8 runs for the average massive upleg duration of 9 months, then it ought to top right around 9 months from its mid-August birth, which is mid-May. There are a variety of research threads pointing to a probable May apex for today’s HUI upleg.
Assuming today’s 8th major HUI upleg indeed proves to be massive, and assuming it tops sometime between now and late May, it really looks pretty normal in technical terms compared to its predecessors. It had a sharp initial rise and has weathered two serious consolidations that have really shaken the faith of many gold-stock traders.
The HUI’s first mid-upleg consolidation started off its early November high, when it began grinding lower into mid-December. This nasty consolidation nearly dragged the HUI back down to its 200-day moving average, which really spooked a lot of traders. This retreat, combined with the fact that gold remained strong, severely damaged the confidence of gold-stock traders. Many capitulated near the mid-December low.
But just then when fears were rivaling those witnessed during mid-August’s major interim low, the HUI surged higher heading into January. This restored confidence for a season. But by mid-January the HUI once again started drifting lower in its second serious consolidation of this upleg. This one was so hard psychologically that I had some long-time gold-stock traders tell me they’ve never felt worse in this entire bull!
But as this comparable graphical perspective on massive HUI uplegs reveals, serious consolidations running four-to-six weeks are merely par for the course. We should expect two within each massive HUI upleg. Gold-stock traders who have somehow come to expect that the HUI must rise continuously or follow gold perfectly day in and day out will be sorely disappointed. Massive uplegs deftly shake out weak hands with their chaotic structure.
Since most traders tend to succumb to the tyranny of the short term, these consolidations are really frightening. Their technicals tend to form full-blown downtrends over their duration, complete with lower highs and lower lows. So the HUI can really start to look scary technically late in one of these serious consolidations. Yet if traders took the long view instead, they’d still see higher highs and higher lows over multi-month time horizons.
Provocatively if today’s HUI upleg tops by late May in line with the probabilities, we are nearing its final two months. The dotted-blue line above shows a stylized view of the HUI’s probable trajectory during the time between now and May. If this massive upleg follows precedent we ought to see slightly more than half of its total gains between now and May! The terminal ascents in massive HUI uplegs are simply awesome.
The past three massive uplegs averaged 136% gains, or 236 indexed at their tops. If today’s HUI upleg proves merely average, a 136% gain since its mid-August birth would take us above 700! Lest you think this 700ish HUI target is new and situational, I was already writing about it back in September when this upleg wasn’t even yet one month old. Later HUI/Gold Ratio analysis confirmed it from a different angle.
For a variety of reasons though, I doubt this upleg will prove merely average. Look at the shadowed-blue indexed gold line above. Gold is now enjoying its best upleg of its own bull. The higher gold gets, the more interest it drives in gold-stock investing and speculating. Gold is getting so impressive that it is starting to attract massive pools of mainstream capital to consider gaming the tiny gold-stock sector.
Also, the HUI has largely lingered in fear since the summer of 2006. Sentiment is so unbelievably negative in gold stocks, and it has been so long since they’ve experienced popular greed, that their blow-off terminal surge this time around should be gargantuan. The markets abhor excessive fear and few sectors are more overdue for an episode of extreme greed than the long-loathed gold stocks.
Thus today’s HUI upleg 8 could easily prove to be this index’s biggest massive upleg yet before it fully runs its course. We are witnessing some of the most bullish gold-stock and silver-stock conditions today that I have ever seen. Thus at Zeal we are aggressively adding trading positions in our newsletters in anticipation. If history proves a valid guide, the coming months in the HUI should be nothing short of legendary.
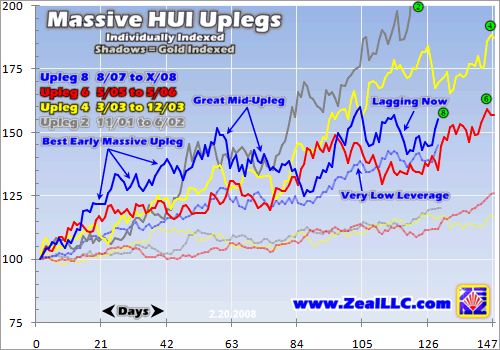
I made one final chart using these indexed massive uplegs. This time instead of lining up their apexes, I lined up their starting points. This common-starting-point approach really startled me. Today’s widespread perception that this upleg is pathetic and horrible compared to past massive uplegs couldn’t be more wrong. Believe it or not, today’s HUI upleg 8 exhibited the best early massive-upleg performance by far!
For most of its first four months of existence starting off the mid-August low, today’s upleg performed much better than any previous massive upleg. Considered in trading days since launch, upleg 8’s gains came in faster and bigger than anything yet seen in this bull. This is pretty amazing considering how widely reviled upleg 8’s performance seems to be today.
Interestingly all previous massive uplegs also witnessed their first serious consolidation right around their third month in, just like we witnessed in early November. Around trading day 63, the three-month mark, every indexed massive HUI upleg line rendered above is grinding lower. This makes the November-December consolidation suffered in today’s upleg seem positively normal.
This upleg’s second January-February consolidation we just weathered also corresponds nicely with a similar consolidation at this stage in massive upleg 6. That, of course, was the fondly-remembered HUI surge that ended in May 2006. It was back then at the top of upleg 6 when greed last waxed extreme in gold stocks. For almost its entire lifespan, our current upleg’s gains have been superior to upleg 6’s.
So today’s perceptions that something is dreadfully wrong with the HUI are largely misplaced. In perfectly comparable indexed terms, it is as good as (and superior to in some ways) previous massive uplegs to this point. Even today when the HUI is perceived as lagging, it remains right between the tracks of uplegs 4 and 6. We are well behind upleg 2 today, but that fastest massive upleg of this bull had already gone terminal by this point. It was something of an anomaly.
Structurally the HUI looks just fine today despite all the fears plaguing it. Traders should be excited that this upleg’s internals match what past massive uplegs have exhibited to this point. While I’ve long expected this upleg to be massive since the last upleg was not, this internal technical structural perspective really buttresses the massive case.
It is true the HUI hasn’t yet leveraged gold significantly in this upleg. This is evident in the narrow spread in this chart between the bold-blue HUI-indexed line and the shadowed-blue gold-indexed line. I don’t expect this underperformance to persist though. HUI outperformance of gold is highly cyclical and we are overdue to see another episode soon per HUI/Gold Ratio analysis.
And if you compare all the shadowed lines above to see gold’s indexed performance in these massive HUI uplegs, it is readily evident that gold is now dwarfing anything that came before. If gold is this strong, I almost can’t imagine how big the HUI surge will be when it suddenly decides to catch up, leverage gold, and account for gold’s new prevailing levels. No other massive upleg has had such a strong gold base.
I’ve actively traded this gold-stock bull since its birth in late 2000 and I can’t recall a more bullish setup for gold stocks. Probabilities really favor the next few months being amazingly profitable for this long-neglected sector. As such, we’ve been aggressively adding elite high-potential gold-stock and silver-stock trading positions in our acclaimed weekly and monthly newsletters.
In the 87 months this gold-stock bull has powered higher, only 6 have witnessed the hyper-profitable final two months of massive uplegs. These terminal ascents are pretty rare. But odds are we are in for 2 more of these months soon. If you want to ride them, subscribe today and deploy your capital before it is too late. If precedent prevails, our subscribers mirroring our newsletter trades should earn fortunes.
The bottom line is massive HUI uplegs have many internal technical similarities. This common structure includes two serious mid-upleg consolidations and a sharp surge in each upleg’s final two months that accounts for about half of its overall gains. By understanding HUI upleg structure, you can avoid being shaken out by the consolidations and make sure you are fully deployed for the exciting climax.
Today’s 8th major upleg is really exciting because its technical structure to this point matches past massive uplegs very well. Thus it will almost certainly prove to be massive too. And if this is the case, we ought to see at least as big of advance heading into May as we’ve already witnessed since August. But given gold’s extraordinary strength, the coming gains as the HUI starts reflecting it could be much larger.
Adam Hamilton, CPA February 22, 2008 Subscribe |
|||||||
|
|
|
|
|
|
|
|
|
|
|
|
|
|
|
|||


