|
|
|||||||
|
|
|
|
|
|
|
|
|
|
HUI Leverage to Gold 4 Adam Hamilton February 8, 2008 3115 Words
As a stock-market sector, gold stocks are obscure, increasingly volatile, and seemingly perpetually unloved. Yet investors and speculators choose to own them anyway. Why? Because in the past gold stocks have greatly amplified goldís underlying gains. Traders are betting this outperforming behavior will continue in the future.
The outperformance so far in this bull market has been enormous. At best in recent weeks, the flagship HUI unhedged gold-stock index was up 1237% since its bull was born in November 2000. This incredible run was driven by a 262% gain in gold since its own bull launched in April 2001. Thus bull to date per simple math, the HUI has leveraged goldís underlying gains by 4.7x!
This awesome leverage has helped early gold-stock investors and speculators earn fortunes in this bull. Weíve been actively trading gold stocks since its birth, so our subscribers have reaped massive rewards. Yet despite this very profitable history, I wouldnít hesitate to exit this sector in a heartbeat if I thought gold stocks no longer leveraged gold.
Gold mining is a very risky business, riddled with inherent perils including gold-price risk, geological risks, operational risks, and geopolitical risks. Gold itself, on the other hand, only has price risk. So gold stocks have to amplify goldís gains to compensate for their far greater risks. If they fail to leverage gold, there is simply no reason to own them. Traders would be far better off owning gold alone in such a scenario.
This explains why gold-stock traders are growing uneasy today. Since the mid-August 2007 lows, at best gold is up 42.6% while the HUI is up 60.3%. This yields HUI leverage to gold of just 1.4x so far in this upleg. This is indeed disturbingly low. Are gold stocks dead? Are we better off saying to heck with them and trading gold alone?
After meticulously studying HUI leverage to gold and listening to traders complain about it for many years now, Iím convinced this concept is woefully misunderstood. HUI leverage to gold is very real and powerful, and has generated vast profits for gold-stock traders. Yet it unfolds gradually in its own good time, defying trader attempts to shoehorn it into some artificially short time frame.
It is amusing to watch naÔve traders try to force this long secular phenomenon into a tiny intraday space. They will see gold up on some particular day, say 1%, so they will expect a perfectly parallel 4% to 5% gain in the HUI. If the HUI doesnít cooperate immediately, they wither in fear and run around like Chicken Littles proclaiming the sky is falling and gold stocks are dead.
But as these charts reveal, HUI leverage to gold is not an ironclad minute-by-minute rule we can expect day in and day out like clockwork. Instead it is an overarching secular theme that gradually flows and ebbs over months and years. Like many gradual secular tendencies in the markets, traders can easily miss it if they get so lost in the daily trees that they miss the far more important secular forest.
There are different approaches to analyzing HUI leverage to gold, including looking at the HUI/Gold Ratio. But a more direct method is to study the raw leverage itself over time frames particularly meaningful to traders. As a long-time gold-stock trader myself, no time frames are more important to me than major HUI uplegs and corrections. Traders long these uplegs and short or neutral on these corrections can earn vast profits.
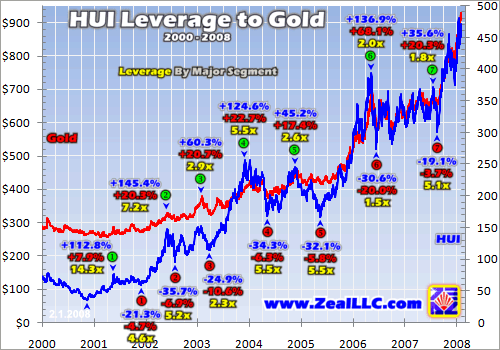
Here the bull-to-date HUI (blue) is superimposed over the gold bull (red). So far in their bull, gold stocks have completed seven major uplegs and seven major corrections (collectively ďsegmentsĒ). Over each segment, which are defined by major interim HUI highs and lows, the actual gains or losses in both the HUI and gold are noted. Dividing these results yields the yellow numbers, segment leverage.
For example, back in 2003 the HUI surged 125% higher in the 4th major upleg of its bull. Over that same period of time to the day, gold rose 23%. This yields HUI leverage to gold in upleg 4 of 5.5x. Realize that these segment-leverage comparisons are HUI-optimized. We are concerned about the HUIís leverage to gold here, not goldís nonexistent leverage to the HUI.
Major interim gold extremes occur near the HUIís but not always on the same day. They are generally pretty close temporally though, with gold usually topping or bottoming within a week or so of the HUI. Thus the gains/losses in this chart tied to specific HUI segments are precise, but goldís arenít necessarily since they are reckoned within the HUI segmentsí time frames regardless of actual gold tops/bottoms.
This chart yields all kinds of interesting insights. Starting with the uplegs, note that the HUIís leverage to gold is trending lower as this bull matures. Major upleg 2 ending in June 2002 witnessed incredible 7.2x leverage while upleg 6 ending in May 2006 only managed 2.0x. Although individual uplegs vary considerably, there is definitely a general compression trend in HUI leverage to gold.
A couple major factors are contributing to this. First, as the HUI climbs higher and its component companies grow larger, it takes a lot more capital to drive similar gains. Doubling the HUI from 36 to 72 off its secular bear low of late 2000 was much easier to accomplish than doubling it again from 300 in mid-August 2007 to 600 in the coming months. Bigger companies have more inertia and are slower to move.
Second, the uplegs in gold itself are getting a lot bigger in Stage Two. The HUIís 6th major upleg that ended in May 2006 rocketed 137% higher, the second biggest upleg of this bull. Yet because gold simultaneously gained 68% in its first mighty Stage Two upleg, the HUIís segment leverage plunged to 2.0x. Did this make gold stocks a bad trade? Heck no! No trader in his right mind would pass up a 137% sector gain in one year.
Bigger, and hence slower-moving, gold miners combined with much larger gold uplegs are gradually compressing HUI leverage as these bulls mature. I donít think this is a problem as long as the HUIís absolute upleg gains remain large and it still amplifies goldís gains. Personally I believe the gold stocks are worth their risks as long as leverage remains above 1.5x across entire major gold uplegs.
While amplifying goldís gains by over 1.5x sounds acceptable to me, it may not to you. Each trader, based on his own individual assessment of the relative risks of gold stocks versus the risks of gold itself, has to make this judgment call. But a good decision on this front cannot be made until you have a solid strategic understanding of how HUI leverage to gold has evolved in this bull.
Provocatively the HUIís major downlegs really havenít witnessed this leverage-compression trend, with 5.0x-ish levels remaining pretty consistent. Nothing frightens gold-stock traders into selling like a falling gold price. This increasingly asymmetric downside risk is one of the reasons why it is so important to game the HUIís upleg and correction rhythms. Corrections must be avoided or shorted to maximize overall gains.
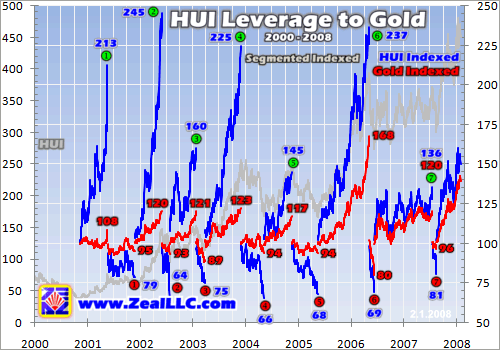
One problem with any long-term chart is early percentage gains are no longer comparable visually. For example, today young upleg 8ís 60% gain since mid-August looks way bigger visually than upleg 1ís far-larger 113% gain in early 2001. So in order to eliminate this distortion, I individually indexed each segment in this next chart. Each major upleg or correction starts at 100 and runs from there.
When these segments are individually indexed, percentage gains and losses become perfectly comparable over time. While HUI upleg leverage is compressing, absolute HUI gains in its massive uplegs are not. Goldís underlying gains in Stage Two are much larger as upleg 6 shows, but this doesnít negate the enormous absolute upleg profits in the HUI.
This is a complex chart built from a complex spreadsheet, so it is not without peculiarities. The raw HUI (gray) is rendered in the background to help place major segments. The same individual HUI (and gold) segments shown in the first chart are indexed and slaved to the right axis here. While it appears some segments donít start at 100 graphically due to charting artifacts, they all do mathematically. The underlying analysis is sound.
HUI leverage to gold is apparent here in any given segment as the relative difference in performance between the blue HUI line and the red gold line. In every case the HUI amplified goldís underlying gains and losses, but to varying degrees. While it is tricky to see at this long time scale, it is very important to note the difference in slopes of the gains in HUI uplegs versus the underlying gold gains.
Generally during major HUI uplegs, the underlying gold uplegs gradually move higher in a linear fashion. In other words, gold tends to meander higher consistently within a fairly tight uptrend. Since the worldís aboveground gold supplies are worth at least 25x the market capitalization of all the worldís gold stocks combined, gold is simply a bigger and slower market. Its gains are usually pretty even across an upleg.
Contrast this with the HUI. The gains in its major uplegs, while often very large, were not linear. They are often closer to parabolic, with a large proportion of an uplegís total gains accruing quickly near its very end. Of course with parabola-like slopes, the gains in the middle of a HUI upleg must slow down considerably to leave room for the big spikes in the end. This harmless behavior causes much angst since it isnít well understood. Gold keeps climbing mid-upleg, but the HUI seems to fall behind irritating traders to no end.
If youíve read one of my essays on HUI upleg rhythms, you recall that this index tends to alternate between massive and consolidation uplegs. Massive uplegs, such as 2, 4, and 6 above, drive the HUI to major new bull highs and witness gains exceeding 100% in less than a year. But after massive uplegs, smaller consolidation uplegs are necessary for traders to get comfortable with the new high prevailing gold-stock levels. Uplegs 3, 5, and 7 above, which are much smaller, are consolidation uplegs.
Since our latest completed upleg, the HUIís 7th, was a consolidation upleg that ended in July 2007, odds are todayís young upleg 8 will prove to be massive. Indeed it has already easily driven the HUI to new bull highs. Since todayís upleg is probably massive, we can get a better idea of what to expect in leverage terms by studying the HUIís leverage to gold in its previous massive uplegs.
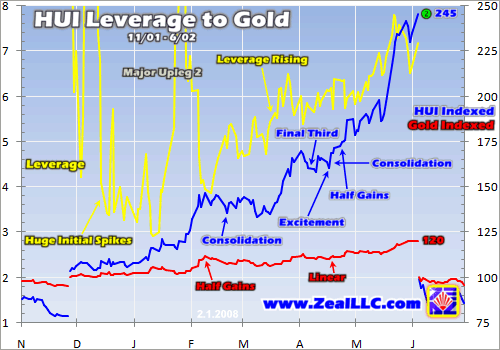
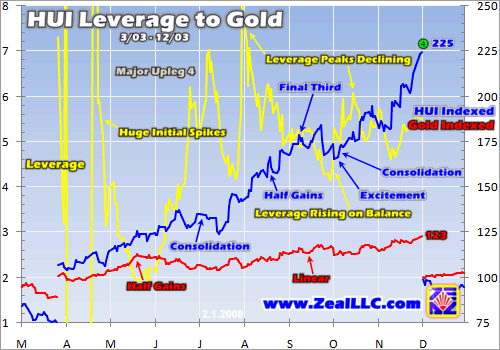
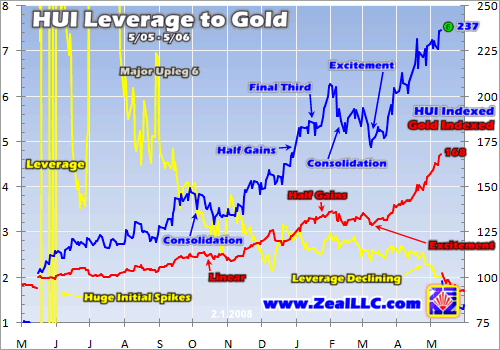
Thus these next three charts zoom in on the indexed renderings above of massive uplegs 2, 4, and 6. When you individually expand these uplegs to fill a whole chart horizontally, the differences in how HUI and gold performances evolve within an upleg are much easier to see. The actual upleg-to-date daily HUI leverage to gold is also rendered in yellow. Its trends are much more chaotic than most traders realize.
Youíll see some common themes emerge in these indexed charts of major HUI uplegs 2, 4, and 6. Generally linear gold gains combined with generally parabolic HUI gains yield wildly swinging leverage readings throughout the life of an upleg. With such high volatility, dwelling too much on upleg-to-date leverage on any particular day is probably useless. All that matters is the uplegsí ultimate gains and leverage.
In the HUIís 2nd major upleg ending in June 2002, there was a huge initial leverage spike. This is common in virtually all uplegs. Major uplegs are born in times of despair, when gold stocks are beaten down and only the hardcore contrarians will even consider buying them. When gold starts climbing in such an environment, it doesnít take much gold-stock bidding to drive an initial sharp spike in the HUI.
But after this initial excitement, HUI leverage plunges. Old bearish theories popular during the preceding consolidation create a wall of worries and enthusiasm wanes. Meanwhile gold continues higher in its linear fashion which moderates the HUI leverage to gold. Then about a third of the way into a major HUI upleg, a gold surge typically ignites a sharp HUI rally. This drives HUI leverage back up again.
After this second surge, a consolidation often ensues leading into the uplegís halfway point. Very few traders believe a HUI upleg is the real deal in its first half, so they sell on the second HUI surge and gold-stock prices drift sideways. But meanwhile gold continues rising on balance, grinding HUI leverage lower. This is a very tough time psychologically for most traders, as the temptation to sell is often too great to resist.
After this first consolidation, the upleg passes its halfway point and buying resumes. The HUI surges again heading towards its second half. This generally drives leverage higher again, as the HUI is usually able to climb faster than gold. But after this another consolidation looms, the HUI trades sideways for weeks to shake out the weak hands before buying interest can once again drive it higher.
After its second mid-upleg consolidation, the HUI surges into its final third. Often about half of an entire massive uplegís gains are realized around its final third! Traders who can fight their emotions and hold on this long are richly rewarded in riding the HUIís parabolic ascent to its uplegís peak. Leverage generally, but not always, rises in this final third as the HUIís gains easily outpace goldís.
This general pattern of HUI performance, gold performance, and the resulting leverage swings becomes more clear as you consider all three of these charts. At some times in uplegs the leverage is high, at other times it is low. The HUIís leverage achieved is certainly not linear, but occurs periodically in fast spurts. This is why it is so pointless to fret about the HUIís leverage to gold midstream in an upleg. It is like the weather, wait a week or two and it will probably change dramatically.
In addition to the wild leverage swings, it is really important to note that the HUIís gains are not linear. Their slope generally accelerates over time, in parabolic fashion. Also in any given massive upleg, you probably need to expect two consolidations running for a month or so each. Every time this happens, gold-stock traders freak out and assume the upleg is over. But as these charts show, mid-upleg consolidations are par for the course here.
Provocatively the big, fast gains that everyone remembers only come near an uplegís final third. No one seems to remember the initial two-thirds of past uplegs that were always challenging psychologically. It is only near the final third when excitement really catches hold, especially among individuals. The HUI tends to surge and within a matter of weeks virtually everyone is bullish so a major interim top draws nigh.
While half of a HUI uplegís entire gains often rapidly accrue near its final third, this disproportionate outperformance is even more pronounced for juniors. Due to their low volume and small market caps, juniors are generally not owned by professionals managing mutual and hedge funds. The amount of capital the funds need to put into positions would drive such big swings in juniorsí prices that the funds couldnít enter and exit without wrecking their own trades.
So it is individuals that drive surges in juniorsí stock prices, and these investors donít get excited until the final third of major HUI uplegs. Thus traders should not be surprised if juniorsí performances seem inadequate in the early or middle stages of a major upleg. As soon as individuals start to believe that upleg is real and sustainable, they will start flooding into small gold stocks and their prices will soar.
The last massive HUI upleg we witnessed was its 6th major one ending in May 2006. While the HUI itself had its usual upleg profile described above, goldís was quite different. In its first Stage Two upleg of this bull, gold went parabolic on excitement near the end of its upleg just like the HUI usually does. This drove down the HUI leverage to gold throughout this upleg. It ended up at just 2.0x!
While Iíd certainly prefer greater leverage given a choice, I donít have a problem with this. Upleg 6 witnessed the first Stage Two gold upleg weíve seen since the mid-1970s. Gold-stock traders, used to gold rallying 20% or so in its major Stage One uplegs, were not expecting the enormous 68% gains in upleg 6. Thinking too early that gold was too overbought, a lot of traders held back. So upleg 6ís final third wasnít as great as it could have been. Still though, 137% absolute gains in the HUI in one year are well worth it.
Now that we are definitively in Stage Two, traders expect bigger gold gains. They ought to be less skittish in the final third of this HUI upleg. So I expect we will see todayís upleg 8 ultimately exhibit leverage greater than upleg 6ís 2.0x now that Stage Two expectations are more reasonably aligned. Regardless of its final leverage tally, I have no doubts that the HUIís ongoing leverage to gold will vary wildly in this upleg.
At Zeal weíve been actively studying the HUIís leverage to gold for many years. Thus we donít get scared when it looks inadequate midway into an upleg. Today we are layering in high-potential gold-stock positions for the probable upcoming final third of this new massive upleg. With fully half of an uplegís total gains usually accruing around its final third, the profits to come should be excellent even from this point. Subscribe today to our acclaimed monthly newsletter and ride the best part of this upleg with us!
The bottom line is HUI leverage to gold is declining in a secular sense, but it is still excellent. As long as leverage remains high enough to compensate for the many added risks of owning gold stocks, then gaming the major HUI uplegs will remain very compelling for traders. And within any major upleg, the HUIís upleg-to-date leverage will vary wildly. It is pointless for traders to worry about leverage mid-upleg.
Also realize that until their exciting final thirds, all major uplegs are difficult to ride psychologically. They are full of significant consolidations and periods where goldís gains grow faster than the HUIís on a short-term basis which drives down leverage. As always though, the traders who can transcend all this daily noise and keep the strategic picture in focus reap the greatest rewards.
Adam Hamilton, CPA February 8, 2008 Subscribe |
|||||||
|
|
|
|
|
|
|
|
|
|
|
|
|
|
|
|||

