|
|
|||||||
|
|
|
|
|
|
|
|
|
|
|
|
|
|
|
|
|
|
|
Gold Bulls’ Three Stages Adam Hamilton September 3, 2004 3608 Words
As the unofficial end of summer storms in over this long weekend in the States, I find myself pondering the changing demand profiles over the lifespan of a typical secular bull market in gold.
The word secular, which has a dictionary definition of “going on from age to age”, is used to describe any major market trend that runs for a long period of time. For a general mental yardstick, I think that a bull or bear market running for a decade or so lands right smack in the middle of the annals of seculardom.
The Great Gold Bull of the 1970s, for example, ran from 1970 to early 1980, exactly one decade. While gold did not rise in every single year, when you look at a long-term chart (see below) this secular bull market is utterly unmistakable. Secular bulls in general stocks tend to last even longer, usually two decades each, like the Great Stock Bull of the 1980s and 1990s.
Since the average investor really only has four decades in which to build his or her fortune, from the ages of 25 to 65, any trend that runs for a decade or more sure does feel like it is going on from age to age! A secular bull or bear can easily run from a quarter to a half of an entire average investing lifespan. Thus it is unbelievably important to run with these primary trends since getting even one wrong could cost an investor half their investing life. The price for fighting these secular trends is staggeringly high.
On the short end of the measuring stick, I think the absolute minimum amount of time necessary for a trend to attain secular status is three years. If any trend runs for less than three years, then it should be considered cyclical instead of secular. Thus it is pointless to even think in secular terms until a trend has been fire-tested and battle-proven for at least three years. Which brings us to our current gold bull.
On April 2nd, 2001, gold was battered down to a devastating 22-year secular low just under $257. This formed a massive double-bottom with similar gold lows on central-bank gold sales in late summer 1999. Prior to 1999, even in nominal terms gold had not witnessed such dismal prices since 1979, ages and ages ago. At the time in 2001 gold sentiment was understandably horrendous, with high-profile predictions of sub-$200 gold abounding. Yet, as markets are wont to do, gold’s secular trend stealthily changed during its darkest hour.
As I hammer out this essay exactly 41 months to the day later, gold’s glorious new bull market is finally readily apparent to all. From April 2001 to April 2004, the requisite three-year minimum necessary to catapult gold’s current bull market into the elite ranks of seculardom, gold has soared over 66% higher. Since we are already three-and-a-half years into gold’s present bull, we have to start thinking in secular terms. Only then can we begin to understand what wonders might lay ahead for gold investors.
Now naturally the tools used to analyze a strategic secular bull are far different from those used to speculate on short-term tactical trends oscillating within the primary secular trends. While various technicals tools are crucial for short-term tactical speculation, long-term analysis is exclusively dependent on fundamentals.
The most foundational of all the fundamentals is supply and demand. As long as demand exceeds supply, prices will be forced to rise over the long term. This elegant mechanism is the ultimate way that free markets allocate scarce supplies to those most willing to pay for them. Eventually some new equilibrium price is found where supply equals demand and the gold market perfectly clears, with no long-term surplus or deficit.
As the invisible hand of the free markets, really the collective buying and selling decisions of every gold player on the planet, guides prices, signals are sent to gold producers, consumers, and investors. The higher the gold price goes, the more gold producers want to sell. Higher gold prices lead to higher supplies of gold as miners around the world rush to capitalize on the increased profit margins on their product.
Of course mining more gold is nowhere near as easy as producing an additional copy of Microsoft Windows! Finding new gold deposits that are large enough to mine is exceedingly difficult, and even once they are discovered it takes years to dig shafts and spin a new mine up to operational speed. For this reason, historically the total global gold supply only grows by an average of a couple percent or so each year. Faster growth is impossible at almost any gold price due to the extreme difficulty and huge capital costs necessary to bring new gold deposits to market.
Thus, on the gold production end supplies are very inelastic to price. Regardless of how high the gold price goes there will not be a flood of newly mined gold as ramping up global gold production fast is simply not viable. But there is another potential supply of gold beyond mining, which comes from investors choosing to sell gold that they have previously purchased.
Since gold is rarely destroyed, virtually all the gold ever mined still exists in various forms today, from bars sitting in secure vaults to jewelry adorning beautiful women around the world. Investors who own this gold can generally be divided into two distinct groups with vastly different motivations, official central banks and private investors. As these investors choose to sell their gold, it can cause additional supply to come onto the markets at various times.
Central banks rightfully see gold, the ultimate money over six millennia of human history, as a threat to their fragile fiat-paper currencies, so they tend to act irrationally. Rather than buying low and selling high like a private investor, central banks buy and sell at the wrong times. Central banks tend to exacerbate secular trends.
At the end of long gold bears central banks wrongly assume that gold is finally becoming worthless so they sell and drive the bear lower. At the end of long gold bulls they worry that their particular fiat paper does not have enough gold backing so they buy and force the bull higher. If the goofy bureaucrats who ran central banks had to trade for a living, they would soon go broke by selling low and buying high!
While private gold investors tend to fear central banks due to their ominous urban-legend status, I don’t believe central banks have any hope of controlling gold action over longer periods of time. It is believed that about 150,000 metric tonnes of gold have been painstakingly chiseled out of the bowels of the Earth during all of world history, and only about 20%, or 30,000 tonnes, is controlled by various central banks today. While 20% is certainly not trivial, it is the private investors that control the other 80% that really hold gold’s destiny in their hands.
Since newly mined gold can only grow total world supplies by a couple percent a year at best, and central banks only control 20% of the above-ground gold and tend to buy and sell at exactly the wrong times lengthening secular trends, the real force to be reckoned with in the gold world is private investors. It is to these private investors, people around the world like you and I, that we must look to understand secular gold bulls.
The key to a secular gold bull is the demand or supply that private investors generate worldwide as they buy or sell gold. It isn’t mining supplies, it’s not central banks, but it is the collective gold transactions of hundreds of millions or even billions of individual investors worldwide buying and selling gold that ultimately sets its price and determines its fortunes.
I believe that the collective demand trends of private gold investors worldwide effectively divide secular gold bulls into three distinct demand-driven stages. In order to understand these stages and their implications, we first have to understand the peculiar nature of gold investment demand.
Normally in economics, the lower the price of something the higher the general demand for it. This is evident everywhere in society today, but perhaps especially so in technology. Twenty years ago when a computer cost $3000+, there weren’t a lot of families with computers. Prices were high and demand was low. Yet as prices gradually fell over the years demand increased far beyond the small enthusiast market.
Today with a decent computer for surfing the Web, e-mailing friends, and doing office work only running $600 or so, computers are ubiquitous. While the statistics say they are out there, I have yet to meet a family without at least one computer in their home today. Whether we are talking about computers, pizza, cars, whatever, the lower the price the higher the demand grows for a particular product. This is a normal downward-sloping demand curve.
But with gold, and indeed most other investments, the demand curve is far from normal. As all contrarians know, in the investment world the higher the price of an investment climbs the greater demand becomes! It is all backwards. While virtually no one wanted anything to do with gold near $250 a few years ago, once gold soars to $2500 everyone will want a piece of it. In the financial world higher prices don’t retard demand, instead they actually breed demand!
The higher the price of gold climbs, the more potential investors will become aware of its impressive returns. As they buy in over time, their marginal investment demand will drive gold even higher, putting it on the radar of even more investors worldwide. This investor demand creates a wonderful virtuous circle, with higher gold prices leading to more interest and higher demand which in turn leads back to higher gold prices and feeds the cycle. There is no better advertisement for a particular investment than rising prices, as most investors are not contrarians so they will only chase existing well-established trends.
And remember that private investors collectively control 80% of the world’s gold, so if demand is growing in this realm it is almost irrelevant what the mines can pull or what nefarious machinations the central banks happen to be up to! The whole secular gold game unfolds in terms of private investor demand for gold, as we are collectively the dominating force in the gold market.
Thus it is not only important to realize that it is not mines or central banks that ultimately drive gold prices, but private investor demand, it is also crucial to understand that global gold investment demand only grows with higher gold prices. Using this high-level model of gold supply-and-demand fundamentals, we can divide secular gold bulls into three distinct stages based on pure global investment demand.
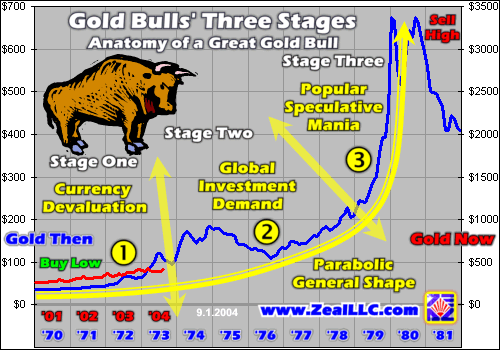
Our lone chart this week compares the Great Gold Bull of the 1970s with today’s young secular gold bull. It is divided into the three distinct stages of a secular gold bull, each of which is driven by evolving demand profiles among private gold investors around the world. And, lighting up my own long weekend, I am thrilled that we were able to incorporate our old bull image which has been largely missing in action in recent years. In my book any graph capable of sporting a cartoon bull is a darned good one!
The first important thing to note on this secular gold bull graph is the typical parabolic shape of a secular gold bull. All secular bulls that ultimately culminate in bubbles exhibit this distinctive pattern of price increases continuously accelerating over time. As this yellow parabola shows, this acceleration is almost imperceptible in the early years, picks up dramatically in the middle years, and is breathtaking in the final years. This pattern was also witnessed in both the NASDAQ and S&P 500 as well during their own recent secular bulls.
The left axis of this graph corresponds to the blue line of the Great Gold Bull of the 1970s. Interestingly, since we used monthly data, this 1970s gold bull is even a bit understated. While the all-time monthly high close for gold is under $700 as this graph shows, gold actually soared to $850 per ounce briefly in January 1980 at the top of its last mania!
The right axis defines the red line, which is our current gold bull to date from January 2001 to today in monthly terms. As you can see, the early slopes of this gold bull and the early years of the 1970s Great Gold Bull match remarkably well. Today, just as gold did from 1970 to 1973, it is once again stealthily climbing the initial modest upslope of the yellow parabola. If our current specimen continues to hold the course plotted before it in the 1970s, gold will ultimately trade over thousands of dollars per ounce before this decade ends!
I believe the key to understanding this parabolic shape that all secular bulls ending in bubbles assume is to understand the changing investment demand profiles throughout a secular bull. The constantly accelerating parabolic profile is driven by shifting investment demand over the life of a secular bull. The higher an investment price gets, the higher demand grows and a positive feedback loop is created.
Stages One, Two, and Three of a secular gold bull are defined by the two major slope changes in this standard secular-bull parabolic ascent. Each stage, considered in turn, makes perfect sense when described in terms of global investor demand.
Gold is ultimately money, and during Stage One bulls it trades like another currency. One of the primary reasons why the Stage One upslope is so moderate is that the main reason gold rises initially is due to a devaluation of the dominant currency in which it is priced, obviously the US dollar today. As the US dollar bear has festered in recent years, and as the dollar eroded in the early 1970s, gold is a direct beneficiary of the dollar’s losses. As the dollar grinds lower, the gold/dollar exchange rate rises.
Since Stage One is currency-devaluation driven, the young gold bull is most noticeable in terms of the dominant eroding currency. Since April 2001 gold’s gains have been greatest in the US since it is the US dollar that is devaluing. But from foreign-currency perspectives, such as the Europeans’, gold has traded largely sideways in recent years. Stage One gold bulls witness gains that are roughly one-to-one with currency losses, so they are most evident in local-currency terms.
Now since these early Stage One bulls are only apparent to contrarian investors in the country with the dominant devaluing currency, overall investment demand is low. Not only is gold coming off a multi-decade secular bear so not many folks believe in it, but it has no established momentum so only hardcore contrarians will even consider it. Even in the States the total capital the contrarians command is very small relative to the markets as a whole, so initial gold buying on the local-currency devaluation is rather anemic and makes for a tepid initial upslope.
Now after three or four years of Stage One, Stage Two arrives. Stage Two marks a momentous event when gold decouples from the local-currency devaluation. In the case of our gold bull today, Stage Two will be here when gold starts consistently rising faster than the dollar is able to fall. This key decoupling works on multiple fronts to really kindle investment demand around the world and marks the first significant steepening of the parabola’s upslope.
Locally, the gold and dollar decoupling in Stage Two leads to accelerating US dollar gold prices. This draws in more American investors, who see the 66% gold gains in the past few years compared to stock-market losses over the same period of time. You can already see the great gold marketing machine spinning up, with even CNBC and Fox News having advertisements today heralding the new bull market in gold. The slowly rising prices of Stage One that drew in the contrarians start accelerating and gradually gold becomes known and sought after outside of the small contrarian community.
Even more importantly in Stage Two though, since gold’s gains start outpacing the dollar’s losses gold starts rising in virtually all currencies worldwide! Rather than appearing flatlined, a mere product of the dollar’s misfortune, gold starts showing up on foreign investors’ radars as it consistently carves new local-currency gold highs around the world. And not surprisingly foreign investors, who generally know how fragile governments and fiat currencies truly are, are far more receptive to gold investing and don’t need convincing like Americans.
Gradually these foreign investors out of Asia and Europe start buying gold and global investment demand accelerates. The more global capital that is poured into gold, the faster its price rises tracking the accelerating parabolic upslope. And of course the faster gold’s price rises the more new capital it attracts. This virtuous circle on a global scale is what fuels the strong gains of Stage Two, which provocatively utterly dwarf Stage One. While gold went from $257 to $427, or 66% higher in Stage One so far, it should trade considerably above $1000 before Stage Two ends, or another 134% higher from here!
After five or so years of Stage Two gains, gold has a chance at going ballistic in Stage Three. Stage Three is only ignited if the general public around the world starts growing enamored with gold investing. If you thought the dot-com mania was crazy, wait until you see a global gold rush. All of us humans have an innate lust for gold burning somewhere in our hearts and there is no rush like a gold rush! Gold rushes define speculative manias!
When the gold bull spreads beyond the usual investment class to the general public, so much capital deluges into gold so rapidly that it is blasted parabolic. Naturally a vertical upslope is totally unsustainable and cannot last for much longer than a year at best. Stage Three is a captivating time for the early contrarians who rode the entire gold bull from its early Stage One days to its mania days. Vast gains rapidly multiply, yet a sustained vertical ascent on a long-term chart is a dire warning sign that the party will soon be ending. Contrarians are torn between riding gold “just a little longer” and immediately selling it all.
Not surprisingly the greatest gains of all are found in Stage Three. Extrapolating today’s bull-market data on a 1970s-style gold parabola, gold could easily shoot from $1000 to over $3500 if the public enters and ignites a popular speculative mania. This massive 250% gain in Stage Three alone is roughly twice as great as Stage Two’s 134% and four times as great as Stage One’s 66%! As the parabola model suggests, secular bull gains multiply exponentially until the bubble pops and the mania comes crashing down.
It is crucial to realize that this unfolding secular parabola is totally dependent on only one force, global investment demand for gold. Mines just can’t wrest enough gold free from Earth fast enough to stop this parabola once it is in motion and central banks’ relatively small 20% control of global gold supplies isn’t enough to stop the other 80% when goldlust spreads from contrarians to mainstream investors to ultimately the general public.
And, unlike normal demand profiles, gold investment demand only increases as gold prices march higher in currencies around the world. The higher the gold price goes, the more demand it spawns, at least until the public jumps in, foments a bubble, and all the capital available to chase gold is already in leading to the bubble bursting and the end of the secular bull market.
If you note the transition in the graph above from Stage One to Stage Two, it looks like our current gold bull is almost there. For a variety of reasons I agree and believe that Stage Two is probably right around the corner today. I am even finding increasing empirical evidence in my research suggesting that gold is now preparing to lift into Stage Two leading to a vast surge in global investment demand in the coming years.
If you are interested in this key Stage One to Stage Two transition, please consider subscribing to our acclaimed monthly Zeal Intelligence newsletter.
In the hot-off-the-presses September issue just published this week, I detailed the actual evidence suggesting that Stage Two is near. In addition I discussed the key market development, which you can watch for yourself, that I believe has the highest probability of signaling that Stage Two is upon us. And, as always, our letter is full of actual stock and options trading recommendations to help you ride this secular gold bull to legendary gains. If today’s bull proves true to the parabolic historical form, then the vast majority of profits still lie ahead!
The bottom line is that today’s gold bull, over three years old now, is definitely a secular specimen. Past secular gold bulls unfold in a massive parabolic shape over a decade or so, driven by accelerating global investment demand. This investment demand growth can be divided into three distinct stages driven first by contrarians, then global investors, and ultimately the general public.
So far our current gold bull is tracking this model perfectly. Even better, increasing empirical evidence suggests Stage Two is near so the upslope of this secular gold bull is due to accelerate significantly in the years ahead. Is your capital positioned and ready to ride this accelerating secular gold bull?
Adam Hamilton, CPA September 3, 2004 Subscribe |
|||||||
|
|
|
|
|
|
|
|
|
|
|
|
|
|
|
|||