|
|
|||||||
|
|
|
|
|
|
|
|
|
|
Valuation Wave Reversion 4 Adam Hamilton October 29, 2004 3842 Words
Seventy-five years ago to this very day one of the worst financial calamities in financial history rocked the world markets. On Black Tuesday, October 29th, 1929, the US stock markets plummeted by 12% after a record 13% drop the day before. This single day of infamy is now universally recognized as the de facto boundary between the boom days of the Roaring 20s and the overwhelming bleakness of the Great Depression.
Today we peer back through history, all smug in our modern sophistication and high technology, and wonder how investors could have been so naïve. Didn’t they know irrational exuberance was multiplying exponentially before the crash? Why didn’t they sell when the Dow rallied back up to 274 a couple days later on Halloween 1929 rather than ride it all the way down to its brutal July 1932 bottom of 41?
Well dear friends, I fear the trick is on us as we plunge into Halloween 2004 exactly three-quarters of a century later. It is depressing to ponder, but for all of our vast knowledge, all of our unprecedented computing power, and all of our lightning-fast telecommunications networks, collectively we are making the very same mistakes of our American investing forefathers. In analogous historical terms, we are probably somewhere between 1930 and 1932 in today’s US stock markets.
How can I dare make a statement like this that seems so blatantly absurd at face value? The ominous answer is found in the Long Valuation Waves.
Stock markets historically move through great cycles lasting about one-third of a century each. During these periods of time, massive valuation waves crest and crash like great ocean waves. Valuations, which describe how high or low stocks are trading relative to their underlying earnings power, start low as each new wave begins building. Over many years valuations are bid up high enough to eventually reach unsustainable extremes. Finally valuations crash and mean revert and the whole cycle begins anew.
If you are an investor and haven’t yet studied these all-important valuation waves, I have written earlier essays explaining this phenomenon in depth. You may wish to check out 2002’s Long Valuation Waves and the original Valuation Wave Reversion essays to dig into the full background. Personally I believe these waves are the single most important macro force for long-term stock investors to understand.
Like the unstoppable great ocean waves, these valuation waves are relentless and immensely powerful. No government or central bank in world history has ever been able to stem their flow. Individual investors who are brazen enough to trade against these mighty waves may as well stand up on some island beach and shake their fist in defiance at an approaching tsunami. Fighting valuation waves is foolish at best, suicidal at worst. Resistance is futile.
Unfortunately these valuation waves are not widely understood, primarily because their wavelengths are so long. With each one of these waves running a third of a century or so, they cannot be casually perceived. If the average investor finally starts getting seriously into investing in their 30s and they retire in their 60s, then they only have a few decades at best in which to invest. Thus, theoretically a single valuation wave can encompass the entire functional investing life of a typical investor.
I often use a seasonal analogy to illustrate this concept. If you live far enough away from the equator and oceans, there are four distinct seasons each year. Since this seasonal wavelength is so short, 1 year, we have ample time in our lives to come to expect the predictable flow and ebb of the seasons. If you experience a glorious sunny 60-degree day in April you know summer is coming and plan accordingly, but if you experience an absolutely identical 60-degree day in October you know from years of experience that winter is still relentlessly approaching despite this beautiful day.
Investing for “summer” valuation wave conditions in a valuation wave “October” is a great way to send your hard-earned capital to its slaughter. Just like the season winter comes whether you believe in it or not, whether you know it or not, and whether you care or not, the valuation waves will march right on through whether or not you believe, know, or care. If you invest with these waves over the long-term you will earn a fortune, but if you fight them they will crush you like a bug, as if you didn’t even exist.
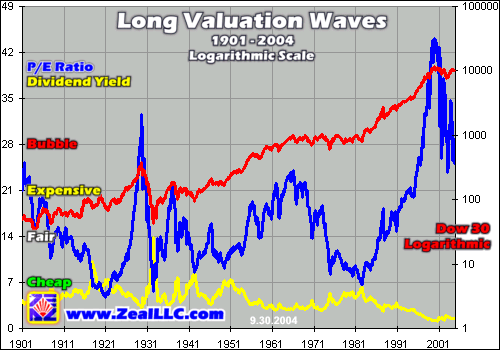
Our first graph updates my earlier Long Valuation Wave work, comparing the valuation waves with the flagship Dow Jones Industrial Average over the past century or so. The left axis graphs valuation, both general stock market price-to-earnings ratios and dividend yields. It is actually the blue P/E ratio line for the markets that forms the valuation waves, as you can see by its lazy undulations through time. The Dow is rendered in red on the right axis, on a logarithmic scale so its percentage gains are constant over an entire century.
The Long Valuation Wave theory is crystal clear when you examine this chart. Stock markets, for herd psychology reasons, tend to gradually oscillate between low valuations and high valuations and back again. A full valuation wave, measured either trough to trough or peak to peak, tends to run a third of a century or so. Long-term equity investing earns investors fortunes when these waves are marching from trough to peak, but kills investors when they are collapsing from peak to trough. Just like speculation, timing is crucial in long-term investing too.
The centuries-old average fair valuation for stocks is 14x earnings, meaning that a market is fairly priced if it takes 14 years after you buy it to earn back your entire purchase price in profits. A market is cheap when its P/E is cut in half, when prices get so low relative to earning power that it trades at 7x earnings. A market is dangerously expensive when its P/E doubles to 28x earnings in a bubble, when investors grow so euphoric that they bid up stock prices far beyond what the underlying fundamental realities can realistically support.
As a long-term investor, it is crucial to buy stocks when they are cheap in valuation terms and sell them when they are expensive. In the chart above, look at the red Dow line every time the blue market P/E line traded near 7x earnings, in the early 1920s, early 1930s, early 1940s, and early 1980s. In each case in the following decade or two investors reaped magnificent gains by buying stocks when they were absolutely cheap by historical standards.
Each of the three greatest bull markets in the last century, the 1920s, the 1950s and 1960s, and the 1980s and 1990s all erupted out of valuation wave troughs. If you are wise enough to buy stocks after long bears when virtually everyone hates them and valuations are very low like in 1982, then you are virtually guaranteed to win enormous long-term profits. This critically important concept forms the very foundation of long-term contrarian investing.
Conversely look at the horrible Dow performance in the decades after 1929 and 1966, when stocks were very expensive and the valuation waves were peaking. In both the 1930s and the 1970s stock valuations ground relentlessly lower, driven by plummeting stock prices in the first case and a seemingly endless sideways grind allowing earnings to gradually catch up in the second case. Investors going long near valuation wave tops inevitably suffer though decade-plus wastelands devoid of any gains at all at best and wickedly brutal losses at worst.
Now the moral of these valuation waves is certainly easy to understand. If you are wise enough to only buy stocks for long-term investing when they are historically undervalued, when a long valuation wave trough has just past, you are probably going to grow rich. But if you are careless enough to buy stocks for long-term investing when they are historically overvalued, you are not going to make any money at all if you are lucky and will very probably throw away most of your capital if you are not.
It is ironic though that these simple truths like buying cheap and selling dear often prove so hard to apply. You and I and everyone else understand that all we need to do to achieve our dream physiques is to eat less and exercise more, to burn more calories a day than we consume. Simple right? Yet, like actually buying low and selling high in valuation terms, it is far easier to talk about running a calorie deficit than actually pulling it off.
Please take another look at this century-long chart and carefully note the current stock-market P/E ratio. It is near 28x earnings, official bubble territory, and still almost as high as the infamous 1929 valuation wave peak! This is flabbergasting because, before last year, no one dared dispute that we were sojourning through the worst bear market in at least a third of a century. Thus, even in light of the brutal bear since 2000 US stocks are still extremely overvalued by all historical standards!
Yet, few investors seem to even care. Wall Street has been hyper-bullish all the way down from March 2000 to today, as the entire reason for its existence is to unload companies’ stocks on an unsuspecting public regardless of prevailing market conditions. Thanks to the powerful war rally unleashed last year, even mainstream investors are buying into these new-bull-market theories today, a terrible tragedy. Long-term secular bulls never, ever erupt from valuations as excessively high as last March’s or today’s!
In valuation wave terms, today we are mean reverting back down from a 33-year peak to a 33-year trough at some point in the coming decade or so. The 2000 valuation wave crest shown above looks very similar to 1929’s, only much larger. The next major inflection point for the US markets is not the far higher valuations that a major bull would bring, but far lower valuations.
There are only two feasible paths to far lower valuations, and neither is particularly pleasant. In the early 1930s stock prices collapsed much faster than earnings so P/Es plummeted in a relatively short period of only a few years. While extraordinarily painful and costly for those who naively believed in “investing for the long-term” at all costs during all valuation seasons, at least the valuation wave reversion in the early 1930s was relatively fast so other more rational investors could get on with investing at the valuation wave bottom in 1932.
The second path was followed in the late 1960s and 1970s. Stock prices didn’t fall dramatically, instead they ground miserably sideways for the better part of two decades until corporate earnings caught up enough to lower P/Es to the necessary 7x valuation trough level from which mega-bulls launch. This catching-up process took 17 excruciating years!
While seemingly less painful on the surface than the early 1930s, the ugly 1970s market was far worse in my opinion since it totally exhausted the majority of existing investors’ total time. If we mere mortals only have a few great decades in which to seriously invest, from our 30s to 60s, and a market trades sideways for 17 years of this precious time like it did from 1966 to 1982, then our individual opportunities for fortune are irretrievably squandered by such a catastrophic event.
As an investor I can’t imagine a greater financial curse than being hoodwinked into investing in an overvalued market and then watch my investments gain no value for nearly two decades. This curse is compounded tremendously because during those two decades fiat-currency inflation erodes away the purchasing power of capital so in real inflation-adjusted terms serious losses are actually being accrued.
With the Long Valuation Waves unstoppable, far lower valuations are almost certainly coming, either by brutal plummeting over a few years or an endless demoralizing grind over a couple decades. General stock-market valuations oscillate between undervalued and overvalued levels and back again throughout history without fail, and unfortunately we are on the “back again” valuation mean reversion following a massive peak in early 2000.
If you are a long-term investor not versed in contrarian thought or have never been exposed to valuation waves, you probably either feel like I am kicking you in the teeth right now or that I am a lunatic, totally wrong. Actually, I would not mind being proven wrong one bit on this one since neither valuation mean reversion alternative appeals to me either. Like you I have worked unbelievably hard all my life to earn my capital and it pains me to realize that I face investing in a valuation mean reversion where all market forces conspire against me and other investors.
Nevertheless, my personal feelings and yours are totally irrelevant. The markets couldn’t care less about you or me as a person. The valuation waves flow and ebb whether you and I like them or not, and putting our heads in the sand and hoping for the best is a pathetic way to address a threatening situation. Strong evidence continues to accrue that a valuation wave mean reversion is already underway, and no force on earth can stand in its way if history is a valid guide.
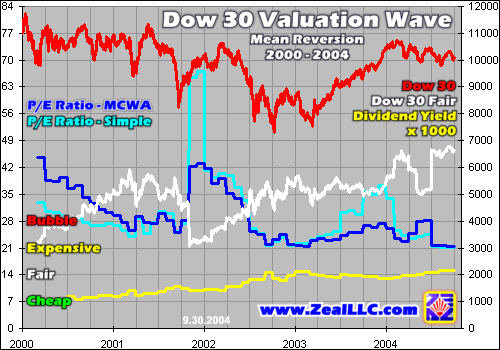
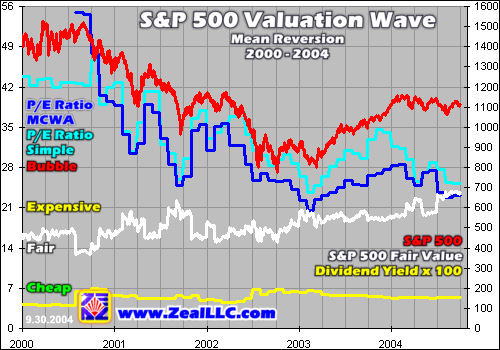
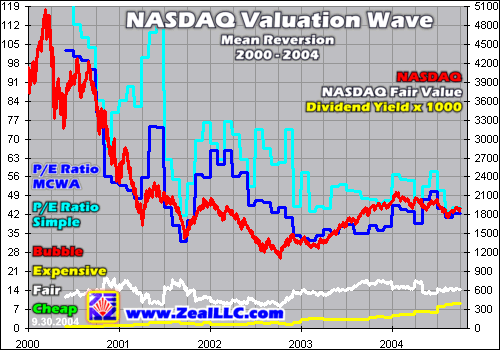
Our final three graphs detail this mean reversion evidence in the three major US stock indices. These charts were explained in detail in prior essays, but for now please just focus on the blue P/E ratio valuation lines and the yellow dividend yield valuation lines. Like it or not, they are mean reverting.
Since the last valuation wave peaked in early 2000, general market P/Es are shrinking while dividend yields are rising. Last year’s spectacular war rally temporarily slowed this inevitable process, but it certainly didn’t end it. Massive bear-market rallies sometimes running a year or more were witnessed after 1929 and 1966 too, but those prior valuation wave mean reversions ultimately won in the end, as will today’s.
The legendary Dow 30’s valuation wave mean reversion chart is very revealing. After trading above 42x earnings in early 2000, crazy levels never before witnessed in its entire 107-year history, the Dow is still trading around 21x earnings today! Realize that in all of Dow history, a major bull market has never, ever launched from such expensive levels, 50% above historical fair value. Never!
Now if you, your broker, or your financial advisors believe that the Dow is going to rally significantly higher from here in the immediate years ahead, say up 40% or more to 14,000 or higher, then you are betting for higher valuations. Higher prices mean higher P/E ratios because ultimately underlying corporate earnings cannot grow faster than the underlying US economy. The P in the P/E ratio can certainly be bid higher, but the E is not going to miraculously jump ahead of general economic growth.
Thus, please realize that a bet today that blue chips are going lots higher in the coming few years ahead is a bet for something that has never happened before in market history. Not only is it a bet that an already-in-progress valuation wave mean reversion can somehow be short-circuited, but it is a bet that a secular bull will launch from 21x earnings for the first time ever.
Back to our seasonal analogy, this is like witnessing a glorious 60-degree day (the 2003 war rally) in valuation October and betting that winter must therefore miraculously vanish to immediately make way for summer again. Just as winter inevitably follows October in our 1-year seasonal cycle, so does a valuation wave trough near 7x earnings inevitably follow a valuation wave peak in the 33-year Long Valuation Wave cycle.
If you are long-term long on US stocks at this stage in the valuation waves, then you are making a conscious and willful decision to spit in the face of market history as well as declare that you are somehow exempt from the timeless laws of the markets. Please realize that betting for something that has never happened before is not a high-probability-for-success gamble.
The mighty S&P 500, which contains the entire Dow 30 and much of the NASDAQ 100 companies within its elite ranks, is faring even worse than the Dow. The SPX is now trading above 21x earnings with a dividend yield under 2%. At the past century’s greatest buying opportunities, the valuation wave troughs, the SPX traded near 7x earnings while yielding over 7% in dividends. Thus, in pure historical valuation terms, the S&P 500 remains far over fair value and roughly triple what it would read at a 33-year valuation wave trough.
One of the greatest things about investing and speculating is the fact that the markets are a limitless environment. You can take your capital and bet any amount of it on any market outcome at any time you want. No one can stop you. But even though you can allocate your funds in any way you wish, that doesn’t mean that the laws of the markets will spare you from your own folly.
It doesn’t matter if I believe in gravity or not, but if I take the risk of jumping out of an airplane without a parachute I am going to splat into a nice bloody crater after my 60 seconds of euphoria. There are no parachutes in the markets either. You can be 100% long-term long after a valuation wave peak, like today, but history teaches this is not a prudent risk to take. Maybe “this time it is different”, the same hope that investors had in 1929, but I really doubt it. As King Solomon wisely said millennia ago, there is nothing new under the sun.
The NASDAQ truly was the nexus of speculative excess in the early 2000 valuation wave peak, and these staggering valuation metrics show it. This mania index was trading at over 100x earnings and yielding an inconceivably low 0.0% in dividends at its peak!
These valuations were so absurdly extreme that they probably haven’t been witnessed for centuries, not since the infamous South Sea Bubble in England of the 1720s or the Tulipomania in Holland in the 1630s. Every market history book from now until the end of time will detail the out of control tech mania of 2000 as one of history’s greatest examples of a popular speculative mania.
It is sobering and frightening to realize that NASDAQ valuations, after last year’s war rally, are now trading around 42x earnings again. This is three times fair value and an unfathomable six times historically undervalued levels near 7x earnings. Remember that historical manias only need to be trading above 28x earnings to be considered classic bubbles, so the NASDAQ remains a valuation bubble to this very day.
Now should mega tech stocks be immune from the laws of the markets? Are mature giants like Microsoft still growth companies? Why should investors be forced to pay 28x+ earnings for a mature tech company when a non-tech company of comparable size and growth “only” costs 21x earnings today? The still prevailing tech valuation premium, a bubble residual effect, is ultimately unsustainable.
Investors seek the greatest bargains for the highest potential returns at the lowest risk, and ultimately we couldn’t care less whether the companies we own sell computer code on CDs or raw commodities. The smartest long-term contrarian investors like Warren Buffett will buy virtually any business if, and only if, it is cheap relative to its current and future earnings and it has a historically high dividend yield. Buying cheap and selling dear ultimately applies to every sector, and technology has no long-term exemption.
The bottom line is we just witnessed a 33-year valuation wave peak in early 2000. Like winter inexorably follows summer, valuation wave troughs inevitably follow the peaks. Being long-term long the general markets during these valuation wave mean reversions is suicidal. To do so one needs to be so overflowing with hubris that they believe that they are miraculously exempt from all of the hard lessons of market history.
Equally folly-filled is financial analysis that neglects to consider the valuation wave season in which we sojourn. One recent example involves the famous VIX implied volatility index. Some folks believe that since the VIX was low in 1994 and the VIX is low today that we are due to have a massive secular bull market in stocks like we did from 1995 to 2000.
Comparisons like these certainly seem seductive and logical on the surface, but does comparing specialized technical indicators between a valuation wave ascent to its peak and a valuation wave descent to its trough make much sense? When valuation waves are rising like from 1982 to 2000, practically everything is bullish except for short corrections. But when valuation waves are falling like from 2000 to 20XX, practically everything is bearish except for periodic bear-market rallies. Please beware of analysis that crosses valuation wave seasons without acknowledging this gaping disconnect. It is just asking for trouble.
If you are interested in our ongoing valuation studies, please consider subscribing to our acclaimed monthly Zeal Intelligence newsletter. Each month end in preparation for publishing my partners and I painstakingly compute the major index P/E ratios and dividend yields shown above from the bottom up. While I live in the realm of financial data constantly, there is no set of numbers that I look more forward to seeing each month than these valuation numbers. Like the position of the sun in the sky, they help us define the major season in which we invest. The latest numbers will soon be out in our brand new November letter hot off the presses.
I am going to start seriously looking for the next valuation wave trough when the S&P 500 P/E ratio falls under 10x earnings and its dividend yield exceeds 6%. Believe me, when this happens I am going to be jumping for joy and this pivotal event will be discussed extensively in our newsletters as we look for blue-chip bargains to ride the next great equity superbull all the way up from the coming valuation wave trough to its ultimate peak.
While not a pleasant subject for investors to discuss during a valuation wave mean reversion, I humbly implore you to consider the sober message of the valuation waves on this seventy-fifth anniversary of the infamous October 29th, 1929 crash. Had you been living then and understood valuation waves, you could have sold soon after the crash and avoided the brutal 85% additional drop to the 1932 bottom.
You and I must choose whether we will learn and apply the hard lessons learned by our investing forefathers or whether we will suffer a similar ill fate. No one can save us from ourselves if we brazenly ignore market history.
Adam Hamilton, CPA October 29, 2004 Subscribe |
|||||||
|
|
|
|
|
|
|
|
|
|
|
|
|
|
|
|||


