|
|
|||||||
|
|
|
|
|
|
|
|
|
|
Valuation Wave Reversion 3 Adam Hamilton November 28, 2003 3626 Words
The single most powerful force driving the stock markets over the long-term is valuation, the level at which the marketplace is pricing the current earnings power of publicly traded corporations.
While valuations can sometimes be successfully ignored over the short-term, it is absolutely suicidal to fight them over the long-term. Popular greed and fear can certainly lead to short-term market movements contrary to what the state of valuations suggests ought to happen, but centuries of market history have painfully proven that there is ultimately absolutely no escaping from the overwhelming force of valuations in the end.
Why are valuations non-negotiable over the long-term, regardless of era, nation, technology, inflation, government mucking around, or any other factors? I suspect that the answer probably lies in our finite human lifespans. If we humans lived 500 years, valuations probably would not be so set in stone over the long-term, but since we are only appointed around threescore years and ten, valuations are immensely important.
It is generous to assume that an average investor only has four short decades to invest. If he starts investing in his mid-20s and retires at 65 to start cannibalizing investments to live, that leaves only 40 years to attempt to multiply wealth in the markets. If this average investor is suckered into paying prices too high for the earnings streams that his corporations are actually spinning off, he will simply not earn enough returns in these four decades to retire.
The historical average price-to-earnings ratio is 14 times, meaning that, on average, over centuries the fair value of stocks in general is a price that is 14x higher than the annual earnings that the underlying companies can produce. At this average P/E ratio, discounting potential growth, it takes a company 14 years after an investor bought it to earn back the original price that the investor paid.
Stated another way, using the reciprocal (1/14) of this historical average fair-value 14x P/E ratio, an investor can expect a long-term 7.1% annually compounded return in the stock markets, which is a fair level of compensation for risking scarce capital. This 7.1% return and 14x P/E ratio over 40 productive years in an average investing lifespan ends up compounding to 15.8x or so, illustrating that over 40 years at fair valuations an investor can expect to multiply his capital by almost 16x, not bad at all.
With only four decades or so in which to invest, accepting returns lower than these due to high valuations can devastate an investor. There is simply not enough time in our short and fleeting human lifespans to wait for overpriced companies to earn us a decent return. If an investor purchases a stock when general valuations are far too high, paying too much for earnings, the mathematics of compounding and our short lives doom him to mediocrity at best and terrible losses at worst.
On the expensive end of this valuation scale, the historical mania-bubble valuation level is 28x earnings in the general stock markets. The reciprocal annual return (1/28) implied by this high valuation is only 3.6% or so. If you compound this kind of return over the same 40 years that we are allotted to invest in our adult lives, your final multiplier is only 4x your original capital. Just by paying a price for your stocks that is twice as high as the long-term 14x earnings average, you lose over 75% of your ultimate gains! Ouch.
Conversely, the hardcore contrarian approach is to not even settle for fair value, but to patiently wait until the general stock markets are undervalued in historical terms. If you are like Warren Buffett and buy at one-half historical fair value, or 7x earnings, your reciprocal annual return (1/7) is a whopping 14.3%! This huge number compounded over four decades yields a final capital multiplier of a staggering 209x!
That’s right, just by buying stocks at historically undervalued levels you can potentially multiply your capital by almost 209x in 40 years! This compares to 16x for buying at fair value and a dismal 4x for playing the fool and buying at historically expensive levels. It truly boggles my mind that anyone ever buys stocks at expensive levels when they are virtually guaranteeing themselves pathetic long-term returns.
With only about 40 productive years in which to earn returns in the stock markets for most of us, there really isn’t much time to mess around which is why I believe fair-value valuations around a 14x P/E are so constant throughout all of market history. It doesn’t matter what era of history you study, or what country, or what market, fair-value always seems to gravitate to around 14x earnings and 7.1%, probably due to our finite mortal lifespans.
During our short decades as investors, the markets tend to meander in lazy giant valuation cycles throughout history, which I call Long Valuation Waves, between undervalued and overvalued levels and back again. The wavelength of these great cycles is about a third of a century each, meaning that we should only expect to witness crazily overvalued markets and dismally undervalued markets only about once each every 33 years or so.
Investors can diligently avoid buying stocks at the wrong time in valuation terms by studying and understanding these Long Valuation Waves. Threescore years and ten, of which only 40 or so are investable, simply do not grant us enough time as humans to accept the abnormally low returns that are inevitably spawned by high valuations, so prudently studying prevailing valuation conditions is absolutely essential for successful long-term investing.
Since it has now been six months since we last examined the Long Valuation Waves and their in-progress mean reversions back down to fair-value after the late 1990s stock bubbles, this week it is time for an update. If these crucial valuation concepts are new to you, please consider skimming my earlier essays which extensively discussed the foundations and logic behind these valuation theories.
The prerequisite essays for today’s discussion include “Long Valuation Waves”, “Valuation Wave Reversion”, “Dividend Valuation Waves”, and “Valuation Wave Reversion 2”. They go into great depth explaining all of these important concepts and will help you understand the immense gravity of valuation, the single most powerful force driving stock markets over the long-term. If you are a long-term investor and you do not understand valuations, your personal battle for wealth accumulation has already been lost. Valuations are truly that important!
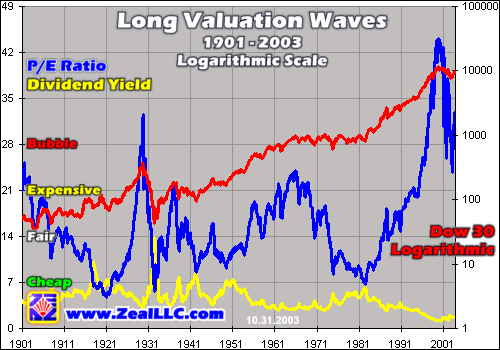
Our first graph this week is the latest update of the massive century-long US Long Valuation Wave chart that was explained in my earlier essays. The state of the Great Bear today becomes crystal clear when viewed through the all-important lens of the Long Valuation Waves.
The one-third-of-one-century Long Valuation Wave wavelengths, which are far too slow for most people to perceive, are quite evident in this ultra-long-term graph. There were three Long Valuation Wave peaks and three Long Valuation Wave troughs in the past century. The red Dow 30 line shows the massive differences in returns that investors ultimately obtained by buying at different stages in the undulating blue Long Valuation Waves.
At the peaks, the very mania episodes when the markets are insanely expensive and general-stock P/E ratios are pushing 28x earnings or even higher, the returns going forward after these euphoric times are horrible. After the 1929 Long Valuation Wave peak, the US stock markets plunged and then traded sideways for almost two decades. The same thing happened again after the 1960s valuation peak, the Dow 30 flirted with the 1000 level for an excruciating 17 years or so before breaking higher. Can you imagine two brutal decades of zero gains after buying stocks?
Provocatively, today after years of a Great Bear we are still at general equity valuations about as high as the 1929 top. The legions of investors that Wall Street has immorally hoodwinked into believing that stocks are “cheap” today are going to lose most of their capital for allowing themselves to be duped into buying into overvalued markets near a Long Valuation Wave peak. They willingly choose to ignore history and they will ultimately pay a fearsome price for their hubris.
On the other hand, check out the stellar US stock returns after the Long Valuation Wave troughs, when general-stock P/E ratios were pushing 7x earnings or so. Not surprisingly, the three greatest bull markets of last century all erupted out of extraordinarily low valuations and earned fantastic wealth for the brave contrarian investors who bought in near the bottoms. Successful long-term investing is only possible for those willing to buy in near the Long Valuation Wave troughs and sell out near the Long Valuation Wave peaks, not the other way around.
It is important to realize that there are only two ways that Long Valuation Wave peaks can resolve themselves. Both of these are illustrated in the chart above. After the late 1920s peak, the markets plunged like millstones and valuations plummeted. This quick and dirty bear ended in 1932 at terribly undervalued levels below 7x earnings in the general stock markets. This first type of blitzkrieg Valuation Wave Reversion is intense and painful, but thankfully it is over relatively quickly so investors can get on with multiplying capital in their four short decades.
The second type of Valuation Wave Reversion happened after the 1960s Long Valuation Wave peak. Rather than plummeting, the markets simply ground stubbornly sideways for almost two decades. Stock prices couldn’t move higher until they were able to collectively let their earnings catch up to their already high stock prices. In my opinion, this grinding-multi-decade-sideways Valuation Wave Reversion is far worse than a brutal early-1930s-style quick one. If investors are trapped in a sideways market for decades, they lose essentially one-half of their total lifetime investment opportunities, a horrifically high price to pay.
Which way will our current Valuation Wave Reversion go today? No one knows yet, but I really hope and pray that it is more like the early-1930s style so our Long Valuation Wave trough arrives sooner rather than late-1960s style where we have to wait endless years in a wearying sideways grind to eventually see undervalued stocks again. Losing two decades of critical investing time while earnings catch up to hyper-overvalued stock prices is the worst possible outcome for all of us, a true tragedy if it happens again today.
Our updated graphs on the states of the individual Valuation Wave Reversions now in progress in the Dow 30, S&P 500, and NASDAQ offer some insights into which path we may be tentatively heading down today.
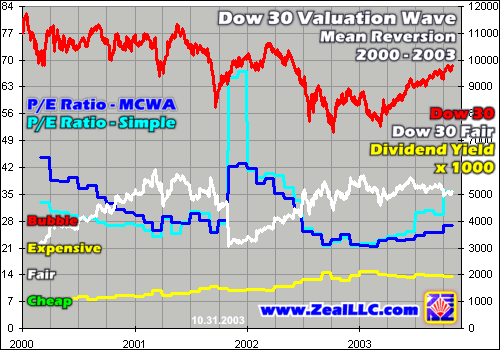
The blue-chip Dow 30 seems to be on the long, painful, seemingly endless post-1960s path today for a slow Valuation Wave Reversion. In both late summer 2002 and February of this year the index had a chance of trading down under the historically expensive level of 21x earnings again, but both times speculators ignited short-term rallies that catapulted valuations far higher. As of our latest data the Dow 30 is almost officially back into bubble territory again at 28x earnings in market-capitalization weighted terms, a truly stunning event to behold several years into a Great Bear!
Perhaps this shouldn’t surprise us though. Big round Dow 30 numbers seem to take an exceedingly long-time to decisively punch through, as I explained in “Century of the Dow”. Dow 100 took 8 years to tentatively fall in the late 1920s bubble, but a grand total of 26 years to be decisively left behind forever. Dow 1000 did not decisively fall until 17 years after it was first challenged. There is probably no reason why Dow 10000 will be any different, although the prospect of another decade-plus of sideways Dow-30 grinding around the 10k line is not a happy thought for us time-limited mortal human investors.
Out of the Big Three US indices though, the Dow 30 has the highest probability of trading sideways for many years simply because it will be viewed as the safest place to park capital in stocks for the longest time. If the NASDAQ was to start plunging in a fast Valuation Wave Reversion of its own for instance, it is conceivable that some flight capital would bid on Dow 30 blue-chips and keep this flagship US index from falling off a cliff even if the general markets manage to do so. The elite Dow companies, with the exception of the few hyper-overvalued tech components, will probably fall less rapidly in a major downleg than the riskier general markets.
As the white fair-value line above indicates, in order to be valued at 14x earnings today the Dow 30 would have to grind down to 5000 or so. This level has been more or less constant between 4000 and 6000 for the last several years, indicating that the corporate earnings of Dow 30 companies have only been able to fundamentally support this type of valuation since almost back when the Great Bubble burst. If US corporate earnings were really collectively rising by a significant amount in recent years, this line would be trending higher as well.
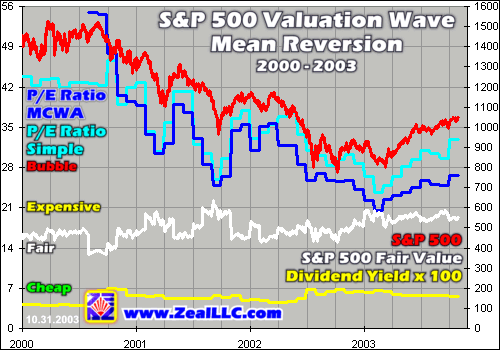
The S&P 500, which includes both blue-chip and far more speculative companies, is in much the same boat as the Dow 30. The war rally managed to bully the S&P 500 MCWA P/E ratio almost back up to official bubble territory at 28x earnings, an astounding development deep in the belly of a Great Bear. I suspect that future market historians will look back at the large rally of 2003 and marvel that anyone was fooled into believing that the bear was really extinct when valuations were once again approaching official bubble levels. Talk about hubris!
Unfortunately the situation in the S&P 500, the best proxy for the general US markets as a whole, is very similar to the Dow 30’s. The S&P 500’s MCWA P/E ratio, which is also the best number to use to measure general-market valuations, remains very high approaching 28x bubble valuation levels. It briefly fell below 21x in February before the war rally launched, but it has since relentlessly marched right back up to dangerous levels again.
It is really interesting in MCWA P/E terms to look back at the last two major times the S&P 500 traded near 1000, in both mid-2002 and right after the 9/11 attacks. In both cases, just like today, the MCWA P/E of this flagship index managed to hover just under 28x earnings. I find this provocative because it shows that US corporate earnings of the 500 biggest and best companies in America have collectively virtually not risen at all in the past couple years. This startling development is ominous since it shatters the popular Wall Street myth of big earnings growth in US corporations in recent years.
To return to 14x earnings, the S&P 500 would have to trade down near the 500 level on this index, a long ways down from here. Fair value in recent years in historical valuation terms has fluctuated between 400 and 600 or so, but like the Dow 30 this line is not really trending significantly higher. And if US corporations collectively cannot ramp up their earnings to justify their very high stock prices, than this powerful Valuation Wave Reversion will drag S&P 500 prices lower to bring valuations back in line with market history.
The yellow dividend yield line is also interesting, as it is still hovering under 2% for the entire S&P 500. I remember back in January 2003 when the abolition of the immensely immoral double taxation on dividends was being widely discussed. Wall Street claimed at the time that this would unleash a torrent of fresh dividend payments and raise dividend yields. As the graph above shows though, almost a year later, no such thing has happened.
Unlike earnings, which can be somewhat faked with all kinds of accounting games, actually cutting and mailing cash dividend checks requires real cash in the bank. Dividend payments cannot be falsified, either companies have the cash to pay them or they don’t. The elite S&P 500 corporations apparently were not collectively able to increase their dividend payments significantly in 2003, a bad sign in a supposed economic recovery.
These Valuation Wave Reversion trends like this declining dividend yield in 2003 even in the face of tax reforms help illustrate what is really going on underneath the surface in the stock markets, stripping away the incessant Wall Street hype. Ongoing valuation studies are incredibly important for investors to undertake!
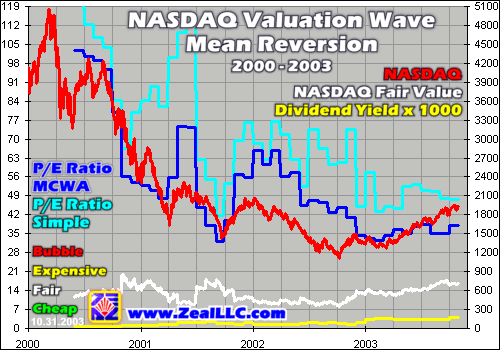
Last, but certainly not least, the updated graph of the Valuation Wave Reversion of the speculative-mania-central NASDAQ is very interesting. Amazingly enough, the earnings of the NASDAQ companies actually really did rise modestly in 2003 along with the war rally! Will wonders never cease?
Isn’t this an interesting turn of events? The NASDAQ, the very epicenter of the speculative mania, actually contains some stocks that are growing earnings! How do I know? Even though the massive rally in the past year in this index has pushed it up by 75% or so, valuations have only risen modestly in 2003 from just under 35x earnings to just over 35x earnings. Without the earnings increases in the underlying components, the NASDAQ’s MCWA P/E would have risen by a similar percentage to the index itself, like the Dow 30 and S&P 500 above.
I am not sure what the cause of this earnings boost in technology land is. Perhaps it is the long-awaited next computer/software upgrade cycle for US corporations finally beginning. Pretty much everyone upgraded their computer hardware and software right before Y2k, but that technology is ancient now at four years old and definitely needs replacing at some point. The technology perma-bulls have been prophesying about this upgrade cycle for years, but maybe it is truly arriving now.
Another possibility is rising Asian and European tech demand, as some of the elite American tech companies like Intel and Dell are reporting some excellent increases in non-US sales in the Pacific Rim and Europe. And maybe the war rally in US equities in 2003 is just making people feel good enough in America that average consumers are upgrading computers and buying new consumer technology. Whatever the causes though, NASDAQ earnings in 2003 apparently rose far faster than those of the other Dow and S&P companies.
Lest any of you die-hard tech bulls out there think I am going soft on the NASDAQ, it is still in serious trouble from a valuation perspective. As 28x earnings is official bubble territory, current NASDAQ valuations pushing 40x earnings are utterly ludicrous. If we human investors lived 500 years maybe it would be acceptable to pay a price for a company that takes four decades for the company to merely earn back, but with our short lifespans paying 40x earnings for anything is craziness. Imagine paying almost $500k for a rental property that you can only rent for $1k a month, a similar exercise in futility. Pretty silly, eh?
While it is certainly interesting looking at the tactical valuation trends in the Dow 30, S&P 500, and NASDAQ so far in 2003, the big story remains the massive Valuation Wave Reversions in progress. In history markets get overvalued and then undervalued, riding both the Long Valuation Wave flows and ebbs, the peaks and troughs. Just like a pendulum reversing direction, once they are started Valuation Wave Reversions don’t stop until undervalued levels are hit again.
Reexamine the graphs above, focusing on the white 14x earnings fair-value lines, but instead imagine them half as high at 7x earnings. As the Long Valuation Waves relentlessly revert, they are going to carry these markets below fair value one way or another. It may be via a sharp fall as in the early 1930s, which would be preferable, or it may be with a demoralizing multi-decade sideways grind until earnings catch up with prices that utterly breaks the will of the majority of today’s investors to even participate in the markets anymore.
The bottom line is that all of market history emphatically insists that our current Great Bear is nowhere near being over while current valuations remain near bubble levels. The US markets remain extremely dangerous until at least the S&P 500 trades under 14x earnings, and they won’t be a legendary contrarian buying opportunity until they once again approach 7x earnings. Paying any more than this for long-term investments in the declining face of a Long Valuation Wave is virtually guaranteed to destroy one’s precious capital.
If you want to stay abreast of current valuations every month, we painstakingly compute them each month-end and publish them in our acclaimed monthly Zeal Intelligence newsletter for our subscribers. The latest November month-end index valuation numbers for the Big Three US indices will be published very soon in the upcoming December issue of ZI. Join us today!
Wall Street can say whatever it wants. There is never a bad time to buy any stock if you work on Wall Street! But history says something else entirely. Investors who buy in near the top of Long Valuation Waves or too early in their mean reversions inevitably get slaughtered like sheep.
We all only have about four decades to invest due to our very short human lifespans, and it makes no sense at all to settle for terrible returns during this limited time because we paid historically overvalued prices for the earnings that companies are able to spin off. You can only ignore general valuations at your own great peril!
Adam Hamilton, CPA November 28, 2003 Subscribe |
|||||||
|
|
|
|
|
|
|
|
|
|
|
|
|
|
|
|||


