|
|
|||||||
|
|
|
|
|
|
|
|
|
|
Long Valuation Waves Adam Hamilton October 18, 2002 3975 Words
Almost two millennia ago some of the most important events in world history unfolded near the Temple Mount in Jerusalem, the ancient capital of Israel. The Pharisees, religious authorities of the era, were trying to trap Jesus Christ into breaking the Jewish Law with a series of cunningly-devised questions.
After Jesus deftly parried their first attempts with displays of dazzling wisdom, one expert in the law tested Jesus by asking, “Teacher, which is the greatest commandment in the Law?”
The Pharisees fully assumed this thorny question would trip up Jesus, as he was expected to fall head-first into the temptation of elevating one part of the Law above another, effectively blaspheming the Tanakh, the Jewish Holy Scriptures known today by Christians as the Old Testament of the Bible. Jesus blew the Pharisees’ minds with his amazing answer.
Jesus replied, “Love the Lord your God with all your heart and with all your soul and with all your mind. This is the first and greatest commandment. And the second is like it: Love your neighbor as yourself. All the Law and the Prophets hang on these two commandments.”
Jesus Christ, by far the most important man ever to grace humanity, stunned the Pharisees. He had brilliantly and perfectly distilled the essence of the whole Tanakh down into two immensely powerful, elegant, and eloquent sentences.
This was no small feat, considering that the Tanakh would later be divided into 929 chapters to become the Christian Old Testament, almost 80% of the Bible. Jesus perfectly expressed the deep core message of 593,493 words in only 24 exquisitely chosen words!
This amazing account recorded in the 22nd chapter of the gospel of Matthew has always had a very powerful impact on me personally. In addition to blessing us with two crucial overriding life principles that everyone should always strive to live by, Jesus deftly condensed the long and complex Hebrew Scriptures down to their very fundamental essence.
Ever since I first read and marveled at these ancient words as a boy, I have become increasingly aware during my life that some the greatest truths in history can be distilled down into simple words which even a child can easily understand. Not surprisingly, the core essence of investing can also be stated in similar condensed terms.
The whole goal, mission, idea, and concept of investing can be refined into merely 4 words which everyone can easily understand…
Buy Low Sell High.
That’s it! The core essence of investing is exceedingly easy to comprehend. Even kids can wrap their minds around this simple idea and walk away with the pinnacle of investing knowledge treasured in their brains.
While simple in concept, execution is a whole other matter!
Loving your neighbors is easy on paper, but when they wake you up at o-dark-hundred some Sunday morning with a raging out-of-control party and beer cans strewn all over your yard, the only loving that comes to mind is dispensing some swift 12-gauge justice. The hot emotions of the moment obscure Jesus’ Greatest Commandments and make actually living them very challenging in real-time.
The same timeless truth applies to investing. While buying low and selling high sounds effortless on paper, it is extremely challenging to execute in real-time. First, the great mystery arises of whether a price on any given day is low, a buy, or high, a sell. Second, investors must wage a continual jihad against their own emotions because emotionally-based buy and sell decisions are almost always the exact wrong ones to make at any given moment in time.
While the latter emotional challenge to investors is something each one must individually struggle to overcome over many years, the former mystery can simply be unlocked academically. In this essay I would like to share some crucial foundational strategic information on buying low and selling high that is incredibly important for all investors to understand. Out of all 125 essays I have already penned on investing and speculation, I believe the information presented here is the most important and valuable.
Interestingly, investors today struggle with the same emotions that plagued people in Jesus’ day. Unfortunately there is no room for love in the financial markets, as they are utterly dominated by the perpetually-warring titanic emotions of greed and fear.
In the markets, when the popular emotion of choice is greed, investors are consumed with visions of alluring wealth and bid up stock prices to very high levels. Conversely, when fear reigns supreme, investors dump stocks like they are radioactive and want nothing to do with the infernal instruments, bludgeoning prices to very low levels.
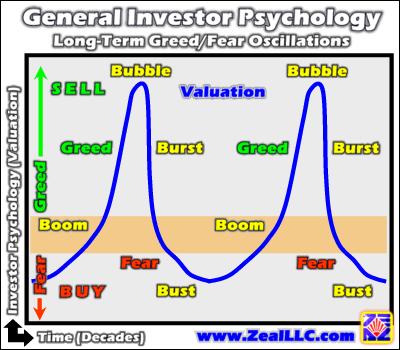
These popular periods of general greed and fear oscillate through market history like a massive sine wave around a straight line. Our first graph stylizes these long waves of greed and fear that inevitably lead to over and underpriced markets through history.
General investor psychology, popular greed and fear, leads to periods of alternating over and undervaluation throughout market history. The orange area above represents fair value, the historical average valuation for stocks. The blue line represents Long Valuation Waves over decades.
The wave begins as investors, after a long hibernation, start getting excited about the markets again and a boom is born, carrying stock valuations from cheap levels up through fair-value ultimately up to richly-priced levels. Sometimes, if the participation in the markets is wide enough and general enthusiasm is high enough, a boom morphs into a spectacular speculative bubble.
These mania times mark extreme systemic greed, when all anyone ever talks about is how rich they will become from the rocketing stock markets. Sound familiar? Eventually the bubble mysteriously starts fading and soon crashes, usually for no apparent news-driven reason. The bubble bursts and greed bleeds away fast and eventually general fear takes command which leads to a market bust.
Then, like the stylized saw-teeth above, the strategic psychology/valuation cycle arises anew like a phoenix being reborn from the ashes. Boom bubble burst bust. Boom bubble burst bust. The Long Valuation Wave continuously echoes through the sands of time of market history.
To achieve the core investing goal of buying low and selling high, your highest probability of realizing great success is to buy the fear-laden busts and sell at the greed-ridden bubble tops. This idea inevitably leads to the crucial question… How does one know in real-time, while neck deep in mud and blood in the trenches, when the markets are overvalued or undervalued?
The answer is valuation.
The word valuation, in the investing context, simply involves understanding how much a stock index or individual stock is truly worth based on its underlying fundamentals. Obviously if an investor knows whether the stock markets are overpriced or underpriced at any given time, he or she will be able to make far superior capital deployment decisions than another investor who has no understanding of valuation.
Understanding valuation is truly the key to long-term investment success!
There are many ways to value stocks, but two primary methods have steadfastly withstood the ravages of time and have emerged unscathed through all the trials and tribulations of history. While often maligned in today’s greed-laden post-bubble atmosphere, the mighty price-to-earnings ratio and humble dividend yield still remain the ultimate long-term strategic valuation tools.
P/E ratios are easy to calculate in theory, but in today’s environment of ubiquitous earnings and accounting games one must be cautious on what earnings to use. Generally the most conservative possible “E” should be used, SEC-reported GAAP numbers. To compute a P/E ratio, the price of a stock is simply divided by its latest annual earnings per share. If a stock is trading at $50 today and earned $5 per share last year, its P/E ratio is 10.
Publicly-traded companies often make quarterly cash payments directly to their owners, the stockholders. Some percentage of corporate earnings are paid out in cash dividends. To compute a dividend yield, all one has to do is find out how much a company has paid in cash dividends over the last year and then divide this by its current stock price. If a stock is trading at $50 today and paid out $2 per share in cash dividends to its shareholders last year, then it has a dividend yield of 4%.
Long-term strategic valuations of stock markets can always be discussed and understood in terms of P/E ratios and dividend yields. Fortunately, both P/E ratios and dividend yields are virtually immune to distortions from the ravaging effects of the inflation plague the Federal Reserve has shamefully unleashed upon the American people. Stock prices, earnings levels, and dividend streams are all influenced more or less equally by inflation over the long-term, so these two valuation tools thankfully do not require inflation to be explicitly considered in the calculations.
If valuation truly matters, indeed it is everything for the long-term investor, and P/E ratios and dividend yields can measure general valuation levels, we also need to understand where fair-value lies. Without the blessing of the vast wisdom of market history, a rookie investor will have no idea whether a P/E of 10 or 100 is a better omen for the future prospects of the stock markets.
To determine baseline fair-value P/Es and dividend yields, we need huge amounts of historical price, earnings, and dividend data. The farther back in time we journey, the more difficult this information is to assemble. Thankfully, a gentleman has already done the massive amount of back-breaking research necessary to unearth the raw numbers.
I am deeply indebted to one of my personal financial heroes, the brilliant Professor Robert Shiller of Yale University, for painstakingly assembling raw earnings and dividend data from over 130 years and graciously making it available to private investors and analysts for further studies.
Dr. Shiller wrote the phenomenal book “Irrational Exuberance” and published it before the equity bubble topped in March 2000. In his awesome tome, Shiller warned and meticulously documented the case that stocks were overvalued, the bubble was ready to burst, and intermediate-future returns in the stock markets would be poor. I suspect that a century from now this amazing book will be widely recognized as the most prophetic book about the markets ever penned!
Shiller’s book is one of the most important books on investing I have ever read and I highly recommend that every serious investor purchase and carefully study a copy immediately. It greatly deepened my own understanding of the financial markets and how they really work through history. You owe it to yourself to buy it today if you want to build legendary wealth through prudent long-term investing.
Dr. Shiller, in the admirable selfless interest of advancing general market knowledge, generously placed his research data on his website ( http://aida.econ.yale.edu/~shiller/ ) for the world to use. Without his hard work, great wisdom, and careful studies, this essay wouldn’t be possible. The earnings and dividend data used here are gleaned from his landmark research.
In Shiller’s data, the average historical P/E ratio for the general US equity markets (the S&P Composite Index) from 1895-1995 was 14.6x earnings. This number is slightly higher than other historical studies I have seen, indicating a 13.5x historical US equity P/E, but the core message of the data is still loud and clear. Fair-value for stocks is right around 14x earnings, a P/E of 14.
Why 14 you wonder?
Profits are everything for equity investors. Nothing else matters over the long run. When you choose to purchase a company, the only reason you make the buy is because you expect it to earn profits. As a stockholder, you are entitled to your fractional ownership share of corporate profits. If a company does well, its profits will translate into a higher share price and higher dividends and you will reap a good return on your investment.
Over centuries of equity investing in the United States and Europe, public companies have had average share prices hovering around 14 times their annual earnings. It has been the long-term fair-value around which stock markets have faithfully oscillated. A P/E of 14 suggests it will generally take 14 years, not considering growth and compounded returns, for a company you purchase to earn back your full purchase price for you.
A P/E of 14 corresponds to a simple annual return of about 7% (1 divided by 14), which is fair. It was fair a century ago, it is fair today, and it will still be fair a century from now. 7% is a reasonable return to earn for a saver, an investor, and a reasonable “cost” for a “borrower”, a company. Imagine if you could only make 1% in the stock market, it would feel far too low right? What if your mortgage cost you 20% like credit cards? It would feel far too high right? 7% is like Goldilocks’ legendary porridge, just right!
Interestingly, the long-term historical return for the US equity markets averages right around 7%. The more one studies valuations, the more it cements everything else studied on the markets together into a coherent and understandable whole!
Shiller’s dataset showed that the average dividend yield for the general US equity markets was 4.6% from 1895-1995. 4.6% can be considered historical fair-value for US equity dividend yields.
Armed with this priceless information, the prudent investor is able to make rational, intelligent strategic decisions about when to buy low and sell high!
If general US equity P/E ratios are around 14, they are fairly-valued, neither a buy nor a sell. If they are one-half fair-value, 7x earnings, they are a screaming buy indicating very cheap stocks. Conversely, if they are 50% higher than fair-value, at 21x earnings, they are expensive and should be sold. If general P/E ratios explode up to twice fair-value, 28x earnings, they are in speculative bubble mania territory and extreme caution should be exercised. Stocks should generally be sold immediately from bubble-level general P/E ratios.
Similar logic applies to dividend yields, with 4.6% being fairly valued. Dividend yields have an inverse relationship to P/E ratios however, while low P/Es are strong buy signals so are high dividend yields. Low dividend yields signal overvaluations and historic sell signals.
Tying everything we have discussed together, Shiller’s wonderful historical earnings and dividend data brilliantly illuminate the essence of investing. Buy Low Sell High. With fair-value general US equity valuations being 14x earnings and 4.6% dividend yields, we now have a benchmark to know when valuations are too high suggesting a great sell point or too low suggesting a great buy point.
The following five graphs use Dr. Shiller’s earnings and dividend data to compute historical P/E ratios and dividend yields for the general US equity markets (S&P Composite Index) for the entire 20th century, from 1901 to 2000. We decided to use the elite Dow 30, the most famous stock index in history, as our graph proxy for US stock prices rather than the S&P Composite because the Dow 30 is much more widely known. All P/Es and dividend yields below are based and computed off of the general US markets, but the narrow Dow 30 is used for the visual price proxy.
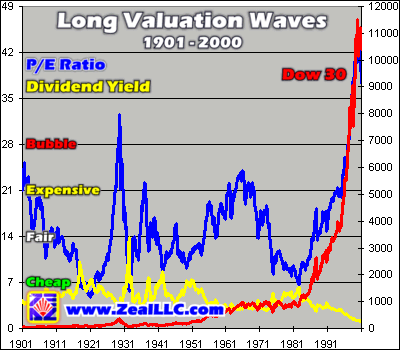
The mighty P/E ratio, along with its cheap, fair, expensive, and bubble levels, as well as the dividend yields, are graphed on the left axes. The Dow 30 visual proxy for US stock prices is graphed on the right axes. All data is monthly. The graphs enable the data and concepts to vividly leap to life!
Just as contrarian investment theory suggests, great waves of greed and fear cascade through history. These titanic emotional forces push general US equity valuations from under to overvalued extremes and back again, like strong trade winds driving a great tall ship. Like a giant sine wave, the blue P/E line above slowly oscillates above and below fair value at 14. Dividend yields do the same, although they aren’t as readily apparent limited to the small vertical scale shown above.
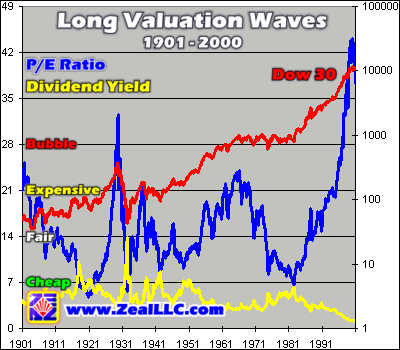
Over such long periods of market history it is misleading to graph stock indices on linear scales, as percentage gains are not viewed as constant across time. Our next graph is the same data as above, but the Dow 30 visual stock-price proxy is graphed on a logarithmic scale, which means its percentage changes appear next to a constant base across decades. The Dow 30 rise from 100 to 1000 appears the same visually as the Dow 30 rise from 1000 to 10,000, both equal 900% gains in price.
I strongly believe that out of all the 500 or so graphs we have produced at Zeal thus far, this is probably the most important one.
If you diligently study, digest, and grow to understand this Long Valuation Waves graph, your probability of investment success will be very high. It is a veritable treasure map for the young, protecting them from repeating the mistakes of the past and showing them the path to legendary stock-market profits in their lifetimes. It is a safety-net for the old, preventing them from throwing away their hard-earned capital by making major strategic errors in long-term buy and sell timing.
Please study this, learn it, love it, and live it! It truly shows the road to buying low and selling high in crystal-clear terms.
In a nutshell, the message of the markets encapsulated in the graph of Shiller’s landmark data is this…
If you buy general US stocks when they are undervalued, a P/E near 7, you are likely to reap astounding profits in the following years. On the other hand, if you buy the US markets when they are overvalued, a P/E above 21, you are likely to lose capital or see no gains for decades. Buy low, when valuations are cheap, and sell high, when valuations are expensive. Ride the Long Valuation Waves from trough to peak, but then get off and patiently wait for the next ideal wave!
Our final three graphs this week divide the 20th century into thirds, and it is amazing and enlightening to see how buying low and selling high based on valuations leads to consistently legendary gains for prudent investors.
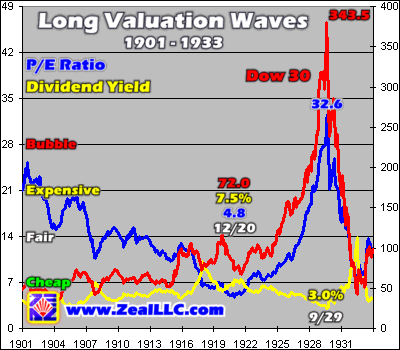
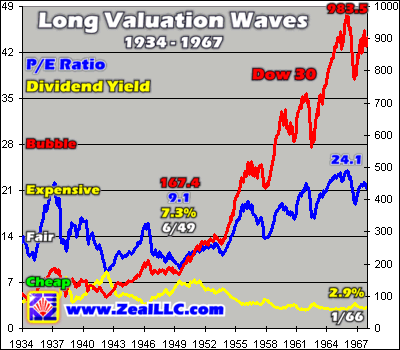
The first third of the 20th century climaxed in the most famous bubble and bust of all time. Not surprisingly, if you were armed with Long Valuation Wave wisdom and invested during this era, you could have easily bought near the bottom and sold close to the top.
In December 1920, the general US markets were trading at an abysmal P/E of only 4.8, incredibly cheap. Even though stock prices were already much higher than the early decades of the century, stocks were still enormously undervalued. A prudent investor could have bought the Dow 30 at 72 when the US markets were trading at 4.8x and yielding a massive 7.5%.
Almost a decade later in September 1929 one of the biggest stock market booms in history had erupted, leading to extreme valuations. If an investor of the time understood Long Valuation Waves, he or she could have exited near the top. The September 1929 monthly Dow close of 343.5 wasn’t the exact daily top of 381.2, but it was darned close.
A Long Valuation Wave surfer could have made a relatively low-risk strategic equity trade in the Dow 30 by buying cheap and selling dear for a magnificent 377% gain in the 1920s!
In the middle of the century, an even greater opportunity presented itself, two dismal valuation lows followed by an utterly fantastic stock boom. Even buying at the higher second valuation low in June 1949 at 167.4 and selling near the overvalued top of January 1966 at 983.5 would have yielded enormous 488% gains.
If you buy at a cheap general US market P/E near 7 and sell at an expensive P/E above 21 the huge gains are easy, making any investor look like a superstar!
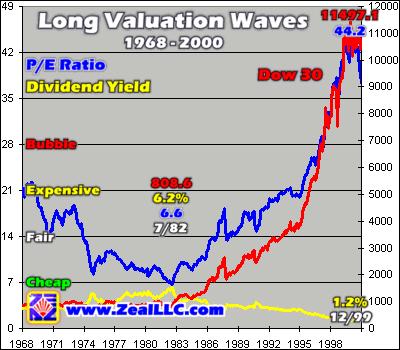
In the final third of last century once again the markets reached undervalued extremes at great general fear during the mid-1970s and later again in the early 1980s. As always though, the great valuation waves of history inevitably regress to their mean at a 14 P/E, rising if they were cheap and falling if they were expensive. And they often overshoot fair-value on both sides, creating enormously profitable opportunities to buy low and sell high.
If a prudent investor bought at the undervalued 6.6 P/E in July 1982 and sold at the super-bubble top P/E of 44.2 in December 1999, he or she would have reaped legendary 1322% gains! Where do I sign up?
Dear friends, the key to successful long-term strategic investing does not rest in attempting to interpret endless day-to-day market noise. It does not rest in buying high and attempting to sell even higher, the so-called “Greater Fool Theory” advocated almost universally on Wall Street today.
The key to long-term investment success is to Buy Low and Sell High, and general market valuations as measured by P/E ratios and dividend yields provide the ultimate long-term buy and sell signals.
Without the proper strategic perspective of knowing where in the Long Valuation Waves our current stock prices lie, investors have no way of understanding whether the markets are cheap or dear based on crucial corporate earnings. Absolute index price levels are of little concern, what truly matters is whether these index levels are relatively cheap or relatively expensive compared to the current earnings power of US companies.
Long Valuation Waves and the enlightened perspective of seeing the markets through their lens are the very essence of contrarian investing. Elite contrarian investors, like the legendary Warren Buffett, steadfastly Buy Low and Sell High, and they ply their wondrous trade via a careful ongoing study of valuation.
Provocatively, contrarian investors are the only consistently successful investors over the long-term, so contrarian investment theory is incredibly important. Contrarians have learned to harness their emotions and buy low and sell high, buying when fear is rampant and selling when greed reigns supreme, the exact opposite of the general public.
I apologize for this lengthy essay, but I wanted to present the basic Long Valuation Wave Theory and data all in a single document. We at Zeal plan to build on these basic valuation studies in coming months and years and expound in greater detail in future research.
As we zealously want to help our clients spot and act upon the legendary buying opportunities approaching after the US equity markets finally bottom in the future, we painstakingly calculate fresh valuation data monthly. Every month we compute real-time S&P 500, Dow 30, and NASDAQ 100 P/E ratios and dividend yields so we and our clients understand exactly where we are in the great Long Valuation Wave cycles. This precious data is available exclusively to the subscribers of our acclaimed Zeal Intelligence newsletter.
I am once again very thankful for and deeply indebted to the great Professor Robert Shiller and his landmark valuation-data work he has graciously shared with the world. If this essay intrigues you, you simply have to go buy his book today for some real enlightenment and wisdom!
Investors ought to carefully learn and understand the Long Valuation Waves if they wish to succeed in the markets. If they ignore the Long Valuation Waves it is at their own great peril.
Buying low and selling high, the distilled essence of all investing wisdom, is only possible with a working knowledge of the massive Long Valuation Waves relentlessly driving the markets.
Adam Hamilton, CPA October 18, 2002 Subscribe |
|||||||
|
|
|
|
|
|
|
|
|
|
|
|
|
|
|
|||

