|
|
|||||||
|
|
|
|
|
|
|
|
|
|
|
|
|
|
|
|
|
|
|
Century of the Dow Adam Hamilton December 21, 2001 5331 Words
The twentieth century proved to be monumentally important on innumerable fronts.
As we all remain so close to the action having only recently made our mass exodus from the twentieth century, there is no doubt that future historians will be able to discern far more strategic changes emerging from the last hundred years than we can perceive right now. Still, some of the incredible achievements of humanity are too breathtaking to overlook even from our jaded perspective.
The birth and evolution of flight, the splitting of the atom, the rise of the computer, the birth of the Information Age, the death of distance, the early work on the human genome… the list of fantastic achievements goes on and on. There has never been a century like the twentieth in terms of raw technical innovation and up until these last hundred years people could scarcely even imagine so much change being possible in so short of time. The enormous list of glorious technical achievements has laid the solid foundations for a twenty-first century of perpetually accelerating innovation so wondrous that no one alive today can even begin to imagine what the world will be like a hundred years from now.
While the stunning technical milestones of the past century are legendary, they were unfortunately offset with many political steps backward.
The mighty gold standard was overthrown in the twentieth century, the invisible hand of free markets forcing discipline upon governments was cast away so frail mortal men in governments and central banks were unrestrained from tinkering with and molesting the global economy. Many once proud sovereign nations decided to sell-out their sovereignty and their people to the odd concept of supra-national governments, strangely placing their national destinies in the hands of unaccountable bureaucrats from other countries.
Immortal moral ideas that have stood the test of time, such as the noble idea that ordinary men and women should live free, that we the people have inalienable rights granted by God Himself that no government can take away, and that governments should remain small relative to the free sector of an economy were sadly tossed overboard in the twentieth century. Morally-bankrupt atrocities like Socialism and Communism were tried and failed on massive scales, and the results were the horrible deaths of tens of millions and the tragic impoverishment of more than a billion people. Yet, the goofy elite and intelligentsia today still place foolish faith in the demonic doctrine of Socialism.
The wars of the twentieth century were mind-boggling in their raw brutality and scale. Rather than allowing the incredible technological innovations of the age to increase the standard of living for people worldwide, governments chose to levy back-breaking taxes on their citizens so the governments could use this blood-money to go murder citizens from other countries with reckless abandon. In a century where free markets should have triumphed and everyone on the planet given the shot at using their own unique gifts to build their own destinies, untold trillions of dollars were flat-out wasted fighting vain wars that accomplished little or nothing other than changing meaningless lines on maps.
The twentieth century was indeed a century of paradoxes, a time when innovation and free markets did accomplish much but could have easily accomplished an order of magnitude more without the rise of the vampiric Welfare States and their overwhelming power to tax and destroy that they promiscuously wielded. Governments vastly expanded their deadly ancient game of plunder and theft on an uber-scale in the past hundred years.
Despite relentless government mucking-about in the markets, investment evolved immensely in the twentieth century. Thanks to innovations in technology, primarily the birth of the Information Age, ordinary people today have infinitely more investment options than even the kings of the nineteenth century. We can all effortlessly move capital globally today with a mere click of the mouse, deploying our funds anywhere on earth that we believe promises a reasonable return for the risk that must be assumed. While the core principles of investing remain as steadfast as they have always been, the tools we use to actually invest and speculate have changed immeasurably.
When we look back and marvel at a century of investing, I think it is very safe to say that the most important metric for investing worldwide proved to be the venerable Dow Jones Industrial Average (DJIA) of the United States of America. While only comprising 30 companies, the DJIA (aka Dow 30 for obvious reasons) proved to be the most important stock index on the planet for most of the twentieth century. The elite blue-chip US corporate leaders inhabiting the index were flagship American companies with enormous resources, vast market-capitalizations, and phenomenal influence and prestige.
Today, as we curiously watch the daily machinations of the Dow 30, it is easy to get trapped in the mental state of believing the status quo is really stable, has always existed, and always will exist. After a couple years of uneventful sideways trading, it can be hard to imagine the Dow 30 at 5000 or 15000, yet history indicates that a Dow 10000 is no more set in stone than any other arbitrary DJIA index level.
As the long-suffering folks who have actually read past Zeal essays know, we believe, for a lot of important fundamental and technical reasons, that the Dow 30 is currently vastly overvalued. In our recent essay, “How Fare Thee DJIA?”, we explored the important issue of potential future Dow 30 performance in depth. In that essay we stated several times that the ultimate bear-market bottom will probably prove to be below 4000 on the index. Nothing has changed in our core analysis since this late October essay, and we still strongly believe that the highest probability for near-future Dow action is for a much lower index level in the coming years. With our own hard-earned speculative capital we remain short the most overvalued of the 30 mighty DJIA component companies.
Rather than zealously attempting to again divine the Dow 30 near-future in this essay, we want to take a gander into the past.
Virtually everyone who invests knows about the 1929 crash of the Dow, the early 1930s depression, and the greatest bull market in history that kicked-off in 1982. Yet, these very important stock market events only encompass a mere fraction of the DJIA action over the last hundred years. What happened before 1929? What happened between 1933 and 1982? Can investors today learn valuable lessons from studying the Century of the Dow?
In this essay we would like to humbly refocus your attention from the future to the past, attempting to absorb a century of daily Dow 30 closing data in context. Perhaps the raw data holds key principles and precious ideas that can be useful to further develop our own strategic investment paradigms as we plunge into the great unknown of the twenty-first century. History seldom fails to titillate and enlighten, and hopefully this little expedition into the past will prove to be no exception. Perhaps the past even contains the golden keys to the future!
Before we begin, there are a couple technical research notes of which you need to be aware.
First, the twentieth century technically began on the first day of 1901 and ended on the last day of 2000 (just like counting from 1 to 100). Since we have more data and it adds a little more depth, we made the decision to append year-to-date 2001 data to our analysis, with Dow 30 daily closes up to and including December 18, 2001. So our “Century of the Dow” for the purposes of this essay is redefined as almost 101 years of daily closes.
Second, various historical price earnings ratios are scattered throughout this essay. The P/E ratios deployed here are NOT specifically Dow 30 P/Es, but the P/E ratios of the US stock markets in general. We used historical broad-market S&P 500 index P/E ratios, and those of its ancestors, below. The reason for the switch is simply because we don’t possess enough specific historical Dow 30 companies’ earnings data to create pure Dow 30 P/E ratios a hundred years old.
While the S&P 500 is a much broader index than the Dow 30, the P/E ratios of the respective indices track surprisingly closely. When stocks are unloved and out-of-favor, P/E ratios on both the Dow 30 and S&P 500 languish. When stocks are highly lusted-after in mania periods, P/E ratios on both the Dow 30 and S&P 500 soar to breathtaking heights.
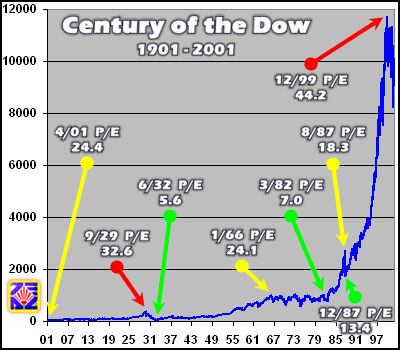
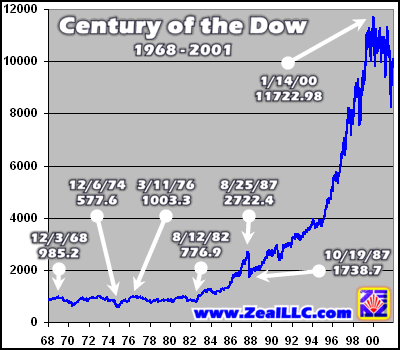
With the research notes and caveats in the bag, our first graph shows the whole enchilada, the Century of the Dow daily closing data. On top of that we have superimposed general US equity P/E ratios for specific months of great historical interest.
The first observation that leaps out of this graph is the near parabolic explosion of the DJIA in the late 1990s. It certainly looks like a bubble, and we believe it is a bubble, as we have documented in many past essays including the above-mentioned “How Fare Thee DJIA?”.
It is crucial, however, to realize that the most important factor for comparability is not absolute point gains, but relative percentage gains. For example, a 500 point single-day move in the DJIA in 1929 would have either wiped it off the face of the earth or almost tripled the index, blissfully sending equity bulls of the time to stock nirvana. A 500 point day on the current 10000 DJIA is hardly even newsworthy though! In order to help visualize the index in constant percentage terms, our next graph included below sports a logarithmic scale.
First, however, much interesting information jumps out of the raw data presented above. Note that both in the early 1900s and in the late 1960s, the general US equity P/E ratio was over 24 times earnings, which is high. Following both instances of rampant overvaluation, the Dow 30 did little exciting for decades, essentially trading sideways waiting for earnings to catch up with stock prices.
In general, a P/E ratio of 13.5 is considered fair value on equities. Why 13.5? There are many reasons.
First and most importantly, profits are EVERYTHING to an equity investor. Nothing else matters over the long run. If you buy a company, the only reason you do it is because you expect it to earn profits, some of which accrue to the fraction of the company you own that you hope will provide a good return on your investment. Over centuries, public companies have had share prices hovering around an average of 13.5 times what they annually earn in profits for their shareholders.
A P/E of 13.5 is considered fair value because that is what the historical average of US equity valuations has been. In centuries of equity investing in the United States and Europe, 13.5 has generally been the mean fair valuation around which markets and individual stocks seem to oscillate over the long-term. A P/E of 13.5 means, not considering compounded returns, that a company you buy will take a little over 13 years to earn profits equal to the entire price you originally paid for the stock.
Intriguingly, if you take 1 divided by 13.5, you end up with 7.4%. 7.4% is a fair return. It was fair historically and it remains fair today. Whether you invest money in a company and its stock yields 7.4%, or whether you pay someone 7.4% to borrow money, the number just feels right. As a thought exercise, imagine if stocks only yielded 1% per year on average? It would feel far too low and wouldn’t be very exciting! What if mortgages cost 22% like credit cards? It would feel far too high, right? 7.4% is neither too low for investors nor too high for borrowers, it is just right. A P/E of 13.5 implies a stock earnings yield of 7.4%.
Provocatively, guess what the average annual historical US Dow 30 return has been?
You are right, 7.4%! From 1901 to 1999, as we documented and graphed in last year’s “Red October” essay, the Dow Jones Industrial Average has had average annual appreciation of 7.4%, through bubbles and busts, feasts and famines! We have not yet factored in 2000’s DJIA performance to the average return, but the impact of a single extra year on a 99-year average will be inconsequential and immaterial.
On a sidenote, the stellar 15%+ annual gains the prominent Wall Street strategists continue to predict for the Dow 30 in the coming years seem even more outrageous when interrogated under the bright lights of historical precedent!
Back to the P/E ratios shown in the graph above, the 24+ P/Es of the early 1900s and the late 1960s, way above the fair value of 13.5, were harbingers of dangerous sideways choppy trading action with little growth for US equity investors. By September 1929, the general US equity P/E had rocketed to 32.6, a stupendous height. Needless to say, the Great Crash of 1929 and the Great Depression soon followed the unsustainable overvaluation extremes.
Then, not too many years later, P/Es plummeted to an abysmal 5.6 in mid-1932, a screaming buy for the stock markets in fundamental terms. While there were other similar fantastic low-valuation fundamental buying opportunities in the century, the greatest occurred in early 1982 when general US equity P/Es reached 7.0. Following that mega-buy signal, the most awesome bull market in history galloped out of the gates, yet it was temporarily interrupted by a curious crash in 1987 when general P/Es had only reached 18.3. Late in 1987, P/Es were driven-down to fair value once again at 13.4 and then a spectacular Dow rocket was lit that accelerated upward parabolically. The rest, as they say, is history.
The apex of the greatest bull market in US history was finally reached at a stunning late 1999 P/E of 44.2, the highest general US equity multiple ever witnessed in the US equity markets. If a stellar P/E of 32.6 heralded the great sell signal before the 1929 crash, the US equity P/Es continuously exceeding 40.0 in late 1999 and early 2000 should have been an even more important glowing radioactive sell signal to abandon the overvalued US equity ship for now.
It is exceedingly pleasing, as we ponder the history of the Century of the Dow, to note that undervaluation and overvaluation in real history proved to be incredibly important and accurate buy and sell signals just as contrarian financial market theory predicts!
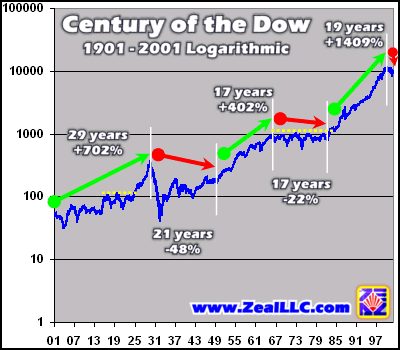
Next, we look at the exact same dataset from the unique perspective of a logarithmic axis. Each horizontal division in the graph shows an order-of-magnitude change, an increase in value of ten times, 1000%. Log scales are useful as they allow us to witness the Dow 30 in constant percentage terms rather than being overwhelmed by the late 1990s explosion that dominates the previous graph.
The bull and bear cycles marked above are totally arbitrary based on the chart and could easily be re-positioned on other starting and ending points. Yet, regardless of how the graph is sliced and diced, there are obviously periods of stellar Dow 30 returns, magnificent rallies, and periods of equally devastating bear markets dominating the last century.
This graph alone should give serious pause to the legions of “buy and hold” investors today. If one buys the DJIA in the early stages of a great bull market, the returns reaped can be magnificent and legendary. Yet, if one deploys capital in the DJIA in the early stages of a great bear market, the losses, both actual capital losses and also opportunity costs on the capital, can be crushing. Caveat Emptor!
It is also quite interesting that the great bull and bear markets seem to approximate roughly 20 years. 20 years of booms followed by 20 years of busts or sideways choppy trading. Another crucial lesson from market history is, even though stock markets generally rise, that they do it in fits and starts. Trading timing within these 20-year cycles is extraordinarily important. An investor who bought the Dow 30 in mid-1949, when US stocks had a P/E of only 9.1, would have had a great 17 years. But an investor who bought in early 1966, when the P/Es had soared to 24.1, would have faced 17 years of the financial equivalent of the trials of Job.
Timing is EVERYTHING, regardless of whether one is a long-term trader or short-term speculator!
History does not pull any punches on this hyper-critical market lesson! The common Wall Street perma-bull buy-and-hold propaganda today that the markets can’t be timed is true in the precise sense, but an absolute lie in the general sense. By carefully monitoring market valuations, the prudent contrarian investor can avoid buying at the top or selling at the bottom like the rest of the crowd.
It is also extremely intriguing to note the tough times that the Dow 30 originally suffered trying to break through big round numbers like 100, 1000, and now 10000. The yellow dashed resistance lines above document the epic struggles at these marks. 100 or 1000 or even 10000 are totally meaningless technically, but they have huge psychological significance since we mortal humans are doing the trading. It took about 8 years from when DJIA 100 was first breached to when it was temporarily left behind in the 1929 bubble and an amazing 26 years in total until it was finally decisively left behind forever in the early 1940s.
Speaking of the early 1940s, remember the popular Wall Street propaganda blitz that heralded the amazing stock market performance after December 7, 1941 following the recent 9/11 Mohammedan attacks on the US? The Wall Street cheerleaders zealously claimed that in the last big US “surprise” attack, on Pearl Harbor in December 1941, the stock market did great afterwards, so therefore, after the September 11, 2001 “surprise” attack, the stock market should also yield stellar performance. Never mind the glaring difficulties with that hastily-forced comparison politically, militarily, or ideologically, as it has still gained great ground amongst the perma-bull faithful in recent months.
One little factor that Wall Street conveniently neglected to tell you in its contrived “surprise attack” comparison, however, was the vast different in P/E ratios. In December 1941, US equities had a general P/E ratio of 10.1, significantly undervalued. In September 2001, the general US equity P/E ratio was a staggering 31.4 before the attacks, almost as overvalued as the 1929 bubble top! It remained amazingly high at 27.7 at the end of September following the attacks.
Curse you Wall Street rogues for continuing to do your very best to mislead American investors to prevent them from protecting their scarce capital from the current equity mania dangers!
Back to round numbers, the Dow almost had as much trouble decisively breaking through 1000 as it did through 100. It took 10 excruciating years from when 1000 was first breached to when it was finally forever left behind. Interestingly, it is even worse under closer examination. The Dow 30 closed above 995 in early 1966, but didn’t finally break free of the 990s for good until late 1982! Talk about long-term buy-and-hold investing for the “patient investor”! 17 years is a LONG time to wait for the first faint whiff of a positive return!
As it took the venerable Dow 30 about 26 years to decisively break through 100 forever, and 17 years to leave 1000 in the dust, why on earth do today’s investors expect 10000 to be an easy nut to crack in only a couple of years?
The Dow Jones Industrial Average first closed above 10000 on March 29, 1999. I remember that epic day well, hearing the news in awe as I rushed through the airports between consulting engagements. Today, almost three years later, the Dow still struggles with 10000, unable to break free from its overwhelming psychological gravity, like a financial-market black hole. The hard lessons of the Century of the Dow suggest that Dow 10000 could take much longer to leave in the dust than the average investor today can imagine!
Roughly 20-year bull/bear cycles, decades of stellar growth followed by decades of stagnation, the tyranny of the round numbers, and the end of the greatest bull market in US history should give the average US investor much to ponder at this moment in time. Yes, the DJIA gains an average of 7.4% per year. Yes, there is a persistent, relentless upward bias due to both technical and business innovation and fiat currency inflation. Yet it still makes an ENORMOUS difference when in time to make strategic buy and sell decisions!
You will feel like a genius as an investor if you catch a mega-bull early when stocks are undervalued and people generally loathe them. Yet, if you buy at the top of a great bull, the Century of the Dow indicates the probability is near certainty that you will have to sadly wait-out decades of negative or sideways returns. Much food for thought!
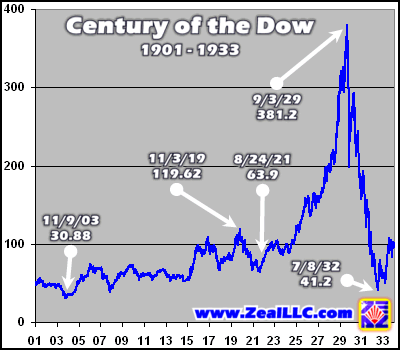
While the strategic snapshots above offer many interesting insights, an even deeper understanding can be gleaned by arbitrarily breaking the Century of the Dow into thirds. Each of the three graphs below covers roughly a third of the data and highlights specific data points of interest. As you peruse the final three graphs, realize how incredibly important timing is, how buy-and-hold is only a valid strategy if your timing is right, and how much valuation really matters in the overall grand scheme of strategic market cycles.
Interestingly, the first 20 years of the new century weren’t all that exciting for the DJIA. If you timed it flawlessly, you could have earned 287% between late 1903 and late 1919, but if your timing was off your returns could have just as easily been relatively dismal over two decades, up only 29% from 1902 to 1921. Almost two decades is a LONG time to wait for a mere 29% return! Not surprisingly, if you were watching valuations at the time, you would have had a real shot at making some good contrarian trades.
In November 1903, marked on the graph above, the US equity P/E was close to fair value at 15.4, a somewhat ambiguous buy signal since there had been no great equity bubble in the previous couple decades, hence no reason to expect terribly undervalued post-bubble bust lows. Conversely, at the November 1919 peak shown above, P/Es had collapsed to only 6.5 as US corporate earnings roared to the heavens. With such dramatically undervalued P/Es, you would NOT have sold the November 1919 peak, even though you would have kicked yourself for it a couple years later in August 1921, when you had a 47% unrealized loss from the 1919 top. By August 1921, P/Es were hovering around 5.2, even more enormously undervalued and a monumental buy signal.
The spectacular ride up the west face of the Great Bubble, whether you hopped aboard in 1919, 1921, or even earlier, was breathtaking, with vast fortunes won. Yet, even in the midst of the mania you did have plenty of warning to exit with P/Es reaching an all-time high to that point in US history of 32.6 in September 1929, many weeks before the Great Crash. As soon as valuations wax extreme and everyone thinks that stock investing is cool, that is the very time to run for the exits. If you then sat around in cash waiting for valuations to once again throw-out a strong buy signal, you probably would have bought within a stone’s throw of the July 1932 bottom, which had an obliterated P/E of only 5.6.
Timing is everything! And valuation matters! If anyone attempts to convince you otherwise, they are either naïve or a liar.
Depending on when you bought in the late 1930s, you either had fairly decent returns or negative returns for a decade or so if you bought the top of the biggest rally. After the 1929 bubble burst and bust, it was a tough, grueling sideways market that rewarded careful prudent contrarian investors and ace stock pickers. The buy-and-hold folks only did OK if they timed the rallies and drops almost perfectly, which is impossible to consistently execute in real-time.
There was a nice run-up after the 1941 Japanese “surprise” attacks, but from a low valuation of 10.1 as we noted above. The word “surprise” is in quotes because socialist President Franklin Roosevelt knew the Japanese attacks were coming. He had even blockaded Japanese oil imports in the foolish hopes that the Japanese would suck the isolationist American populace into World War 2 by attacking the US to force Washington to quit strangling Japan’s vital petroleum supply. The American people were smart enough to avoid the endless wars fought amongst the goofy Europeans just as the great George Washington had cautioned, and it took a contrived “surprise” attack well-anticipated by a socialist dictatorial president with no honor to thrust the US into the Europeans’ brutal Second World War.
Socialist Franklin Roosevelt bashing aside, as important as it is that true history be known in our liberal revisionist world, and back to the Dow 30.
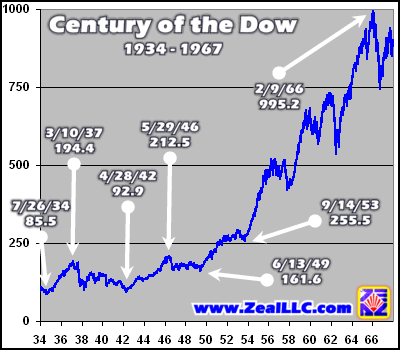
By June 1949 US stocks were once again far undervalued relative to the earnings they could spin-off for their owners with a general P/E of only 9.1. Investors fortunate enough to buy the Dow 30 at this excellent buy signal could have reaped glorious gains in the next major decade-plus great bull market ending in the 1960s.
It is intriguing to note that in each third of the Century of the Dow, the early years proved to be tough and hazardous trading, a contrarian stock-pickers’ paradise, while the later years witnessed mania bubbles that ended in busts or great rallies that ran out of steam and stagnated. The pattern continues below uninterrupted in the final third of the Century of the Dow. A choppy and ugly first half, followed by an exciting second half great bull market.
Once again, early in this latest third of the Century of the Dow, the markets were brutal and tough to trade. Buy-and-hold investors were slaughtered like sheep, their blood ran red through sideways action with a negative bias for roughly 15 years. Then all of a sudden, about halfway through the third of the century, buy-and-hold folks would have made out like kings in another mighty cyclical rally. The enormous explosion in the Dow index since 1982 is the greatest equity rally in US history by far, absolutely glorious.
Of course, not surprisingly, if you were diligently paying attention to P/E ratios in mid-1982, you would have known that stocks were undervalued and ripe for purchase with general P/Es languishing around 6.6 even though the financial media widely lamented that equities were dead. You would have bought out-of-favor stocks when everyone else was busy chasing the last dying bubble at the time, commodities.
You also would not have been tremendously worried through the scary 1987 crash from a fundamental standpoint, as the general US equity P/E fell from only 18.3 before the crash, which is overvalued but nowhere near bubble territory, to a solidly fairly-valued 13.4 after the crash.
Yet, from a pure fundamental standpoint, the 1987 DJIA before the crash had not exploded into extreme bubble territory (say a P/E over 26 or 27, double fair value) so that crucial fact alone would have helped moderate the naked fear felt by fundamental-grounded contrarian investors with nerves and will of steel. With a pre-crash P/E of only 18.3 in the US equity markets, and a fair-valued P/E bottom a few months later, strong contrarian arguments could have been advanced at the time to stay invested which would have enabled investors to ride the greatest bull market in history much higher to its stunning apex.
The monstrous 18-year bull apparently ran out of steam in early 2000 with a stupendous top approaching 12000. As we mentioned above, the P/E of the Dow 30 around that top was far, far higher than the end of the 1920s mania, over an incredible 44x earnings. If this extreme valuation after a parabolic ascent was not a classic sell-and-get-the-heck-out-of-dodge signal, than nothing is!
When the Century of the Dow is laid naked and its great historical lessons are hung-out for the taking, a few critical concepts seem to leap to the top of the data melee.
First, timing is everything. Regardless of whether you are investing for two years or two decades, timing is absolutely crucial. Buying the DJIA at a major top or selling near a major bottom assures that an investor will reap decades of abject misery, with their capital languishing through very real capital losses or equally crushing opportunity costs.
Second, as perfect strategic entry and exit timing is impossible to determine in real-time, an investor can be greatly aided in his or her strategic investment decisions by paying careful attention to valuations. When the Dow 30 reached historic high valuations in the past it has always fallen or languished for decades after. When the Dow 30 reached historic low valuations in the past it has always risen in the following decades. Valuation is the magnificent golden key that helps unlock the otherwise virtually impossible puzzle of real-time strategic entry and exit timing.
Third, as the Century of the Dow proved, stock markets are very cyclical beasts. Yes, they will rise over time because of innovation, economic growth, and inflation, but spectacular bull markets are always followed by equally spectacular bear markets. Just as winter follows summer without any evil connotations, the havoc and destruction the bear wreaks is a necessary and healthy step to eliminate the speculative excesses of the previous bull and lay clean solid foundations for the next great bull. The stock markets, like all markets, oscillate between valuation extremes over decades, from unloved undervalued status to widely lusted-after overvalued status.
With the benefits of the lessons of the Century of the Dow, perhaps the past really is the key to unlocking the future of the markets. All the evidence and historical precedents strongly suggest that the venerable Dow 30 will have to plummet far from current mania valuation extremes down to very low valuations near the pits of psychological despair. If the Dow doesn’t plunge below 4000, as we have predicted in numerous past essays, it will most likely have to trade sideways for decades, waiting for corporate earnings to catch up with valuations.
Either way, diehard buy-and-holders with blind faith in Wall Street propaganda are in big trouble as the Century of the Dow strongly indicates that now is NOT the season to buy.
In closing, while studying market cycles I always believe it is very profitable to ponder the staggering intelligence of the brilliant ancient Israeli King Solomon, whose unparalleled wisdom echoes through the ages from thirty centuries ago but is more relevant today than ever…
“To every thing there is a season, and a time to every purpose under the heaven… a time to keep, and a time to cast away.” – Ecclesiastes 3:1,6b, King Solomon of Israel, ca 1000 BC
Adam Hamilton, CPA December 21, 2001 Subscribe |
|||||||
|
|
|
|
|
|
|
|
|
|
|
|
|
|
|
|||