|
|
|||||||
|
|
|
|
|
|
|
|
|
|
Red October Adam Hamilton September 29, 2000 2974 Words
“To delay action is the same as death.” Vladimir Ilich Lenin, October 22, 1917
October is a strange month. Throughout the annals of history, many landmark events have fallen within the temporal confines of the first full month of autumn. When “Red October” is mentioned, three possible subjects leap to the minds of most people. First, Tom Clancy’s incredible book is remembered. “The Hunt for Red October” is one of the greatest techno-thrillers ever written, and launched a blindingly successful career for Clancy. The book was published in October 1984, and was written in spare time in the evenings by Mr. Clancy, then an insurance salesman. The tale woven in those pages is an amazingly intricate web of plot, suspense, and technical wizardry, and even after repeated readings it never fails to lose its magic and thrill. The novel describes a daring plan by an incredible Russian ballistic missile submarine (boomer) commander, Marko Ramius. Ramius is the best submariner in the Soviet Union, and is commissioned to take the newest Soviet Typhoon class boomer on its maiden blue water voyage for sea trials. The submarine is a technical marvel, and has a radical new propulsion system known as a caterpillar drive. For subs, making noise is lethal, and the caterpillar is a kind of underwater jet engine that runs virtually silently and allows the cavitating propellers of the Typhoon to be shut down, leaving it extremely difficult to detect. Ramius, for various personal reasons, wants to defect to the United States, but he has to covertly inform the US government of his plans, evade the entire Soviet navy, keep the secret from his crew, and somehow pull off an impossible mission. Amazingly, the Pentagon and Department of Defense originally tried to crush Clancy’s debut book, as they felt it contained too much valuable information for US enemies! Incredibly highly recommended reading. The name of this awesome Russian submarine was, of course, “Red October”.
Clancy’s mythical sub was named after a real historical event, the Bolshevik Revolution in Russia in 1917. The opening quote for this essay is from one of the primary architects of the coup, Vladimir Lenin. It is the final sentence of a letter Lenin wrote to his comrades in arms, late one October evening, to encourage them to continue fighting to make the dream of a Marxist state a reality. Lenin successfully usurped the reigns of power in Russia soon after. One of the tools he used to pull off his mission was a portion of the Red Guards loyal to his cause, hence the popular name “Red October” for the “revolution”. An incredible mythology has sprung up around this event, with leftist US colleges and universities falsely claiming this was a great revolt of the working class Russian peasants. In reality, it was a small power hungry group of men filling a vacuum of authority created as Russian institutions decayed following World War I. Although not very bloody itself, this armed insurrection led to the bloodiest regime in the history of the world. Communism is an extremely morally bankrupt philosophy undergirded by naked theft. The plundering of the productive by the unaccountable to give to the nonproductive is the whole basis of this corrupt school of thought. Also known as Marxism, or Socialism in a slightly less virulent form, Communism has been tested empirically all over the world since Red October and has proven a dismal failure every single time it has been attempted. The total body count Communist regimes have racked up trying to silence dissidents is nauseating, and makes Hitler look conservative. Amazingly, the only folks who still believe Communism works are those illicitly enriched by it (in money or power, like Castro) and the ultra-left wing ivory tower Marxist US university professors. Although capitalism has some rough edges, communism has empirically proven to be an utterly bankrupt philosophy, dragging down souls and destroying the masses of humanity. Red October led to the most dangerous form of government the world has ever seen.
Finally, some claim Red October is a colorful description of the worst stock market crash in modern history, October 29, 1929. The relatively new Federal Reserve, which was passed into law mysteriously by a lame duck Congress on Christmas Eve 1913, had created a massive and dangerous credit bubble by running the fiat printing presses 24/7 in the 1920s. Most of the newly created fiat found its way directly into the US equity markets, creating a situation where valuations were comical, historical fundamentals didn’t matter, and everyone was convinced UP was the only direction which the markets could move. The results of this speculative bubble are well known and well documented in history, and ever since that fateful month when massive greed turned into visceral fear, October has always had a spooky feel to it for savvy equity investors. The October bad karma was further reinforced by the mini-crash of October 19, 1987, the largest single day percentage loss in Dow Jones Industrial Average history. In this essay, we will analyze 99 years of DJIA data to see if there is any basis in reality for the ominous feelings generated by October in the hearts and minds of investors.
We will begin with an eagle eye’s view of almost a century of DJIA annual returns…
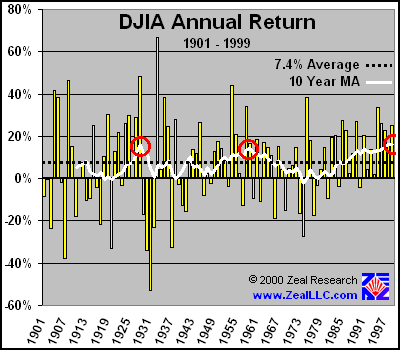
In the last 99 years, the DJIA has averaged an annual return of 7.4%. It is kind of funny to ponder that number, as most investors today, conditioned by our current credit-based speculative bubble, have grown accustomed to annual returns exceeding 40% to 50%. As the graph makes evident, annual returns exceeding a mere 20% are very rare historically for the world’s premier stock index. In addition to the relatively low (by today’s standards) historical average return on blue-chip US equities, the other factor that jumps out of the graph is the ten year moving average of the annual returns (white line). Amazingly, there have only been two other times in the last century when the 10 year MA has approached its current record level (marked by red circles). In the late 1920s, right before the infamous October crash, a brief peak in the MA was attained. This peak was followed by the ugliest bear market in US history, as evidenced by the four years following the peak in the graph being massively negative as the excesses of the 1920s credit bubble were slowly and painfully wrung out of the markets and economy. The second top in the MA occurred in the early 1960s, and it heralded a much slower (but very painful) bear market in US equities that culminated in the 1970s. Each of these first two stellar 10 year MA readings proved harbingers of ugly equity times dead ahead, as significant departures from the average rate of DJIA annual returns were anomalous and inherently unsustainable. Provocatively, the 10 year DJIA MA reached an all-time high at the end of 1999, and 2000 is on course to see the MA execute a turn one eight and head south. In this current MA peak, the 10 year MA has been over the 7.4% average return line for longer than any other period in the last century, indicating the largest average period of excessive returns in modern history needs to be unwound. Historically, once this MA top is reached, it is not seen again for another 30 years or so. Thank goodness the DJIA investors are all conditioned by bubblevision to be “long-term” in focus!
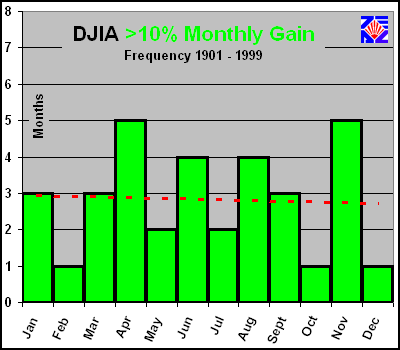
Zooming in and increasing the granularity of our survey, let’s take a look at the frequency of monthly DJIA returns exceeding 10%. For everyone except NASDAQ bubbleonians, a 10% return in a mere 20 trading days is certainly something to write home about! The histogram below shows in what calendar months these large returns have occurred historically for the Dow 30.
Interestingly, the high gain DJIA months are distributed fairly evenly. To clarify the histogram, a reading of 3 for January indicates that, in the last 99 years, the DJIA has seen three months of January that exceeded a 10% monthly gain. The red dashed line is a linear trend of the data, which is virtually flat. From a probability standpoint, this indicates there are no readily apparent historical probabilities indicating mega DJIA up months happening at any particular time during our calendar year. One could attempt to make the case that most of the months with great gains clustered around the beginning and end of summer, but the outlying 5 month frequencies for April and November lessen the effectiveness of this argument. Overall, stellar months seem to be distributed in the calendar year fairly equally, with a possible summer bias. What about big down months?
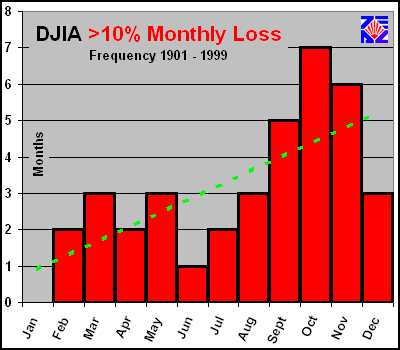
This histogram for months in the DJIA that had losses exceeding 10% is most interesting. The worst calendar month for major losses in the DJIA? Red October. Amazingly, there appears to be a valid reason for the popular feeling that October is the stormiest market month of the calendar year. As we noticed in the previous histogram, there has only been a single October in the last century that actually saw a 10% gain, or 1/7 the total frequency of major down Octobers. Autumn in general is a much more risky time to be in the DJIA, as the green dashed trendline above shows the higher propensity for major monthly losses increasing throughout the year. There is probably some deep-rooted socio-psychological or cultural reason why big monthly sell-offs tend to occur in autumn. Interesting theories abound, from the quasi probable to the “way out there” type of thoughts. For instance, are the autumn selloffs in response to summer rallies? In the months greater than 10% we reviewed above, 10% monthly gains seemed to have the highest probability of clustering around the summer season. On a more radical note, could the October selloffs be the result of deep-seated human subconscious tendencies. For instance, in the northern hemisphere where the DJIA is traded, do people become more pessimistic as the wonderful days of summer end and the daylight begins tapering off into the dark and dreary winter season? There are probably a gazillion good (or at least interesting) theories that can explain the data, but the actual data itself is more important than the theories in this case. Out of all the months of the calendar year, October (and the months surrounding it) have the highest probability of witnessing major selling in the DJIA and a greater than 10% hemorrhaging of the index.
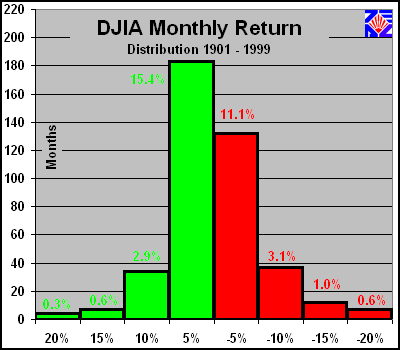
One further histogram of the dataset is in order, as it offers some interesting insights. The histogram below outlines the distribution of monthly returns from the DJIA for the last 99 years. Individual months in the columns are not necessarily mutually exclusive. For instance, a month with a 17% gain would show up in the greater than 5% column, greater than 10% column, AND the greater than 15% column. Each column includes ALL months that exceed the specifications on that column. Also, the percentages shown above the columns do NOT add up to 100%, as they are the percentages of a given type of month occurring out of ALL the months of the DJIA between 1901 and 1999. Here are the results…
As any good statistician will immediately perceive, this histogram is a classical bell curve, which is not surprising. In any large population of data, the individual datum points tend to cluster in this type of physical arrangement. A couple interesting observations emerge from this perspective. First, note the large green greater than 5% monthly gain column. 15% of the months in the last 99 years have seen gains in the DJIA above 5%. Obviously, since recurring monthly 5% gains over a year would equate to an annual gain exceeding 60%, these 5% gain months are usually followed by a loss month, and the net return is equalized over the sample timeframe at the 99 year average annual return rate of 7.4%. With the relentless growth of the fiat money supply since 1913, we would expect to see the DJIA usually higher, to reflect the devastating effects of fiat inflation if nothing else. 5% down months are much more scarce than the 5% up months, weighing in at 11% of the total months. When we study the greater than 10%, greater than 15%, and greater than 20% red monthly loss columns, however, it becomes obvious that the probabilities for these events are significantly higher than for equal and opposite up months. For instance, there is a 1.0% probability of a greater than 15% loss for a given DJIA month. Yet the probability of a greater than 15% gain is only 0.6%, or less than two-thirds the chance of the 15% monthly loss. This same truth holds true with greater than 10% and greater than 20% loss months as well. We are empirically observing the inherent asymmetry in gains and losses. Although one can expect average gains around 7.4% per year, the big loss months, when they rear their ugly heads, tend to be large. Fear is a much, much more powerful emotion than greed, and sell decisions are collectively made orders of magnitude faster than buy decisions. These unbalanced gains and losses underscore the danger of investing in an overvalued market, which tends to regress back to its mean valuation. The first graph we examined above in this essay witnessed the incongruous high levels we are currently seeing in the 10 year moving average DJIA annual return, indicating a regression to much lower mean returns is highly probable.
Will October 2000 be another Red October? No one knows exactly how the dominos will fall, but October should prove exciting. The DJIA is still trading at very high valuation levels, with the market capitalization weighted average price earnings ratio for the index weighing in at a hefty 34.0x at the end of September. The historical average, for comparison, is around 13.5x earnings. The US equity markets are very jittery, and there is virtually no conceivable good news that could boost the entire market. Earnings warnings are coming in fast and furiously, and even blue chip tech companies like Intel (proud Dow component since November 1999) are not immune from massive and instant losses due to lowered expectations. Companies with reputations for very aggressive and radical accounting, like Priceline.com, have been ravaged even more when they lower expectations. The big fellas with their own money on the line are looking for any reason to sell, not to buy. Little guys are still throwing billions of dollars at their mutual funds, but these market inflows will dwindle as all the indexes continue to break. There WILL be some nervous hand wringing when mutual fund owners receive their Q3 statements! Oil is a HUGE factor that’s importance cannot be easily exaggerated. The bubblevision pundits who are loudly proclaiming that oil is just not very important in our modern economy anymore are badly mistaken, and they will be proven wrong this winter. For Zeal Intelligence subscribers, the October issue of ZI explores the current oil situation in depth.
Everywhere we look there are massive negatives for equities on the horizon, negatives so big they would even weigh on an UNDERVALUED equity market. Their net gravity on our current OVERVALUED equity markets is likely to be irresistible. Some claim, being an election year, that the Plunge Protection Team (the official name for Clinton’s market manipulation squad is the “Working Group on Financial Markets” … please see the Washington Post expose from February 23, 1997 for more information) will step in to prop up the market so the self proclaimed inventor of the Internet and founder of the Strategic Petroleum Reserve, Al Gore (what a guy!), can ride the socialist coattails of the most scandal ridden President in US history. For those who still believe in Santa Claus, the tooth fairy, and that the US government doesn’t manipulate the free markets, please research the blatant central-planning Communist style “intervention” in the Euro and oil markets on Friday September 22 by the present Administration. Market manipulation unfortunately DOES happen, even in a free society. Even though the Working Group on Financial Markets is likely to try and prop up the US markets next month, they will be fighting a maelstrom. MANY, MANY critical US blue chip stocks are STILL priced to perfection, and any small deviation from optimal expectations could see more massive hits like the recent Intel, Eastman Kodak, Priceline, and Apple eviscerations. Markets do not like being manipulated, and, if folks decide to sell and protect their capital until after the election, NO amount of government capital injections will stave off the selling pressure. October WILL be volatile, and a moderate to big down month would not be surprising.
Are you girding your portfolio for another possible Red October? If there are ANY nonlinear disruptions to the market in October, Lenin’s quote we used in opening is most appropriate for investors. Investors in overvalued, high P/E market darlings are playing an extremely dangerous game, and their bluff could be called any minute. October is FAMOUS for barbecuing bulls, yielding nice rich sirloin steaks for the prudent bears. Those with gold in their portfolios, however, will sleep soundly through what is likely to be an extremely turbulent and chaotic October. Gold is STILL the most undervalued asset class in the world, and is trading well below true value from virtually every possible valuation perspective. The smart money is waiting out the coming tumult in a golden fortress. Those nervously biding their time in overvalued equities, like Lenin’s revolutionaries, may as well be executed now, as their indecisiveness and inactivity will burn up any time or hope for procuring safe harbor in the coming financial storms.
Don’t be caught in the bloodbath of a neo-Red October!
Adam Hamilton, CPA September 29, 2000 |
|||||||
|
|
|
|
|
|
|
|
|
|
|
|
|
|
|
|||


