|
|
|||||||
|
|
|
|
|
|
|
|
|
|
|
|
|
|
|
|
|
|
|
JPM Derivatives Monster Grows Adam Hamilton January 4, 2002 4461 Words
A long time ago in a galaxy far away, or it least it seems that way, I hammered-out an essay on derivatives powerhouse US superbank JPMorganChase. In my original essay, delicately titled “The JPM Derivatives Monster”, I outlined some incredible research my research group had performed investigating the gargantuan derivatives dominance of elite Dow 30 money-center bank JPMorganChase (JPM-NYSE).
The essay was, fortunately or unfortunately depending on one’s perspective, published the Friday before the horrific September 11 attacks. Needless to say, the arcane and often confusing world of derivatives was all of a sudden infinitely less important than coping with the grisly and heart-wrenching aftermath of the notorious terrorist attacks on America.
Even rightfully relegated far beneath the long dark shadow of the tragedy, and even though the essay tipped the scales at almost 7500 words, it drew over a hundred-thousand hits and hundreds of comments from all over the planet. I was personally very surprised by the popularity of the original complex JPM Derivatives Monster essay because derivatives themselves are so difficult to understand and I assumed that derivatives were pretty low in significance on most investors’ radars and worldviews. Regardless, the huge response to the essay from almost two-dozen countries as far away as Germany, Switzerland, Russia, China, and Singapore has been overwhelming.
The original essay showcased data that JPM is required by law to report to both the United States Office of the Comptroller of the Currency and the United States Securities and Exchange Commission. In early September, the most current data available on the derivatives positions of US banks was still from the first quarter of 2001. Today, Q3 2001 official OCC derivatives data is available and not too far into the future the Q4 2001 derivatives report will be posted by the OCC.
This essay is simply an update of the original “The JPM Derivatives Monster” essay. If you have read and understood that earlier work you will gain far more out of this essay. I try to write the vast majority of my weekly Internet essays as stand-alone and self-contained essays, but this one is atypical. I am assuming that you command the basic background and knowledge of derivatives articulated in the earlier JPM Derivatives Monster essay (henceforth called “Monster”). Certainly, if you have questions on definitions, concepts, research, data origins, the data deployed here, etc, the first place to go look is the September essay.
Before we begin this round, an important disclaimer is in order. When I penned the earlier Monster essay, my partners and I had absolutely zero exposure to or stakes in JPM, either long or short. After we completed the work and research behind the original Monster essay however, we were so astonished that my partners and I both bet against JPM with our own capital and recommended JPM short positions and JPM put options to our private consulting clients and our Zeal Intelligence private newsletter subscribers.
We strongly believe that it is dishonorable to discuss a company without fully disclosing long or short exposure up front so everyone understands from where we are coming. Some folks will be uncomfortable with our JPM short positions, which is great and not a problem, and I strongly encourage you to read no further if this disclosure sends up red flags in your mind. Still other folks are more comfortable knowing that “our money is where our mouths are”, so to speak. It is crucial that we all begin on the same page. On to the battle!
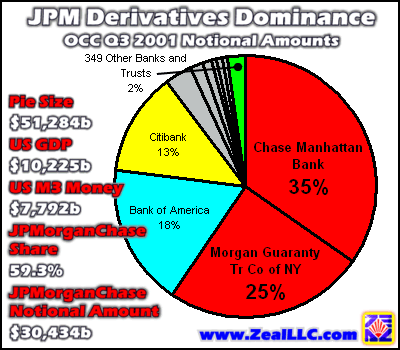
Our first graph is a direct update from Monster. Derivatives data used here is from the official Q3 2001 “OCC Bank Derivatives Report”, “Table 1”. Since the numbers shown below are so mind-blowing that they utterly defy belief, I strongly encourage you to go download the original PDF file and see the huge derivatives pyramid with your own eyes at http://www.occ.treas.gov/deriv/deriv.htm (specifically the file is at http://www.occ.treas.gov/ftp/deriv/dq301.pdf). Please don’t just take our word for it! ALWAYS do your own due diligence!
Amazingly, the total derivatives positions held in terms of notional amounts by US banks literally exploded in the six months between the Q1 and Q3 reports. The US banks ramped up their derivatives positions by an absolute 16.8% in a mere six months, or $7,362b (yes, that is seven thousand BILLION, or over seven TRILLION dollars). For comparison the US GDP was only up an anemic 0.8% over the same six months. The exploding broad US M3 money supply that Greenspan is frantically pumping like there is no tomorrow in his daring Greenspan Gambit is “only” up 5.1% over the same period. Any way you slice it, the piling-on of over $7t of additional derivatives exposure in six months is quite extraordinary.
JPM’s share of the US banks’ titanic derivatives pie crumbled slightly over six months from 59.8% in Q1 to 59.3% in Q3. Lest the 2,781 large institutional investors that are holding 62.5% of JPM’s outstanding shares on behalf of their clients think that JPM’s hyper-risky derivatives positions are abating however, in absolute terms JPM’s derivatives exposure rocketed by $4,158b, or 15.8% to $30,434b in six short months. To put a massive $4t+ increase in notional derivatives amounts into perspective, the total broad US M3 money supply only crossed $4t for the first time in United States history in July of 1989! $4t is BIG bucks folks!
Now JPM is a big bank, indeed the flagship US money-center bank, but the derivatives pyramid the Dow 30 behemoth has created is even gargantuan by its giant standards. Per JPM’s Q3 earnings release, it commanded $799b in assets and $43b in stockholders’ equity on September 30, 2001. (Per the official Q3 OCC report, the portions of JPM that deal in derivatives only had assets of $663b, but we will grant JPM the benefit of the doubt and use the larger asset number that it reported to the public.)
In terms of total assets, JPM has implied derivatives leverage of 38 times ($30,434b notional derivatives divided by $799b in assets), a big number. In other words, each $1 of assets controlled by the uber-bank supports outstanding derivatives contracts with notional values of $38.
For a commercial bank like JPM however, asset size can be a misleading measure. Most of any bank’s assets, including JPM’s, are offset by matching liabilities of the same magnitude. For instance, when you deposit money in a bank those funds are really yours even though you are letting the bank temporarily use them. A $100k deposit that you make to a bank account becomes an asset for the bank that can be lent out but it is offset by an equal $100k liability to you. Depending on what kind of contract you have signed with your bank, Demand Checking versus Certificates of Deposit for instance, you can often demand your money from the bank at any time.
Of JPM’s $756b in liabilities at the end of Q3, only $47b were classified as long-term debt which means they are due further-out than one year into the future. That leaves roughly $709b of short-term liabilities, amounts that are due in the next 12 months. Of course the vast majority of these liabilities will be rolled-over or replaced by newer liabilities, but the huge amounts of current debt still give a general idea of the short-term and potentially ethereal nature of JPM’s assets.
What really matters is JPM’s stockholders’ equity, which contains all the capital that JPM stockholders own free and clear, both funds that they have contributed and total profits earned and retained in the entire long and distinguished corporate histories of JP Morgan and Chase Manhattan. After the liabilities are subtracted from the assets, JPM shareholders only own roughly $43b (exactly $42.735b) in equity.
Ominously, this relatively small equity capital balance is supporting a crushing inverted derivatives pyramid weighing a colossal $30,434b! $30,434b of notional value derivatives controlled by JPM divided by its shareholders’ equity of $42.735b (note this is a decimal-point in the equity number, NOT a comma as in the derivatives number) yields a simply unfathomable implied leverage of derivatives to equity of 712 times! “Holy cow!” as they say in the American Midwest.
Every single dollar of hard-won JPM equity ever contributed or retained is supporting a breathtaking $712 in derivatives side-bets! 712x implied leverage!! Old John Pierpont Morgan (1837-1913) is probably rolling-over in his grave, as he was a far more conservative financier, industrialist, and deal-maker, not a pure financial speculator or hedge fund manager!
This implied derivatives leverage on equity has increased dramatically in the six short months since the Monster essay, when it was “only” 626 to 1. The vast JPM inverted derivatives pyramid continues to balloon ever larger, even through the absolutely unforeseen extreme market turbulence of September 2001!
The inverted pyramid mental picture is a great way to visualize this breathtaking leverage. Imagine Egypt’s Great Pyramid of Giza miraculously inverted and stood-up balanced on its apex. The relatively small point of stone pressing into the ground would have to support millions of tons of stones above it (an estimated five or six million tons), an exceedingly difficult task. Even if the apex of such an inverted pyramid was constructed from some unbelievably strong cutting-edge space-age composite that could support the crushing weight, an inverted balanced pyramid is still very precarious and dangerous.
For example, what happens if a mighty sandstorm roars out of the desert? The wind-loading forces coupled with pelting sand exerting lateral pressure on one or two sides of the inverted Great Pyramid would be enormous, the whole pyramid would act like a great sail. It would be virtually impossible to keep the pyramid delicately balanced on its apex unless the sandstorm was anticipated well in advance and appropriate reinforcement countermeasures were deployed before it hit. This is probably why you have never seen a medium or large building engineered to look like an INVERTED pyramid, the top-heavy design is simply far too unstable. Relatively small outside forces acting upon it are magnified tremendously by the leverage between the broad high top of the inverted pyramid and its narrow pointy base.
For those dabbling in derivatives, making linear assumptions in a non-linear world can be lethal!
While JPM and two of its money-center superbank peers, Bank of America and Citibank, now together control a staggering 89.6% of the total US banks’ derivatives markets, 359 commercial banks reported dabbling in derivatives to the OCC in Q3 2001. In a provocative statistic, this number dropped dramatically by 9% from the 395 commercial banks playing this same game six months ago in Q1. As more and more banks begin to comprehend the enormous hazards of playing around in the unforgiving derivatives markets, more and more are shedding their derivatives portfolios entirely to greatly reduce the overall risk to their scarce and valuable capital. As fewer banks risk their shareholders’ and depositors’ capital in this merciless speculator’s game, the concentration of the market in only a few mega-banks’ hands will no doubt grow more extreme.
Also provocatively, it is exceedingly interesting to note that derivatives exposures of this magnitude have never before weathered the violent and unpredictable financial storms of mighty secular bear markets. Derivatives essentially began growing in significance in the 1970s and 1980s, and every investor knows that the greatest bull market in US history ran from 1982-2000 (see “Century of the Dow”). How will the massive inverted derivatives pyramids fare in brutal and unforgiving bear market environments? Only time will tell.
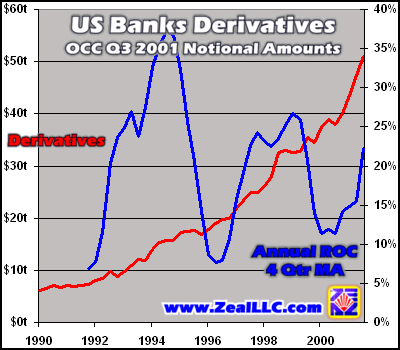
Our next graph is also from official OCC data and documents the banks’ total derivatives exposure in notional terms through the 1990s to Q3 2001.
The red line below is the US banks’ total notional derivatives exposure on a quarterly basis. The blue line is the four-quarter moving average of the annual absolute rate of growth in the total US banks’ derivatives holdings. For example, to get the Q4 2000 data point the Q4 1999 total notional amount is subtracted from Q4 2000’s, and the difference is divided by Q4 1999 to determine the absolute year-over-year growth rate for each quarter. The four-quarter moving average of this quotient is the blue line shown below, representing the annual growth rate in banks’ derivatives exposure.
The US banks’ derivatives holdings literally exploded in the 1990s, up over 721% from Q1 1990 to Q3 2001 to the current unbelievable $51 trillion with a “t”. Before we actually built this graph, we had assumed that derivatives were growing at an unprecedented annual rate as the last couple quarters witnessed the explosive 16.8% absolute growth in six short months. Very surprisingly however, as the blue four-quarter moving average annual growth line shows above, periods of 20%+ annual derivatives growth were not uncommon in the 1990s.
The mean level of the blue line throughout the whole graph is 20.2%, surprisingly high at least to us. From Q3 2000 to Q3 2001, the latest available data, US banks’ derivatives holdings grew by an absolute 34.3% (not moving-averaged), which IS high. This stellar rate of growth is obviously unsustainable! Using some quick shooting-from-the-hip math and the old “Rule of 72”, a 34% annually compounded return doubles in a little over every two years. If US banks are to control a staggering $100t of derivatives by Q4 2003, the graph above will have to shoot parabolic, looking just like the classic NASDAQ bubble graph.
One would think that sooner or later every possible business in the world that could possibly use an interest-rate swap, currency swap, or any other kind of derivatives contract would have already deployed them! Clearly current growth rates in US banks’ derivatives exposures will have to abate significantly in the coming years.
Another interesting point to ponder in the graph above is that the two steepest slopes in the last six years of the red derivatives line, indicating the fastest growth, occurred during financial crises. In other words, during episodes of severe market turbulence, US banks increased their rate of derivatives growth dramatically. Note the current very steep slope ending in Q3 2001, the quarter of the diabolical September 11th attacks and subsequent extreme market volatility, and also the very steep portion in late 1998 near the Russian Debt Crisis which caused unforeseen volatility that obliterated elite derivatives-laden hedge-fund Long-Term Capital Management. It appears that whenever sandstorms roar over the horizon to buffet the inverted derivatives pyramid, that rather than prudently reducing exposure US banks simply pile and hang more derivatives onto the windward side of the inverted pyramid to attempt to stay balanced. Not an encouraging practice!
Interestingly, the current Q3 2001 year-over-year derivatives growth rate of 34.3% is the highest witnessed since Q4 1998’s 31.6% and Q3 1998’s 30%, all near serious market crises!
As I discussed in Monster, the vast majority of US banks’ derivatives outstanding are interest-rate derivatives. This didn’t change in the latest Q3 OCC data. In the Comptroller of the Currency’s “Table 3”, it claims that of all US banks’ outstanding derivatives, a staggering 84.1% are interest-rate derivatives. Chase Manhattan and JP Morgan, the two proud spouses in JPMorganChase, report that 86.2% and 86.9% of their outstanding derivatives contracts are interest-rate derivatives, respectively. All together, JPM has at least $20,701b of exposure in notional value terms to interest-rate derivatives contracts (“Table 8”). This is 484 times JPM’s total shareholders’ equity, hyper-extreme interest-rate derivatives leverage!
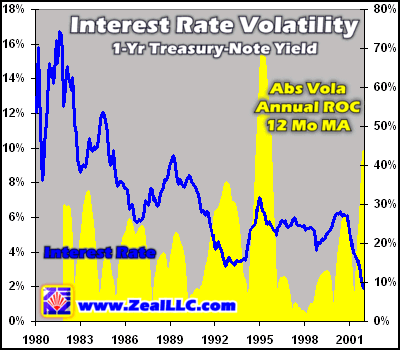
As interest-rate swaps and other interest-rate derivatives contracts are the biggest derivatives game in town for the mega-banks by far, we decided to look at interest-rate volatility over the last 20 years or so. Everything else being equal, higher interest-rate volatilities are the equivalent of the sandstorm-driven wind-loads on our inverted Great Pyramid of Giza we mentioned above. Extreme interest-rate volatility should cause great concern for the derivatives departments of the banks attempting to balance these great inverted pyramids of derivatives.
The blue line in the graph below is the one-year constant maturity Treasury-Note yield, monthly data direct from the Federal Reserve. The yellow columns represent volatility in these interest rates. They are calculated each month as the year-over-year absolute value of the change in interest rates in percentage terms. (For example, the December 2000 1-Year T-Note yield less the December 1999 1-Year T-Note yield divided by the December 1999 yield, absolutely valued.) The resulting quotients are then smoothed through a 12-month moving average yielding the yellow blobbish-columns shown below. A change of interest rates from 3% to 4% ((4-3)/3) is considered 33% volatility in this graph, as is a change from 9% to 12% ((12-9)/9), which also equals 33%.
Interestingly, the current 12-month moving average of absolute interest-rate volatility in the midst of Greenspan’s frantic interest-rate-slashing extravaganza is currently running about 44%, the second highest spike in two decades. Not moving-averaged, December 2001 witnessed annual interest-rate volatility of 66%, extraordinarily high. The average absolute interest-rate volatility over the last 20 years or so was only about 17.8%. The last time interest-rate volatility was higher was during the mid-1990s as the Fed cranked interest rates back up after fighting the customary early-decade US recession.
In Q4 1995, near the last great interest-rate volatility spike, there were 558 US banks playing the derivatives game. Today there are 36% fewer banks left in this rough-and-tumble and unforgiving arena. Back then there were about $11,095b of interest-rate derivatives contracts outstanding in notional terms. Today that number has skyrocketed to $33,496b (“Table 8”), a stunning 202% increase in not very many years. Can US banks balancing an enormous inverted derivatives pyramid worth over $33 TRILLION weather this current sandstorm of very high interest-rate volatility? The answer remains to be seen.
On another derivatives front, JPM is a defendant in Reginald Howe’s landmark case filed in federal court alleging active official and money-center bank suppression of the global gold price. Gold investors will be very interested to know that JPM’s total gold derivatives exposure in notional terms has plummeted from $57b in Q1 2001, right after the Howe case was filed (when JPM controlled 68% of all US banks’ gold derivatives contracts), to $37b in Q3 (“Table 9” in the OCC report, JPM now controls 55% of all US banks’ outstanding gold derivatives contracts), a stunning 35% drop in six short months! There are at least a few potential interpretations that can be advanced here, although there are no guarantees that any of the following theories is correct.
First, gold derivatives demand may be shrinking and the market growing less profitable, so JPM chose to begin making an exit due to normal market conditions. This is the simplest explanation, but it ignores a lot of critical gold market data and assumes that there are colossal chance coincidences. The longer I have observed and traded the markets throughout my life, the less I believe in coincidences. Markets are giant complex and intricate tapestries of exquisite cause and effect. A small ripple from a stone tossed into one corner of the great global financial market pond can quickly spread to and cause chaos in other far-off market areas that few people would have anticipated.
Second, JPM is well aware of the mega-bullish fundamentals for gold, including the enormous annual mined-supply and global demand deficit, the collapsing gold-carry-trade profits, the vastly overvalued US dollar, and the dangerous and vicious bear markets in US equities. If JPM expects the gold markets to soon grow much more volatile as central banks run out of both gold to lend and willing gold borrowers, it would make perfect sense for JPM to cut its huge gold derivatives exposure and risk before the coming gold sandstorms strike. Remember, unforeseen volatility is the bane of derivatives contracts’ existence and can prove lethal, and JPM STILL has gold derivatives exposure equal to 87% of every dollar of its stockholder’s equity, extraordinarily high!
Third, JPM could be stunned by Reginald Howe’s amazingly well-crafted case and can’t believe that Federal Judge Lindsay hasn’t thrown it out yet. JPM may see a potential discovery phase hurtling down the pike like a malevolent juggernaut and it wants to exit the gold market as soon as possible in an attempt to avoid a brewing legal firestorm and monumental scandal if the gold-manipulation scheme breaks public for mainstream Americans. Vacating the gold derivatives trade before it has Howe’s highly-motivated and tenacious Discovery Team pouring over JPM’s private gold-trading records wouldn’t be a bad idea at all.
There are also other intriguing theories which exist on the drastic drop in JPM’s gold derivatives exposure, many of which Bill Murphy has wonderfully articulated in his awesome and highly-recommended members-only contrarian-investment website www.LeMetropoleCafe.com.
The vast derivatives mysteries continue to perpetually fascinate and titillate, defying logic and creating many more new enigmas that need investigating.
As I wrote back in the original Monster essay, I am still just as flabbergasted today that big institutional investors, who have a sacred fiduciary duty to zealously protect the hard-earned capital entrusted to them by their precious clients, would risk their clients’ scarce capital by investing in JPM, not just a Dow 30 superbank but the biggest inverted derivatives pyramid in world history!
A “bank” with $712 of derivatives exposure for every $1 in stockholders’ capital, in my humble opinion, is no longer a bank but a de-facto hedge fund.
Now hedge funds are great and perform a very valuable market service to sophisticated professional speculators with lots of capital, but a hedge fund is NOT the place to park crucial retirement investments or college tuition capital! Hedge funds are ultra-risky speculation vehicles for the elite that specialize in making very large and risky bets. If JPM is in reality more like a hedge fund than a classic bank, both retail and institutional investors alike carefully need to reconsider their JPM exposure. I wrote in the earlier Monster essay…
“In financial circles 10 to 1 leverage is considered very aggressive, 100 to 1 is considered to be in the kamikaze realm, but we don’t ever recall hearing about large-scale leveraged operations exceeding 100 to 1 outside of the horrible example of the doomed super hedge fund Long Term Capital Management. JPM’s management may have effectively created the most leveraged large hedge fund in the history of the world by using $42b worth of shareholders’ equity to control derivatives representing a notional value of a staggering $26,276b.”
Please note that the numbers in this quote are from the Q1 OCC report, and are far worse now as we noted above! As I mentioned in Monster, the doomed LTCM had an inverted derivatives pyramid of an estimated $1,250b supported by only $3b in owners’ capital for an extreme implied leverage ratio of 417 to 1. JPM’s implied derivatives-to-equity ratio was sitting at 712 to 1 at the end of Q3 2001, a staggering number beyond comprehension!
The danger with hyper-extreme leverage is that even a relatively small unexpected increase in volatility slamming into the inverted derivatives pyramid on the wrong side, a moderate sandstorm, can cause crushing losses at the apex of the pyramid, the capital base of the speculating bank wielding the hyper-leverage. For example, a 1% fluctuation in a market price is not a big deal on any given day, it happens all the time. Yet, with even a “mere” 100 to 1 leverage, a 1% price move in the wrong direction can totally wipe-out the underlying capital. If you have $1k in capital but control a long bet worth $100k, even a trivial $1k price drop to $99k obliterates you. Hyper-leverage is playing with fire!
It doesn’t matter how intelligent the folks are that are managing these gargantuan derivatives pyramids. They are probably brilliant rocket-scientist types, the best in the world. Yet Long-Term Capital Management also had brilliant rocket-scientists running it too, some of the brightest financial minds that ever lived. Even with that unparalleled brainpower, the mighty LTCM was annihilated by a relatively small unforeseen market event, the Russian Debt Default, that completely blew-up its fragile inverted derivatives pyramid portfolio.
In addition, even the most brilliant market players in the world make mistakes. JPM issued an official press release on December 19th that claimed it had $2.6b in loans and other exposure to financial-disaster-du-jour Enron! Initially, JPM had “only” reported $0.9b of exposure to Enron. $1.7b more is a BIG difference. JPM also reported that it had at least $0.9b in exposure to Argentina at the end of Q3. JPM might not lose all the money it is owed by Enron and Argentina, but if it does that is a staggering $3.5b!
For comparison, realize that JPM reported that it earned $5.7b last year in its annual report. If the Enron and Argentina loans alone were to go bad, that is a potential 61% haircut in 2001 earnings with only two deals that went sour! The point is not that JPM did anything wrong in loaning money to Enron and Argentina, just that even the best of the best cannot foresee some market events which can turn around and painfully bite them.
The more that I ponder JPM’s utter dominance of the US banks’ derivatives markets, the more amazed I become that more professional institutional investors and analysts aren’t at least a little concerned that the unprecedented Morgan House of Derivatives may be far overextended. I am also amazed, especially after the exceptionally ugly Enron implosion, that the OCC and other Federal regulators are apparently not at all concerned about a single company somehow juggling an exceedingly tangled web of derivatives worth over $30 trillion in notional value terms. Talk about systemic risk!
Regardless of how well JPM has balanced its enormous inverted derivatives pyramid on top of its comparably infinitesimally-small capital base, in these chaotic markets of today I can’t help but thinking that unforeseen sandstorms are brewing on the horizons that will place tremendous and unexpected wind-loads on JPM’s fragile derivatives positions. Hopefully JPM’s inverted derivatives pyramid will not crumble and fall to the earth, as the consequences of such an event for the US financial system could be dreadful.
Adam Hamilton, CPA January 4, 2002 Subscribe |
|||||||
|
|
|
|
|
|
|
|
|
|
|
|
|
|
|
|||