|
|
|||||||
|
|
|
|
|
|
|
|
|
|
|
|
|
|
|
|
|
|
|
The JPM Derivatives Monster Adam Hamilton September 7, 2001 7412 Words
Out of all the incredible financial developments of the 1990s, one of the most important fundamental structural changes in the nature of the operation and interaction of the global financial system was the literal explosion of the use of derivatives.
Derivatives are often highly complex financial instruments that “derive” their value from some other underlying asset. As the use of these instruments evolved and advanced to a stunning degree in the 1990s, an intriguing bifurcation of opinion on the merits of the hybrid instruments developed. Among the Wall Street power players and aggressive private speculators, derivatives were seen as a wonderful financial innovation that would lead to highly customizable risk management and a huge new profit stream for Wall Street.
Outside of the financial halls of power, however, derivatives began to acquire a reputation of being staggeringly risky financial instruments that could turn sour in a heartbeat and devour the financial wizards who created them like hungry sharks. Like the young sorcerer’s apprentice in Walt Disney’s classic 1940 masterpiece “Fantasia”, a general public perception of derivatives gradually evolved that perceived the growth of derivatives as a dangerous experiment being recklessly played out in the financial world. Like the sorcerer’s apprentice dabbling in powerful magic when the master was not around to manage the unleashed forces, derivatives creation was increasingly seen by the average investor as being hazardous attempts to harness enormous financial tides and forces that were simply too big and too complex to be decisively tamed.
A string of massive derivatives debacles in the 1990s helped buttress this negative popular perception of derivatives and provided strong support for the “derivatives are very dangerous” side of the great derivatives debate.
In December 1993 the large German industrial conglomerate Metallgesellschaft AG reported huge derivates related losses racked up by its US subsidiary. Through an intricate hedging strategy involving heavy energy derivatives use that spun out of control, the US subsidiary of the German giant watched in horror as its complex custom-tailored financial instruments exploded in unforeseen market conditions. Total losses were originally estimated at $1b, enough to push Metallgesellschaft, Germany’s fourteenth largest industrial corporation, to the brink of bankruptcy. Metallgesellschaft eventually had to cough up $1.9b as a last-ditch rescue package to stave off bankruptcy. What was perhaps the first well-known large derivatives debacle in the 1990s was only a grim taste of things to come.
Unfortunately, the misfortune of Metallgesellschaft in attempting to conquer the brave new derivatives world proved to be only the tip of the iceberg in derivatives disasters of the 1990s. Cargill lost $100m playing with mortgage derivatives, Askin Securities lost $600m dabbling in mortgage-backed securities, US blue-chip Dow 30 company Procter & Gamble lost $157m hedging with currency derivatives, and Codelco Chile obliterated $200m on copper and precious metals futures. We could add Daiwa Bank of Japan, Sumitomo Corporation, Ashanti Goldfields, and the list goes on and on. And these are just a few of the less well-known derivatives debacles!
In 1994 the County Treasurer of one of the wealthiest counties in the United States, Orange County, California, brought the mighty county to its knees in bankruptcy. Robert Citron deployed risky exotic derivatives including reverse repurchase agreements to produce very high returns for the County Investment Pool he managed. Unfortunately, when the markets moved against his huge leveraged positions, the retirement funds under his custodianship quickly hemorrhaged $1.5b. In a hearing before the California State Senate in 1995, Citron said, “I must humbly state I certainly was not as sophisticated a treasurer as I thought I was.”
In February 1995 the proud and strong 223 year-old Barings Investment Bank of England, which even counted Queen Elizabeth as a client, was annihilated by unauthorized derivatives trading activity that imploded as the markets did not move as planned. Nicholas William Leeson, a 27-year old hotshot derivatives trader based in Singapore, managed to quickly lose $1.3b in the highly leveraged derivatives market before Barings’ management in London realized what was happening.
Rogue trader Nick Leeson was betting heavily on the future direction of the Japanese blue-chip Nikkei stock index using common options. He placed hundreds of millions of dollars at risk on the premise that the Nikkei was due for a major recovery in 1995. As we all know today as we watch the embattled Nikkei index rip through 17 year lows like a meteorite through a circus tent, Nick Leeson made the wrong bet. His personal derivatives debacle was so extreme that it killed the proud Barings Bank. Barings had been around for centuries and had even helped finance the rise of the great British Empire in the 19th century. A respected, conservative monolith of a British institution died at the hands of powerful and inherently uncontrollable forces unleashed by a young sorcerer’s apprentice halfway around the world in Singapore.
Derivatives disasters continued to blossom around the world like isolated mushroom clouds in the late 1990s, with the most memorable and dangerous being the catastrophic Long Term Capital Management debacle in 1998 on the heels of the Russian Debt Crisis, which we discuss further later in this essay. In light of the frightening record of the enormous risks and leverage of derivatives humbling the mighty in the 1990s, it is no surprise that most people today rightfully believe that derivatives are a highly risky and unforgiving high-stakes game.
As derivatives use continues to explode around the globe, it is prudent for investors to closely monitor derivatives and the companies dealing in them. The markets, if they have taught us anything in this chaotic past year, have certainly reinforced the historical truism that they are as unpredictable as ever over the short-term. Major discontinuities in price and unforeseen volatility events can erupt at any moment, potentially putting unfathomable structural stress on highly-leveraged derivatives portfolios.
As we plunge through the early years of our new millennium, any study of derivates in the United States among leading blue-chip financial institutions inevitably leads to one conclusion. Virtually all paths of derivatives inquiry lead to the same destination. Today, more than ever before in the short history of derivatives, one leading United States institution effectively IS the derivatives market. This company, as we will explore in this essay, is the American giant superbank JPMorganChase (www.JPMorganChase.com).
Before we begin our exploration of JPMorganChase’s (JPM-NYSE) mind-boggling exposure to the high-leverage high-risk global derivatives market, a quick and dirty explanation of derivatives is in order.
As we mentioned above, derivatives are simply financial instruments that derive their value from some other underlying asset. The term “asset” is employed rather loosely here, as in the derivatives world it can also include interest rates, currency exchange rates, stock indices, and other market indices. Common examples of derivatives include options, futures, forwards, swaps, and various combinations of these instruments.
The humble option is one of the simplest forms of derivatives. An option is simply the right to buy (call) or sell (put) a certain investment at a contractually set price for a limited time in the future. Options are also used as building blocks to assemble much more complex highly exotic derivatives instruments, kind of like the financial equivalent of the toy Lego blocks perpetually popular with children. Options are a fantastic tool to help comprehend and understand the enormous leverage inherent in derivatives and the huge risks that are shouldered when trading them. In order to wrap our minds around options, it is best to start our illustration with normal equity investing and then move to simple lone options.
Imagine you have saved up $5,000 of risk capital you want to sow into the markets in the hopes of reaping some profits. The conventional stock investing strategy is simply to find some undervalued stock and buy it. You do your due diligence, find an undervalued stock trading at a fair multiple with good future prospects, and you buy your shares of the company. For this example’s sake, let’s assume that your investment in “XYZ Company” was made at a share price of $50. Your $5,000 bought you 100 shares of XYZ Company.
Now that your capital has been successfully deployed, let’s fast-forward six months into the future and examine two scenarios. In the “Win Scenario”, XYZ rallies 50% and you win some healthy capital gains on your investment. In the “Loss Scenario”, XYZ plunges 50% and you begin to feel like a typical NASDAQ investor today.
In the Win Scenario when you are simply buying stock outright, your gains are easy to calculate. Your 100 shares of XYZ that you purchased at $50 ran up 50% to $75, leaving you with an equity position worth $7,500, a straightforward $2,500 profit. In the Loss Scenario, XYZ plunged to $25, vaporizing one half of your original capital deployed. Your shares are still worth $2,500, however, even after the share price implosion of XYZ. This clear-cut equity example which we all intuitively understand is a pure unleveraged position that is most useful to contrast with the extraordinary risks and potential rewards/losses inherent in derivatives trading.
Next, let’s warp back in time to your original decision to deploy your $5,000 of risk capital. Let’s assume that the money is not super-important to you and that you have a very-high risk tolerance, so you decide to place the money in options instead of stock. You still like XYZ Company and its prospects but you crave higher leverage and you are willing to accept higher risks of loss to attain that leverage. You fully realize the risks in playing options are very high, but you will not shed any tears if your $5,000 speculation does not pay off. You do some research and find that you can buy a standard call option, the right to purchase, XYZ stock at a strike price of $55 for seven months into the future for $1 per option.
Each option contract on XYZ represents options on 100 shares, so at $1 per share a contract runs $100. With your $5,000 of risk capital you can buy 50 option contracts, yielding a total span of control of 5,000 shares. The enormous leverage inherent in derivatives such as options is immediately apparent. If you buy XYZ outright, you only can afford 100 shares with your $5,000. On the other hand, if you play the risky derivatives market through call options on XYZ, you can control the gains and losses on 5,000 shares, a staggering 50 times increase in absolute leverage. With leverage through derivatives comes the potential for far greater returns, but also far greater losses. Leverage is ALWAYS a sharp double-edged sword.
In the Win Scenario, XYZ rockets to $75 in six months. Your 50 contracts of XYZ call options at a $55 strike price are still one month from expiration and have grown very valuable. As each option grants you the contractual right to purchase a share of XYZ at $55 even though it is now trading at $75, the option on every individual share is now worth $20. The option, a derivative, derives its value from the movements in its underlying asset, the actual shares of XYZ. Since you bought 50 contracts each representing 100 shares worth of XYZ call options, your $5,000 speculation has grown into $100,000 in six months! Through the use of derivatives, your dramatic increase in leverage yielded an awesome $95,000 profit instead of the $2,500 you would have made through outright XYZ stock ownership. When the markets move your way, leverage attained through derivatives can be utterly exhilarating.
In the Loss Scenario, XYZ plummeted to $25 in six months, mimicking the 2001 action of the crippled NASDAQ. Because your options are now so far “out of the money”, they are nearly worthless. Even though there is one month left until they officially expire, no one in the market wants to buy your right to purchase XYZ at $55 when they can just go buy the actual stock at $25 in the open markets. In this scenario, your $5,000 of risk capital has been ground down into oblivion, a catastrophic 100% loss. If you had just bought the stock outright instead, at least you would still have $2,500 dollars left, but through deploying options you basically made an all-or-nothing bet that the XYZ stock price would rise over the limited time horizon of the options. When the markets move against your derivatives, your hard-earned capital can be literally obliterated in mere hours or days, a very difficult and excruciating experience.
Options, the simplest of derivatives, help illustrate the extraordinary leverage and the mega-risk that derivatives exposure entails. Amazingly, long options are one of the lowest risk forms of derivatives because one can never lose more capital than what they paid to purchase the options. Many other more exotic derivatives have dangerous unlimited loss potential and can ultimately destroy far, far more capital than what was actually paid for the financial instruments.
Another critical concept for understanding the strange world of derivatives is “notional value” or “notional amount”. This is a quasi-fictional number that illustrates how much capital a given derivative effectively controls. Although the notional amount does not change hands in a derivatives transaction, it is used to calculate the actual payments that must be made to one counterparty or the other in a derivatives transaction. Furthering our options example above, we can also gain a glimpse into the world of notionality in derivatives.
Although you only deployed $5,000 worth of risk capital in your XYZ call option purchase, you controlled the equivalent of 5,000 shares of stock since each option only cost $1. As the stock was trading at $50 when you originally purchased your options, you controlled a notional amount of XYZ stock worth $50 per share times 5000 shares, or $250,000. In the Win Scenario when XYZ rose 50%, the notional value of your options rose to $75 per share times 5000 shares, $375,000. By purchasing call options you harnessed the extreme leverage of derivatives to enable yourself to originally control the notional equivalent of $250,000 worth of XYZ stock while only risking $5,000 of your own capital.
Realize that the notional amount is not a real number but simply a descriptive fiction detailing how much of the equivalent underlying asset your derivatives position effectively “controls”. Notional amounts are used in the derivatives world to show the effective span of control that derivatives grant market participants over underlying assets at any given point in time. By comparing changing notional values over time, they can be used to measure and analyze positional changes in derivatives exposure over a given time horizon.
Also critical, realize that notional amounts are NOT volume or turnover data, but positional data points. A notional derivatives amount for the end of a given quarter is like a balance sheet presentation of potential exposure at that moment in time, NOT an income-statement like account of activity or turnover in a given quarter. Some prominent analysts have crossed this line out of reality and made the embarrassing public mistake of publishing research where they articulated the twisted fantasy that notional amounts are transactional and not positional. Notional derivatives amounts ARE positional, a snapshot of exposure at a single moment in time.
Although it has lately become somewhat popular on Wall Street and financial circles to claim that notional amounts of derivatives bear no relation to the risk of derivatives positions, we strongly disagree. The higher the notional amounts of an entity’s total derivatives exposure, generally the higher the leverage it has used to pyramid its derivatives positions. The greater the leverage employed, the higher the aggregate risk of a derivatives portfolio. We will discuss this important concept in more detail further below.
In the United States, commercial banks and trusts are required to report their derivatives exposure once every quarter to the United States Comptroller of the Currency. The Office of the Comptroller of the Currency was founded in 1863 as a bureau of the US Treasury and has been responsible for ensuring a “stable and competitive national banking system”. Per the OCC’s website at www.occ.treas.gov , the OCC claims it has four objectives: “To ensure the safety and soundness of the national banking system, to foster competition by allowing banks to offer new products and services, to improve the efficiency and effectiveness of OCC supervision, including reducing regulatory burden, and to ensure fair and equal access to financial services for all Americans.”
The OCC prepares a quarterly report called the “Bank Derivatives Report” which details general derivatives positions for all US commercial banks and trusts that operate in the derivatives market. US commercial banks and trusts are required by law to report their general derivatives positions to the OCC each quarter. Although the OCC Bank Derivatives Report does not include the derivatives positions of non-commercial bank entities like Goldman Sachs, which is an investment bank, the OCC report is still extremely useful in providing a sample or cross section of derivatives market activity and positions in general. We are not sure what percent of the total derivatives market that commercial banks and trusts represent, but we suspect it approaches a majority.
In this essay, all the derivatives data cited is directly from the latest available OCC Bank Derivatives Report, for the first quarter of 2001, available at www.occ.treas.gov/ftp/deriv/dq101.pdf . All of our graphs and derivatives numbers are either lifted directly from or calculated directly from this important US government report. As the data we are reporting is so mind-blowing as to appear unbelievable, we strongly encourage you to check out this original OCC document with your own eyes. An analysis of this official report makes it quite evident that the enormous derivatives market is dominated by one US holding company, the elite blue-chip Dow 30 superbank JPMorganChase.
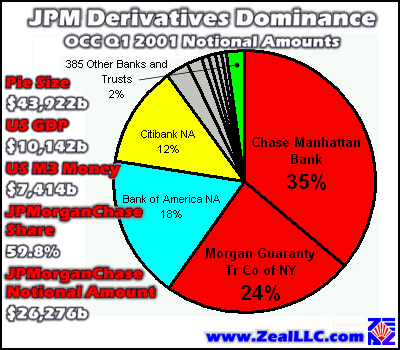
Our first graph was constructed using data from “Table 1” of the OCC Q1 2001 Bank Derivatives Report. It clearly shows who the largest derivatives players are out of all the 395 US commercial banks and trusts that dabble in the derivatives market. The first point that leaps out of this pie graph like a central banker sitting on a thumbtack shows the overwhelming iron-fisted dominance that JPMorganChase (Chase Manhattan Bank and Morgan Guaranty together) exercises over the US derivatives market.
As we delve into the often cryptic world of derivatives, it rapidly becomes apparent that the amounts of dollars of capital effectively controlled through derivatives is absolutely staggering. The notional amount pie in our first graph above is a monstrous $43,922 billion, or almost $44 TRILLION dollars. Rarely at a loss for superlatives, we cannot even think of enough to describe how large these numbers truly are! It is virtually impossible for humans to grasp how big even one trillion is, so we are enlisting the help of the fascinating “MegaPenny Project” website which was created to illustrate enormous numbers.
The MegaPenny Project is located at www.kokogiak.com/megapenny/ and is designed to illustrate large numbers by stacking given numbers of common US one-cent pennies and showing the relative size of the stacks. We encourage you to take in the whole fascinating MegaPenny tour, but for this essay we are particularly interested in its two pages describing one trillion pennies, beginning at www.kokogiak.com/megapenny/thirteen.asp . The MegaPenny Project does a wonderful job graphically illustrating just how much space one trillion pennies would take up.
According to the fine folks at MegaPenny, a solid block of one trillion pennies tightly stacked on top of each other would create a cube 273 feet on each side, each axis of the cube almost as long as an American football field. For comparison purposes, remember that all the gold mined in the last six millennia would fit in a much, much smaller cube only 62 feet on each side! The cube of one trillion pennies would weigh an amazing 3,125,000 tons, almost half as much as the estimated entire weight of all the huge stones comprising the Great Pyramid on the Giza plateau in Egypt! If the trillion pennies were laid flat side-by-side instead of stacked, they would cover 89,675 acres, or over 140 square miles. Stacked on top of each other in a single mega-column, one trillion pennies would create a stack of pennies 986,426 miles high. The average distance from the Earth to the Moon is only around 238,866 miles, so one trillion pennies stacked could travel between the Earth and Moon over four times!
One trillion is a ridiculously large number and almost impossible to visualize in the abstract. Trillions of dollars of derivatives exposure blow the mind! According to MegaPenny, it would take 1.8t pennies to create an exact full-scale replica of the Empire State Building out of pennies. It would take 2.6t tightly stacked pennies to create a life-sized perfect replica of Chicago’s mighty Sear’s Tower.
It is very hard to believe that the total US notional derivatives positions of US commercial banks and trusts is $43.9 TRILLION dollars. By comparison, the US GDP, all the goods and services produced and consumed in our entire great nation by every single American each year, was only running $10.1t in the first quarter. The US M3 money supply, the broadest measure of money, was only $7.4t at the time. The 500 best and biggest companies in the United States, the S&P 500, were only worth $10.4t at the end of the first quarter. Clearly, the $43.9t dollars of the notional value of derivatives that a mere 395 commercial banks and trusts control is simply staggering as it far exceeds the entire US GDP, the entire broad US money supply, and the entire value of all the stocks traded in the United States! BIG, BIG, BIG numbers!
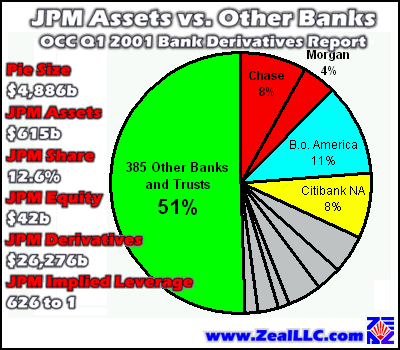
Of that huge $43.9t, JPMorganChase, a single holding company, controls a breathtaking $26.3t worth of derivatives in notional terms! JPM represents 59.8% of the total derivatives market controlled by US commercial banks and trusts per the OCC. Why on earth would one entity run up such gargantuan exposure to derivatives? Perhaps JPM controls nearly 60% of the commercial bank segment of the derivatives market because maybe it holds 60% of the commercial bank assets in the United States of America. We constructed the next graph from “Table 1” of the Q1 2001 OCC Bank Derivatives Report as well to investigate this very question.
Although JPM is a very large commercial bank, it only represents around 12.6% of the total commercial bank assets in the United States per the Q1 OCC report. The pie size in this second graph is $4.9t. This number implies that, in general, the US commercial banking system has a derivatives notional value to assets ratio of 9 to 1, pretty extraordinary leverage when one realizes that a large portion of a given bank’s assets are not usually the shareholders’ but represent funds entrusted to the bank by depositors in various forms. It is also pretty extraordinary gross leverage for an industry that prides itself in being “conservative”. A 9 to 1 implied leverage to assets achieved through derivatives sounds more like hedge fund territory than banking!
JPMorganChase controls 12.6% of the total commercial bank and trust assets in the United States, but a whopping 59.8% of the total commercial bank and trust derivatives market. JPM’s implied derivatives leverage on assets ratio is a colossal 43 to 1. Why would one superbank risk such extreme derivatives exposure relative to its asset base?
Even more provocative and outright frightening is the ratio of the notional value of JPM’s derivatives positions to its shareholder capital. Per JPM’s latest 10-Q quarterly financial report filed with the US Securities and Exchange Commission available at www.jpmorganchase.com/pdfdoc/jpmchase/10Q2Q01.pdf , JPM reported a stockholders’ equity balance of $42b. $42b is a lot of capital and is nothing to scoff at, but when compared to an outstanding aggregate derivatives position with a notional value of $26,276b, JPM’s implied leverage on stockholder equity is utterly mind-blowing. For every dollar that JPM’s shareholders own free and clear, JPM management has pyramided on almost $626 worth of derivatives exposure in notional terms to the highly risky and highly volatile derivatives market! 626 to 1 implied leverage?!? Why, why, why?
While the latest JPM 10-Q was released in mid-August and pertains to Q2 while the latest OCC derivatives report is from Q1, this cross quarter comparison still accurately shows the hyper-extreme leverage inherent in JPM’s aggregate derivatives exposure. If we instead use JPM’s Q1 10-Q to ensure we are comparing apples to apples, the implied leverage on stockholders’ equity changes little to 611 to 1 on $43b of stockholders’ equity.
In financial circles 10 to 1 leverage is considered very aggressive, 100 to 1 is considered to be in the kamikaze realm, but we don’t ever recall hearing about large-scale leveraged operations exceeding 100 to 1 outside of the horrible example of the doomed super hedge fund Long Term Capital Management. JPM’s management may have effectively created the most leveraged large hedge fund in the history of the world by using $42b worth of shareholders’ equity to control derivatives representing a notional value of a staggering $26,276b. After we shook off the blunt shock of learning of an implied leverage of 626 to 1 by the United States’ premier Wall Street bank and elite Dow 30 blue-chip company, we continued to dig deeper into the revealing OCC Bank Derivatives Report.
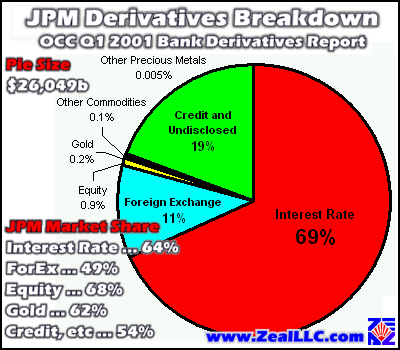
The next pie graph was constructed from “Table 8”, “Table 9”, and “Table 10” of the OCC report. It shows a breakdown of how JPM’s derivatives portfolio is comprised, of what classes of derivatives constitute the JPM Derivatives Monster. The total pie size in this graph is nine-tenths of one percent smaller than the earlier totals in the OCC report. The OCC explained this small delta in a footnote claiming it was caused by the exclusion of some credit derivatives as well as rounding differences. The large green slice of this pie is comprised of a small amount of credit derivatives and other derivatives of which the OCC does not require specific disclosure including “foreign exchange contracts with an original maturity of 14 days or less, futures contracts, written options, basis swaps, and any contracts not subject to risk-based capital requirements.”
Once again, this graph exclusively represents only JPMorganChase’s enormous $26t derivatives portfolio, no other banks’ or trusts’ data is included in this gargantuan pie. The sorcerer’s apprentice is playing with powerful financial magic indeed!
As the pie illustrates, JPM’s largest position by far is in interest rate derivatives. The huge red king-sized slice of the pie graph represents interest rate derivatives with a notional amount of a staggering $17.7t!
In interest rate derivatives, the notional amount represents the implied principal of a debt on which interest rate derivatives are written. For instance, a debtor with $1m in debt and variable interest rate payments may contract with JPM to hedge its interest rate payments into a fixed interest rate scheme instead of a variable one. By having a fixed interest rate payment schedule, the debtor company will not have to worry about market fluctuations in interest rates as their counterparty JPMorganChase assumes that risk for a fee. Although the interest streams in this small $1m debt example are swapped, the actual cash changing hands may only be a few tens of thousands of dollars. The $1m in principal, however, is the notional amount for our interest rate derivatives example and provides a true picture of JPM positional exposure in the deal.
Gold investors may be surprised to see what a trivial portion of JPM’s total derivatives portfolio is deployed in the gold market. Only two tenths of one percent of JPM’s notional derivatives exposure is in gold. Of course, gold is an exceedingly small market compared to the huge debt or foreign exchange markets so JPM’s position in gold derivatives is still quite large relative to the gold market itself. JPM reported $56.8b in gold derivatives in the Q1 2001 OCC report. By comparison, with only 2,500 metric tonnes of gold mined on the entire planet each year, the whole freshly mined annual world gold supply is only worth $22b at $275 per ounce.
JPM is controlling a notional amount of gold through derivatives equal to the value of every ounce of gold that will be mined in the entire world for the next two and a half years assuming gold production does not continue to plummet due to dismal gold prices, which it probably will.
Why is a sophisticated superbank like JPM even interested in the small and devastated gold market, let alone motivated enough to maintain derivatives exposure equal to more than 6,400 tonnes of gold? Why does JPM management want to maintain derivatives gold exposure worth 1.35 times the capital owned by the shareholders of the company? With Wall Street perpetually telling the world that gold is a “barbaric relic”, why does the premier Wall Street bank have such large gold derivatives positions? Ever more intriguing questions!
In the lower left corner of the graph above note the percentage of derivatives market shares that JPM controls out of the entire US commercial bank and trust derivatives universe. JPM is the utterly dominant player with 64% of the interest rate derivatives market, 49% of the foreign exchange market, 68% of the equity derivatives market, and 62% of the gold derivatives market among US commercial banks and trusts. JPM’s management, for whatever reasons, has effectively built up a derivates powerhouse that has almost cornered the entire US commercial bank and trust derivatives market.
Zeroing back in on the $17.7t in interest rate derivatives, we wonder why such enormous exposure to interest rates has been shouldered by JPM’s management. In terms of interest rate derivatives alone, JPM has an implied leverage ratio of notional interest rate derivatives exposure to stockholders’ equity of 422 to 1. Are JPM shareholders aware of this? It is hard to fathom why anyone would want to have leveraged exposure to chaotic interest rates with 422 to 1 leverage, but an intriguing hypothesis has recently emerged that may illuminate the decision by JPM to dominate the enormous interest rate derivatives market. Here is a quick outline of this provocative theory.
As growing numbers of investors around the world realize, American attorney Reginald Howe filed a landmark complaint against the Swiss-based Bank for International Settlements on December 7, 2000. In his lawsuit, which is highly recommended reading, Mr. Howe carefully builds the case that certain large banks that deal in gold derivatives were involved in an effort to actively manipulate the world gold market in violation of key United States laws. Shortly after Mr. Howe filed his complaint in United States District Court, we wrote a summary essay outlining his lawsuit called “Let Slip the Dogs of War” which also has further background information if you are interested in digging deeper.
In Howe v. BIS et al, both the pre-merger JP Morgan and Chase Manhattan were named as defendants with the BIS. In his complaint, Howe points out anomalous gold derivatives activity at both banks documented on earlier OCC bank derivatives reports that correlates extremely well with unusual activity in the gold markets and gold price. The evidence is highly suggestive that both banks, now a single entity, used carefully targeted strategic gold derivatives transactions to help rein in the out-of-control gold rally that was sparked in late 1999 after European central banks agreed to curtail their gold sales and leasing with the Washington Agreement.
Mr. Howe’s complaint filed in the federal court elaborates on this odd activity by the two banks that have since merged to form superbank JPMorganChase. Interestingly, Mr. Howe’s case will soon be heard before a federal judge in Boston, Massachusetts on October 9, 2001, when defendants will present their arguments in support of their Motions to Dismiss.
With both ancestor banks of the new JPMorganChase already documented as having well-timed anomalous gold derivatives activity prior to their merger, chances are the banks had some level of insider-type knowledge of what was really transpiring in the gold market. There is no way that JPM management would have acquired gold derivatives with a notional value worth 1.35 times the total of their entire shareholders’ equity base unless they knew and intimately understood the gold market.
On May 30, 2001, ace researcher and analyst Michael Bolser and GATA Chairman Bill Murphy co-published an analysis of JPMorganChase’s interest rate derivatives in Mr. Murphy’s “Midas” column at the excellent www.LeMetropoleCafe.com contrarian investing website. Mr. Bolser titled his research “GoldGate’s Real Motive?”. Current subscribers to www.LeMetropoleCafe.com can see this analysis in the archives of the “James Joyce” table at LeMetropoleCafe. In his analysis, Mr. Bolser pointed out that JPMorganChase had $16t worth of notional interest rate derivatives exposure at the time and how incredible this fact was. He noted that JPM’s interest rate derivatives notional amounts had doubled since the middle of 1998, an astronomical increase given the absolute amounts of dollars involved.
Mr. Bolser offered the stunning tentative conclusion that perhaps a suppressed or shackled-down gold price was a necessary prerequisite to JPM assuming enormous amounts of interest rate derivatives, as a managed gold price would ratchet down inflationary expectations and make interest rate positions much less volatile and risky than in a truly free market. Mr. Bolser planned to continue his research and was seeking earlier OCC reports to model JPM’s derivatives trading activities and exposures further back in time.
After Mr. Bolser’s interest rate derivatives report revealing JPM’s enormous and massively out-of-proportion derivatives positions, there were a few tangential comments made about this hypothesis over the summer by various market analysts, but for the most part it remained an obscure area of inquiry that appeared to generate little popular interest.
Then, just a few weeks ago on August 13, 2001, Reginald Howe published a fascinating commentary entitled “Gibson’s Paradox Revisited: Professor Summers Analyzes Gold Prices” available at www.GoldenSextant.com . In his essay Mr. Howe quotes a 1988 academic paper from the Journal of Political Economy co-written by President Bill Clinton’s future third Secretary of the Treasury, Lawrence Summers. Among other things, Mr. Howe discusses Mr. Summers’ interpretation of an observation by the famous economist John Maynard Keynes on the behavior of gold prices and real interest rates. Lord Keynes called the relationship “Gibson’s Paradox”.
As Mr. Howe points out, per Lord Keynes, Gibson’s Paradox, the solid relationship between price levels including gold and interest rates under a gold standard regime was, "one of the most completely established empirical facts in the whole field of quantitative economics.” Mr. Howe shows, using the writings of Professor Lawrence Summers and legendary economist John Maynard Keynes that there is a rock-solid inverse relationship between gold and real interest rates in a free market. We investigated this phenomenon as well in our essay “Real Rates and Gold”. In effect, real interest rates could be used to predict inverse moves in the price of gold or gold could be used to predict inverse moves in the real interest rates.
For us, Howe’s fantastic “Gibson’s Paradox Revisited” essay finally lit the proverbial lightbulbs above our heads that triggered a solid understanding of Michael Bolser’s shrewd earlier hypothesis on JPM’s enormous interest rate derivatives exposure! Gibson’s Paradox helped to reconcile the puzzle and answer nagging questions about JPM’s gargantuan interest rate derivatives position and how it could relate to the active management of the price of gold.
If factions of the US government in the Clinton years from 1995 to late 2000 were really actively manipulating the gold price (as the latest amazing research of government records by James Turk and Reginald Howe certainly strongly suggests through ever-increasing evidence), and if JPM really had inside knowledge of some of these operations as its anomalous gold derivatives activity seems to imply, then it is only a short logical step to assume that a possible catalyst for the explosion in JPM’s interest rate derivatives operations was the artificially pegged price of gold!
Gibson’s Paradox, defined by Lord Keynes, effectively claims that under a fixed gold price regime real interest rates remain predictable. If JPM top management was participating in any US efforts to cap gold, they had full knowledge that a de facto fixed gold price regime had been stealthily established and they would have had a carte blanche to massively balloon potentially highly lucrative interest rate derivatives exposure. After all, if JPM was convinced gold was under control, and that gold prices were a prime driver of real interest rates, then what better time to become the king of the interest rate derivates world than when gold was being quietly hammered down through massive sales of official sector gold from Western central banks’ coffers?
Our superficial presentation here certainly does not do this startling hypothesis justice, but the JPMorganChase interest rate derivatives explosion due to JPM upper management knowledge of and possible involvement in stealthy government machinations in the gold markets is a very intriguing hypothesis that definitely warrants further investigation and discussion. We may write a future essay on this topic alone after we dig deeper, and we certainly hope other analysts and researchers follow Michael Bolser’s original lead and do some serious investigating.
Back to the JPMorganChase Derivatives Monster for now, we have to wonder how many JPM shareholders realize just how incredibly leveraged their superbank has become. Do they think they are holding a safe conservative blue-chip elite Wall Street bank, or do the average shareholders desire to hold a hyper-leveraged mega hedge fund with 600+ times implied leverage on stockholders’ equity? Do JPM shareholders understand how dangerous large derivatives positions have proven historically for other companies?
JPM currently has something like 2,700 large institutional shareholders who hold almost 61% of its common stock. Do the managers of these mutual funds and pension funds understand that JPM management has built the biggest most highly-leveraged derivatives pyramid in the history of the world per US government OCC reports? Do fund managers understand the inherent risks in leveraging capital hundreds of times over? These are important questions that ALL JPM investors should carefully consider, especially in this incredibly turbulent and volatile market environment we are experiencing today.
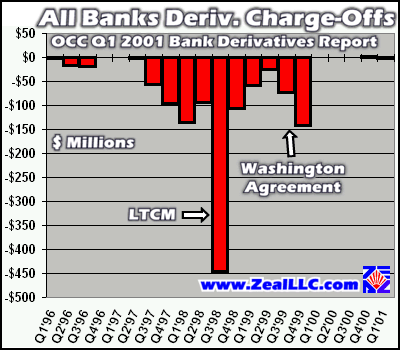
One of the most dangerous possible events for high derivatives exposure is unforeseen market volatility, especially that caused by unusual and unexpected major discontinuities in market pricing. The following graph is also shamelessly taken from the OCC report, “Graph 5C”, which shows the “charge-offs” taken on derivatives written off in each quarter since 1996 by commercial banks and trusts alone. Note the enormous loss that occurred in the third quarter of 1998 coincident with the Russian Debt Crisis/LTCM debacle and the large losses in late 1999 following the Washington Agreement gold spike.
When a non-linear market event that is inherently unpredictable like the Russian Debt Crisis occurs, its effects on carefully crafted derivatives portfolios can be catastrophic. Long Term Capital Management folded during the 1998 crisis. It was an elite hedge fund run by some of the most brilliant market geniuses of the entire last century. The all-star brain trust at LTCM could probably have helped put men on Mars, as the stellar IQs and acclaim of the founders were without equal in the financial world. The gentlemen helping to build the sophisticated computer derivatives trading models for LTCM were Nobel-prize winning economists who understood more about markets and volatility than pretty much everyone else on the planet. Here are a few paragraphs on LTCM from an earlier essay we penned on gold derivatives volatility titled, “Gold Delta Hedge Trap (Part 2)”.
“LTCM
employed Scholes’ and Merton’s work to hedge and protect its bets.
Through Black and Scholes based hedging strategies, LTCM became one
of the most highly leveraged hedge funds in history. It had a
capital base of $3b, yet it controlled over $100b in assets
worldwide, and some reports claim the total notional value of its
derivatives exceeded an incredible $1.25 TRILLION. LTCM used
extraordinarily sophisticated mathematical computer models to
predict and mitigate its risks.”
Long Term Capital Management had $3b in capital allegedly supporting $1,250b of derivatives notional value, an implied leverage ratio of 417 to 1. JPMorganChase, per its own reports filed with the US government, has $42b supporting $26,276b of derivatives notional value. Incredibly, JPM’s implied capital leverage on its derivatives is far, far higher than LTCM’s at 626 to 1. Isn’t it disconcerting to realize JPM management has further leveraged its shareholder equity than even the infamous Long Term Capital Management?
LTCM had the best economic minds in the world running the fund, unlimited brain and computer power, but still an unpredictable volatility event spurred by the Russian Debt Crisis caused their painstakingly developed computer derivatives models to blow up. By many reports, including from the Federal Reserve, the LTCM failure was so dangerous it threatened to take the whole financial system down if LTCM’s obligations to its counterparties were defaulted upon.
We are NOT suggesting that JPM is another LTCM. We know that the men and women running JPM are very intelligent and have a deep understanding of the global markets in which their company operates. We know they have cross-hedged and carefully modeled their enormous derivatives portfolio to try and make it net market neutral and therefore resilient to shocks. But, just as a tiny imperfection can cause a massive hardened-steel shaft connected to a nuclear aircraft carrier’s propeller to vibrate uncontrollably until it shatters, even a “balanced” net derivatives portfolio of massive size is highly vulnerable to market shocks that can push it out of proper equilibrium and spin the computer hedging models out of control far faster than derivatives can be unwound.
There comes a point when leverage becomes so extreme that even a tiny unforeseen event can break down the complex contractual glue that holds the various components and players of the convoluted derivatives world together and cause the whole structure to shake or crumble.
We believe that JPM’s management is taking a mammoth gamble with the wealth of its shareholders by supporting derivatives with a notional value of over $26 TRILLION dollars with a relatively trifling $42 billion of shareholder equity. Any discontinuous market volatility event that is unforeseen and beyond JPM management’s control could conceivably cause this immense pyramid to rapidly unwind, utterly annihilating the company’s capital in a matter of days or weeks.
Also, JPM, just by virtue of having extreme leverage, is placing itself at risk for a Barings Bank type scenario, where a rogue trader hid derivatives trading activities from management until it was too late and the damage was irreparable. What if some twenty- or thirty-something derivatives trader working for JPM accidentally makes a big mistake in his or her trading and destroys that fragile balance supporting the whole massive JPM derivatives pyramid and the whole structure comes crashing down?
By its own reporting to the US government, JPMorganChase has shown itself to have evolved into a real-life Derivatives Monster. Derivatives offer extreme leverage and the potential for mega-profits, but with that they carry commensurate extreme risks. Until the JPM Derivatives Monster begins to deflate its leverage and exposure, we believe individual and institutional investors alike should be very careful in assessing the potential extreme risk of holding JPM stock.
We can’t help but feeling that essentially unlimited leverage is the modern financial equivalent of Walt Disney’s sorcerer’s apprentice in “Fantasia” unleashing forces he couldn’t possibly hope to control.
Adam Hamilton, CPA September 7, 2001 Subscribe |
|||||||
|
|
|
|
|
|
|
|
|
|
|
|
|
|
|
|||