|
|
|||||||
|
|
|
|
|
|
|
|
|
|
|
|
|
|
|
|
|
|
|
Gold Mid-Tiers’ Q2’26 Fundamentals Adam Hamilton August 21, 2026 3259 Words
Smaller mid-tier and junior gold miners just finished reporting another spectacular quarter, their second-best ever. Despite gold plunging in a serious drawdown in Q2 proper, its smaller miners still earned near-record profits. That windfall combined with gold-driven stock-price drops hammered valuations to their lowest levels in at least a decade. Such epic fundamental strength makes gold stocks screaming buys.
The leading mid-tier-gold-stock benchmark is the GDXJ VanEck Junior Gold Miners ETF. With $9.2b in net assets midweek, it remains the second-largest gold-stock ETF after its big-brother GDX. That’s dominated by far-larger major gold miners, though there is much overlap between these ETFs’ holdings. Still misleadingly named, GDXJ is overwhelmingly a mid-tier gold-stock ETF with juniors having lesser weightings.
Gold-stock tiers are defined by miners’ annual production rates in ounces of gold. Small juniors have little sub-300k outputs, medium mid-tiers run 300k to 1,000k, large majors yield over 1,000k, and huge super-majors operate at vast scales exceeding 2,000k. Translated into quarterly terms, these thresholds shake out under 75k, 75k to 250k, 250k+, and 500k+. Today only five of GDXJ’s 25 biggest holdings are true juniors.
Their Q2 outputs are highlighted in blue in this essay’s table. Juniors not only mine less than 75k ounces per quarter, but gold output generates over half their quarterly revenues. That excludes streaming and royalty companies that purchase future gold output for big upfront payments helping finance mine-builds, and primary silver miners producing byproduct gold. But mid-tiers often make better investments than juniors.
These gold miners dominating GDXJ offer a unique mix of sizable diversified production, excellent output-growth potential, and smaller market capitalizations ideal for outsized gains. Mid-tiers are less risky than juniors, while amplifying gold uplegs more than majors. So we’ve long specialized in the fundamentally-superior mid-tiers and juniors at Zeal, actively trading these smaller gold miners for over a quarter-century now.
Since Q2’26 proved brutal for gold, most traders have overlooked gold stocks continuing to thrive. Within last quarter, gold collapsed 14.1% making for its worst quarter since Q2’13! Gold was suffering a necessary serious drawdown after its late monster record bull shot near-parabolic in late January. Q2’s withering heavy selling was exacerbated by an ongoing backward war trade and irrational Fed-rate-hike fears.
Gold taking such a thrashing should’ve gutted smaller gold miners, as they tend to amplify material gold moves by 3x to 4x+. Yet remarkably GDXJ only lost 18.2% in Q2 proper, making for astoundingly-mild 1.3x downside leverage! All that selling was part of a broader reckoning, where gold dropped 26.3% from late January to mid-July. GDXJ’s roughly-parallel losses ran 41.3% at worst, again merely amplifying gold by 1.6x.
At the usual 3x to 4x, smaller gold-stock craterings would have been catastrophic. So why did mid-tiers and juniors exhibit such phenomenal relative strength to their metal in Q2? Two reasons. First in gold’s preceding record 196.4% cyclical-bull run from early October 2023 to late January 2026, GDXJ way underperformed. While its resulting 406.6% gains were massive absolutely, they only leveraged gold an inferior 2.1x.
Since the smaller gold miners didn’t enjoy normal upside relative to the metal overwhelmingly driving their profits, they didn’t need to suffer normal downside. Second, experienced gold-mining investors knew Q2 results would again prove spectacular. Back in early July weeks before earnings season began, I wrote an entire essay predicting gold miners’ near-record Q2. Their anomalous low valuations hinder severe selling.
For 41 quarters in a row now, I’ve painstakingly analyzed the latest operational and financial results from GDXJ’s 25-largest component stocks. Mostly mid-tiers, they now account for 65.3% of this ETF’s total weighting. While digging through quarterlies is a ton of work, understanding smaller gold miners’ latest fundamentals really cuts through the obscuring sentiment fogs shrouding this sector. This research is essential.
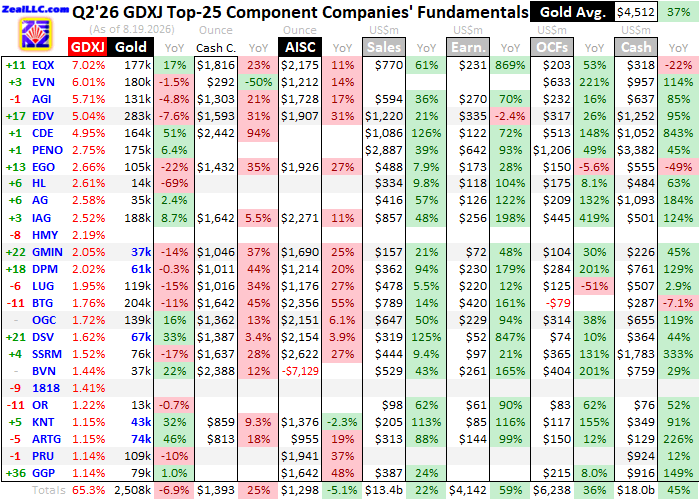
This table summarizes the GDXJ top 25’s operational and financial highlights during Q2’26. These gold miners’ stock symbols aren’t all US listings, and are preceded by their rankings changes within GDXJ over this past year. The shuffling in their ETF weightings reflects shifting market caps, which reveal both outperformers and underperformers since Q2’25. Those symbols are followed by their current GDXJ weightings.
Next comes these gold miners’ Q2’26 production in ounces, along with their year-over-year changes from the comparable Q2’25. Output is the lifeblood of this industry, with investors generally prizing production growth above everything else. After are the costs of wresting that gold from the bowels of the earth in per-ounce terms, both cash costs and all-in sustaining costs. The latter help illuminate miners’ profitability.
That’s followed by a bunch of hard accounting data reported to securities regulators, quarterly revenues, earnings, operating cash flows, and resulting cash treasuries. Blank data fields mean companies hadn’t disclosed that particular data as of the middle of this week. The annual changes aren’t included if they would be misleading, like comparing negative numbers or data shifting from positive to negative or vice-versa.
The key to gold miners bucking gold’s horrible Q2 to earn spectacular profits was average gold prices. While the metal plummeted 14.1% within Q2, in quarterly-average price terms it still soared an enormous 37.3% YoY to $4,512! Those were the second-highest prevailing gold prices ever after the preceding Q1. When gold is high, its miners earn money hand-over-fist. The GDXJ top 25 certainly delivered last quarter.
Unlike its big-brother GDX, GDXJ’s top holdings are much more dynamic. Mid-tiers and juniors with new mines or major expansions going live can fly into its upper ranks on soaring market capitalizations, crowding stagnating ones out. There’s also big overlap between GDXJ and GDX top holdings. GDXJ’s 13 largest components are also all GDX-top-25 ones, and the entire GDXJ-top-25 lineup is also included in GDX.
Again accounting for 65.3% of GDXJ’s weighting, they also represent 27.7% of GDX’s. GDXJ essentially lops off GDX’s ten largest components which are super-majors and majors, then expands the weighting of the next biggest from a bit over 1/4th to nearly 2/3rds. Occasionally these dominant gold-stock ETFs’ common manager removes a larger miner from GDXJ to be exclusively included in GDX, like in this past year.
For three quarters in a row into Q4’25, Pan American Silver was GDXJ’s largest holding. Despite mining 6,469k ounces of silver in Q2’26, PAAS remains a primary gold miner. Its 166k ounces of gold produced last quarter drove fully 2/3rds of its revenues! Now GDX’s 9th-largest component, having PAAS in GDXJ-top-25 results in Q2’25 but not Q2’26 considerably skews most comparisons. PAAS wasn’t the only one either.
A second major silver-and-gold miner was also booted from GDXJ’s upper ranks over this past year, the Mexican giant Fresnillo. Now only included in GDX, it produced 155k ounces of gold last quarter along with a huge 10,928k of silver. Gold only drove 4/10ths of its Q2 revenues, so it isn’t a primary gold miner. But like PAAS, comparing a GDXJ top 25 with and without FRES also distorts everything from output to sales.
Last quarter the GDXJ-top-25 mid-tiers produced 2,508k ounces of gold, which fell 6.9% YoY. Had PAAS and FRES remained in instead of GDXJ’s 24th- and 25th-largest components effectively replacing them, aggregate production would’ve run 2,640k ounces which was only down 2.0% YoY. That trounces GDX-top-25 majors’ 10.4%-YoY slide in Q2’26, to an at-least-41-quarter low! Smaller gold miners beat larger ones.
Mid-tiers have always been superior to the majors. Running smaller stables of typically one-to-four gold mines, any sizable expansions or new mine-builds really move the needle to grow mid-tiers’ production. They not only easily overcome depletion unlike their larger peers, but consistently achieve sizable output growth as a group. Smaller gold stocks enjoy outsized gains around new expansions and mines coming online.
Production growth is essential in gold mining because it provides the cashflows necessary to continue expanding existing mines and building or buying new ones, ultimately driving stock prices higher. And surprisingly mid-tiers often have lower mining costs than majors, despite the latter’s supposed economies of scale. That makes mid-tiers much more profitable relative to their production, supporting bigger stock gains.
Also contributing to those is mid-tiers’ lower market capitalizations. The GDXJ top 25’s averaged merely $10.8b this week, around 1/3rd of the GDX top 25’s $31.1b average last week! Generally the smaller any company’s market cap, the less inertia its stock price has and the less capital inflows needed to drive it higher. So when gold is powering higher fueling sector interest, mid-tiers and juniors really outperform.
As usual in this long research thread, immediately after earnings season I started with the GDX top 25’s Q2’26 results which I analyzed in depth in last week’s essay. Comparing the mid-tier-dominated GDXJ’s quarterlies with the major-dominated GDX’s helps explain smaller gold miners’ outperformance which is also evident in stock prices. GDXJ again tends to amplify major gold moves 3x to 4x+, besting GDX’s 2x to 3x.
Unit gold-mining costs are generally inversely proportional to gold-production levels. That’s because gold mines’ total operating costs are largely fixed during pre-construction planning stages, when designed throughputs are determined for plants processing gold-bearing ores. Their nameplate capacities don’t change quarter-to-quarter, requiring similar levels of infrastructure, equipment, and employees to keep running.
So the primary variable driving quarterly gold production is the ore grades fed into these plants. Those vary widely even within individual gold deposits. Richer ores yield more ounces to spread mining’s big fixed expenses across, lowering unit costs and boosting profitability. But while fixed costs are the lion’s share of gold mining, there are also sizable variable costs where recent years’ raging inflation hit hard.
Cash costs are the classic measure of gold-mining costs, including all cash expenses necessary to mine each ounce of gold. But they are misleading as a true cost measure, excluding the big capital needed to explore for gold deposits and build mines. So cash costs are best viewed as survivability acid-test levels for smaller gold miners. They illuminate the minimum gold prices necessary to keep the mines running.
Last quarter the GDXJ top 25’s average cash costs soared 24.8% YoY to $1,393! That was the second-highest ever after Q1’26’s $1,441. But one noteworthy outlier skewed this high, Coeur Mining. It bought out the great mid-tier New Gold, and oddly chose to ascribe $140m of that purchase price to inventory. Without that accounting fiction, CDE’s version of cash costs would’ve plunged dramatically to a normal $1,608.
That would’ve dragged down the GDXJ-top-25 average considerably to $1,344, which would’ve been up a milder 20.4% YoY. Both are still worse than the GDX top 25’s average cash costs in Q2 after that same CDE adjustment, which only climbed 8.4% YoY to $1,286. Interestingly the biggest driver of higher cash costs last quarter was higher prevailing gold prices, because many gold mines pay royalties on their output.
These are generally based on percentages of the value of gold produced, moving in proportion with gold prices. IAMGOLD has the clearest reporting on royalties’ impact, publishing unit mining costs with and without royalties. Its Q2 cash costs ran $1,642 with, but just $1,289 without. Royalties fueled over 1/5th of IAG’s cash costs! And cash costs including royalties are the largest component by far of broader AISCs.
All-in sustaining costs are far superior than cash costs, and were introduced by the World Gold Council in June 2013. They add on to cash costs everything else that is necessary to maintain and replenish gold-mining operations at current output tempos. AISCs give a much-better understanding of what it really costs to maintain gold mines as ongoing concerns, and reveal smaller gold miners’ true operating profitability.
Astoundingly last quarter, the GDXJ top 25’s average AISCs fell 5.1% YoY to only $1,298 per ounce! That not only radically trounced the GDX top 25’s $1,788 soaring 25.6% YoY, but was only the second quarter out of the last 41 where AISCs were lower than cash costs. That doesn’t make any sense, and is only possible because of an extreme anomaly. Peru’s Buenaventura continues to report the impossible.
BVN is an unusual non-primary-gold miner still choosing to report in gold-centric terms, probably because gold stocks draw much more investor interest and capital than base-metals ones. While gold drove less than 1/3rd of Buenaventura’s Q2’26 revenues, this polymetallic miner still inexplicably chooses to credit its collectively-much-larger silver, copper, zinc, and lead production as gold byproducts gutting its AISCs.
In Q2 one of BVN’s mines yielded 13.4k metric tons of copper, 371k ounces of silver, and such negligible gold it wasn’t even mentioned. Yet misleadingly this company still reported that mine’s gold AISCs at -$42,588 per ounce! That helped drag down Buenaventura’s overall all-in sustaining costs reported in Q2 to an absurd -$7,129 per ounce! While such sorcery is madness, the data is the data and must be included.
For the entire 41-quarter history of this research thread, I’ve always included all reported data no matter how distorted some was. Nearly all outlying AISCs have proven anomalous high-side ones, dragging up the GDXJ-top-25 averages. So for consistency’s sake I have to include BVN’s craziness despite hating to. Buenaventura has reported negative AISCs for years, skewing both GDXJ- and GDX-top-25 averages.
Excluding BVN, the rest of the GDXJ top 25 averaged record $1,794 AISCs in Q2’26 which soared 20.6% YoY from Q2’25 also ex-BVN. That’s right in line with the GDX top 25’s $1,788. While Buenaventura is also a GDX component, it had thankfully fallen to 33rd place as of last week. Making BVN’s reporting even more suspect, it somehow also nuttily declared that Q2’26 copper AISCs were -$11,656 per metric ton!
Interestingly the GDXJ-top-25 mid-tiers are projecting lower AISCs in Q3 and Q4. In Q1 and Q2 without BVN, they averaged $1,844 and that $1,794. Full-year-2026 guidance midpoint averages are considerably lower at $1,727. With H1’26 $92 above that, H2’26 would have to come in a similar amount below to achieve those forecasts. Many mid-tiers are guiding to back-half-weighted output boosts lowering AISCs.
Rather than worrying about absolute AISC changes, more relevant is their ratio relative to prevailing gold prices. In Q2’26 the GDXJ top 25’s $1,298 BVN-skewed average edged down to a record low 28.8%, slightly besting Q1’26’s 29.5%! The resulting huge profit margins are mind-blowing. For comparison in the five years before Q4’23 birthed that late record gold bull, that AISC-to-gold ratio averaged a far-higher 68%.
After my quarter-century-plus of intensely studying this sector, I’ve found the best metric for measuring gold miners’ collective fundamental performance is their implied unit earnings. That simply subtracts the GDXJ-top-25 average AISCs from the quarterly-average gold price. This is way cleaner than bottom-line accounting profits, since a varying GDXJ-top-25 subset’s are usually distorted by big noncash charges or gains.
That second-highest-ever $4,512 average gold in Q2 again soared 37.3% YoY, as BVN-distorted AISCs fell 5.1% YoY to $1,298. Those combined for spectacular sector unit profits of $3,214, indeed the second-best on record not far behind Q1’26’s $3,437! Those soared 67.6% YoY, extending the long parade of windfall gold-miner earnings growth! That’s what makes gold stocks such fantastic buys fundamentally.
Astoundingly over the last twelve consecutive quarters ending Q2’26, these GDXJ-top-25 implied unit earnings have skyrocketed 106%, 133%, 63%, 63%, 71%, 95%, 91%, 79%, 82%, 102%, 131%, and that 68% YoY! There can’t be any other sector in all the stock markets even remotely competing with such massive consistent profits growth, it is phenomenal. And gold miners’ earnings certainly aren’t done soaring.
Over halfway through Q3’26 midweek, gold is still averaging an outstanding $4,159 on close this quarter despite that serious drawdown bottoming in mid-July at $3,973. That remains wildly above that GDXJ-top-25 average full-year AISC guidance of $1,727. And that will only be achieved if Q3 and Q4 average just $1,635 to offset Q1 and Q2 overages! Buenaventura doesn’t give AISC guidance, so it isn’t a factor here.
But to be conservative, let’s assume GDXJ-top-25 AISCs shake out around $1,700 in Q3. That would still make for additional 18%-YoY profits growth. And if BVN remains in the GDXJ top 25 into the next earnings season, average AISCs will again be skewed far lower making for far-larger profits growth. The way gold is blasting higher in August, its Q3 average could also prove considerably higher than quarter-to-date.
The GDXJ-top-25 mid-tiers’ Q2’26 hard accounting results reported to securities regulators under GAAP or other countries’ equivalents were also excellent, though hurt by Pan American Silver and Fresnillo getting kicked out. Total revenues grew 22.5% YoY to $13,379m, the fourth-highest on record. But had PAAS and FRES remained instead of GDXJ’s 24th and 25th stocks, sales would’ve blasted up 44.7% to $15,807m.
Bottom-line profits soared 59.4% YoY to $4,142m, their third-best ever. But doing that same PAAS and FRES swap would’ve catapulted them up to a record-breaking $5,179m in Q2’26, skyrocketing 99.3% YoY! Such fat-and-rich profits forced the GDXJ top 25’s average trailing-twelve-month price-to-earnings ratios down to just 16.1x! That’s smaller gold miners’ lowest valuations witnessed in at least the last 41 quarters.
Operating cash flows surged 36.3% YoY to $6,238m, their third-highest. Yet adjusting for PAAS and FRES those OCFs would’ve weighed in at $7,091m up 55.0% YoY. And total cash treasuries soared 45.2% YoY to a record $17,966m, or 63.2% to $20,193m with Pan American Silver and Fresnillo instead of GDXJ’s current 24th and 25th components. Smaller gold miners have vast funds on hand to grow production.
Mid-tiers’ and juniors’ fundamental superiority is why we’ve always specialized in trading them at Zeal. In the quarter-century into Q2’26, we’ve realized 1,648 stock trades in our weekly and monthly subscription newsletters. The vast majority gold and silver stocks, their average annualized realized gains over that long span are running +19.8%! That includes all losers, and is the kind of track record hedge funds would kill for.
We’re constantly looking for the ever-changing highest-production-growth subset of mid-tiers and juniors with big new expansions or mine-builds soon coming online. Those provide catalysts to attract in capital, particularly from fund managers. Sooner or later some critical mass of professional investors is going to increasingly recognize the extreme value in this small sector, and flood in catapulting stock prices way higher.
Successful trading demands always staying informed on markets, to understand opportunities as they arise. We can help! For decades we’ve published popular weekly and monthly newsletters focused on contrarian speculation and investment. They draw on my vast experience, knowledge, wisdom, and ongoing research to explain what’s going on in the markets, why, and how to trade them with specific stocks.
Our holistic integrated contrarian approach has proven very successful, and you can reap the benefits for only $12 an issue. We extensively research gold and silver miners to find cheap fundamentally-superior mid-tiers and juniors with outsized upside potential. Sign up for free e-mail notifications when we publish new content. Even better, subscribe today to our acclaimed newsletters and start growing smarter and richer!
The bottom line is the smaller gold miners just reported their second-best quarter ever. Despite gold’s serious reckoning in Q2 after its late monster record bull, the miners continued earning money hand-over-fist. Gold still remained high enough to fuel miners’ near-record unit profits, driving gold stocks’ valuations to their lowest levels in at least a decade and likely ever. Their ongoing fundamental strength is amazing.
The mid-tiers’ and juniors’ remarkable twelve-consecutive-quarter streak of enormous profits growth isn’t over. Current still-lofty quarter-to-date average gold prices in Q3 along with miners guiding to lower costs portends more windfall earnings coming. Sooner or later investors will figure this out and return in force, catapulting smaller gold stocks way higher. GDXJ’s recent massive breakout argues that is getting underway.
Adam Hamilton, CPA August 21, 2026 Subscribe |
|||||||
|
|
|
|
|
|
|
|
|
|
|
|
|
|
|
|||