|
|
|||||||
|
|
|
|
|
|
|
|
|
|
|
|
|
|
|
|
|
|
|
Gold Juniors’ Q3’17 Fundamentals Adam Hamilton December 1, 2017 3726 Words
The junior gold miners’ stocks have spent months grinding sideways near lows, sapping confidence and breeding widespread bearishness. The entire precious-metals sector has been left for dead, eclipsed by the dazzling Trumphoria stock-market rally. But traders need to keep their eyes on the fundamental ball so herd sentiment doesn’t mislead them. The juniors recently reported Q3 earnings, and enjoyed strong results.
Four times a year publicly-traded companies release treasure troves of valuable information in the form of quarterly reports. Companies trading in the States are required to file 10-Qs with the US Securities and Exchange Commission by 45 calendar days after quarter-ends. Canadian companies have similar requirements. In other countries with half-year reporting, many companies still partially report quarterly.
The definitive list of elite junior gold stocks to analyze used to come from the world’s most-popular junior-gold-stock investment vehicle. This week the GDXJ VanEck Vectors Junior Gold Miners ETF reported $4.4b in net assets. Among all gold-stock ETFs, that was only second to GDX’s $8.1b. That is GDXJ’s big-brother ETF that includes larger major gold miners. GDXJ’s popularity testifies to the great allure of juniors.
Unfortunately this fame has recently created major problems severely hobbling the usefulness of GDXJ. This sector ETF has shifted from being beneficial for junior gold miners to outright harming them. GDXJ is literally advertised as a “Junior Gold Miners ETF”. Investors only buy GDXJ shares because they think this ETF gives them direct exposure to junior gold miners’ stocks. But unfortunately that’s no longer true!
GDXJ is quite literally the victim of its own success. This ETF grew so large in the first half of 2016 as gold stocks soared in a massive upleg that it risked running afoul of Canadian securities law. Most of the world’s junior gold miners and explorers trade in Canada. In that country once any investor including an ETF goes over 20% ownership in any stock, it is deemed a takeover offer that must be extended to all shareholders!
Understanding what happened in GDXJ is exceedingly important for junior-gold-stock investors, and I explained it in depth in my past essay on juniors’ Q1’17 results. GDXJ’s managers were forced to reduce their stakes in leading Canadian juniors. So capital that GDXJ investors intended to deploy in junior gold miners was instead diverted into much-larger gold miners. GDXJ’s effective mission stealthily changed.
Not many are more deeply immersed in the gold-stock sector than me, as I’ve spent decades studying, trading, and writing about this contrarian realm. These huge GDXJ changes weren’t advertised, and it took even me months to put the pieces together to understand what was happening. GDXJ’s managers may have had little choice, but their major direction change has been devastating to true junior gold miners.
Investors naturally pour capital into GDXJ, the “Junior Gold Miners ETF”, expecting to own junior gold miners. But instead of buying junior gold miners’ shares and bidding up their prices, GDXJ is instead shunting those critical inflows to the much-larger mid-tier and even major gold miners. That left the junior gold miners starved of capital, as their share prices they rely heavily upon for financing languished in neglect.
GDXJ’s managers should’ve lobbied Canadian regulators and lawmakers to exempt ETFs from that 20% takeover rule. Hundreds of thousands of investors buying an ETF obviously have no intention of taking over gold-mining companies! And higher junior-gold-stock prices boost the Canadian economy, helping these miners create valuable high-paying jobs. But GDXJ’s managers instead skated perilously close to fraud.
This year they rejiggered their own index underlying GDXJ, greatly demoting most of the junior gold miners! Investors buying GDXJ today are getting very-low junior-gold-miner exposure, which makes the name of this ETF a deliberate deception. I’ve championed GDXJ for years, it is a great idea. But in its current sorry state, I wouldn’t touch it with a ten-foot pole. It is no longer anything close to a junior-gold-miners ETF.
There’s no formal definition of a junior gold miner, which gives cover to GDXJ’s managers pushing the limits. Major gold miners are generally those that produce over 1m ounces of gold annually. For years juniors were considered to be sub-200k-ounce producers. So 300k ounces per year is a very-generous threshold. Anything between 300k to 1m ounces annually is in the mid-tier realm, where GDXJ now traffics.
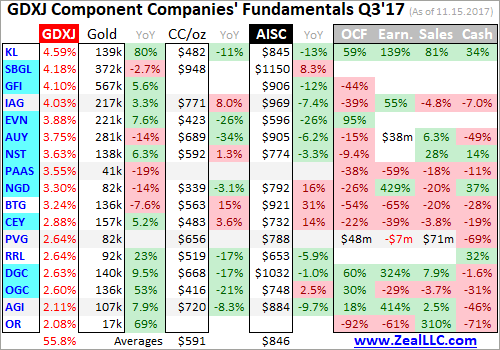
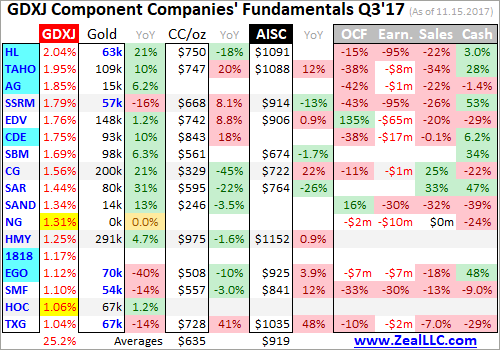
That high 300k-ounce-per-year junior cutoff translates into 75k ounces per quarter. Following the end of the gold miners’ Q3 earnings season in mid-November, I dug into the top 34 GDXJ components. That’s just an arbitrary number that fits neatly into the tables below. While GDXJ included a staggering 73 component stocks in mid-November, the top 34 accounted for a commanding 81.1% of its total weighting.
Out of these top 34 GDXJ companies, only 5 primary gold miners met that sub-75k-ounces-per-quarter qualification to be a junior gold miner! Their quarterly production is highlighted in blue below, and they collectively accounted for just 7.1% of GDXJ’s total weighting. But even that isn’t righteous, as these include a 126-year-old silver miner and a mid-tier gold miner suffering temporary production declines.
GDXJ is inarguably now a pure mid-tier gold-miner ETF. That’s great if GDXJ is advertised as such, but terrible if capital investors explicitly intend for junior gold miners is instead being diverted into mid-tiers without their knowledge or consent. The vast majority of GDXJ shareholders have no idea how radically this ETF has changed since early 2016. It is all but unrecognizable, straying greatly from its original mission.
I’ve been doing these deep quarterly dives into GDXJ’s top components for years now. In Q3’17, fully 32 of the top 34 GDXJ components were also GDX components! These ETFs are separate, a “Gold Miners ETF” and a “Junior Gold Miners ETF”. So why on earth should they own many of the same companies? In the tables below I highlighted the rare GDXJ components not also in GDX in yellow in the weightings column.
These 32 GDX components accounted for 78.7% of GDXJ’s total weighting, not just its top 34. They also represented 31.4% of GDX’s total weighting. So almost 4/5ths of the junior gold miners’ ETF is made up of nearly a third of the major gold miners’ ETF! I’ve talked with many GDXJ investors over the years, and have never heard one wish their capital allocated specifically to junior golds would instead go to much-larger miners.
Fully 10 of GDXJ’s top 17 components weren’t even in this ETF a year ago in Q3’16. They alone now account for 34.5% of its total weighting. 16 of the top 34 are new, or 44.4% of the total. In the tables below, I highlighted the symbols of companies that weren’t in GDXJ a year ago in light blue. Today’s GDXJ is a radical departure from last year. Analyzing Q3’17 results largely devoid of real juniors is frustrating.
Nevertheless, GDXJ remains the leading “junior-gold” benchmark. So every quarter I wade through tons of data from its top components’ 10-Qs, and dump it into a big spreadsheet for analysis. The highlights made it into these tables. A blank field means a company didn’t report that data for Q3’17 as of that mid-November 10-Q deadline. Companies have wide variations in reporting styles, data presented, and report timing.
In these tables the first couple columns show each GDXJ component’s symbol and weighting within this ETF as of mid-November. While most of these gold stocks trade in the States, not all of them do. So if you can’t find one of these symbols, it’s a listing from a company’s primary foreign stock exchange. That’s followed by each company’s Q3’17 gold production in ounces, which is mostly reported in pure-gold terms.
Many gold miners also produce byproduct metals like silver and copper. These are valuable, as they are sold to offset some of the considerable costs of gold mining. Some companies report their quarterly gold production including silver, a construct called gold-equivalent ounces. I only included GEOs if no pure-gold numbers were reported. That’s followed by production’s absolute year-over-year change from Q3’16.
Next comes the most-important fundamental data for gold miners, cash costs and all-in sustaining costs per ounce mined. The latter determines their profitability and hence ultimately stock prices. Those are also followed by YoY changes. Finally the YoY changes in cash flows generated from operations, GAAP profits, revenues, and cash on balance sheets are listed. There’s one key exception to these YoY changes.
Percentage changes aren’t relevant or meaningful if data shifted from negative to positive or vice versa. Plenty of GDXJ gold miners that earned profits in Q3’16 suffered net losses in Q3’17. So in cases where data crossed that zero line, I included the raw numbers instead. This whole dataset offers a fantastic high-level fundamental read on how the mid-tier gold miners are faring today, and they’re actually doing quite well.
After spending days digesting these GDXJ gold miners’ latest quarterly reports, it’s fully apparent their vexing consolidation this year isn’t fundamentally righteous at all! Traders have abandoned this sector since the election because the allure of the levitating general stock markets has eclipsed gold. That has left gold stocks exceedingly undervalued, truly the best fundamental bargains out there in all the stock markets!
Once again the light-blue-highlighted symbols are new GDXJ components that weren’t included a year ago in Q3’16. And the meager yellow-highlighted weightings are the only stocks that were not also GDX components in mid-November! GDXJ is increasingly a GDX clone that offers little if any real exposure to true gold juniors’ epic upside potential during gold bulls. GDXJ has become a shadow of its former self.
VanEck owns and manages GDX, GDXJ, and the MVIS indexing company that decides exactly which gold stocks are included in each. With one company in total control, GDX and GDXJ should have zero overlap in underlying companies! GDX or GDXJ inclusion should be mutually-exclusive based on the size of individual miners. That would make both GDX and GDXJ much more targeted and useful for investors.
Two of GDXJ’s heaviest-weighted component choices are mystifying. Sibanye Gold and Gold Fields are major South African gold miners, way bigger than mid-tier status and about as far from junior-dom as you can get. In Q3’17 they both mined way in excess of that 250k-ounce quarterly threshold that is definitely major status. They are among the world’s largest gold miners, so it’s ludicrous to have them in a juniors ETF.
Since gold miners are in the business of wresting gold from the bowels of the Earth, production is the best place to start. These top 34 GDXJ gold miners collectively produced 4352k ounces in Q3’17. That rocketed 121% higher YoY, but that comparison is meaningless given the radical changes in this ETF’s composition since Q3’16. On the bright side, GDXJ’s miners do still remain significantly smaller than GDX’s.
GDX’s top 34 components, fully 20 of which are also top-34 GDXJ components, collectively produced 9947k ounces of gold in Q3. So GDXJ components’ average quarterly gold production of 136k ounces excluding explorers was 55% lower than GDX components’ 301k average. In spite of GDXJ’s very-misleading “Junior” name, it definitely has smaller gold miners even if they’re well above that 75k junior threshold.
Despite GDXJ’s top 34 components looking way different from a year ago, these current gold miners are faring well on the crucial production front. Fully 22 of these mid-tier gold miners enjoyed big average YoY production growth of 18%! Overall average growth excluding explorers was 8.2% YoY, which is far better than world mine production which slumped 1.3% lower YoY in Q3’17 according to the World Gold Council.
These elite GDXJ mid-tier gold miners are really thriving, with production growth way outpacing their industry. That will richly reward investors as sentiment normalizes. Smaller mid-tier gold miners able to grow production are the sweet spot for stock-price upside potential. With market capitalizations much lower than major gold miners, investment capital inflows are relatively larger which bids up stock prices faster.
With today’s set of top-34 GDXJ gold miners achieving such impressive production growth, their costs per ounce should’ve declined proportionally. Higher production yields more gold to spread mining’s big fixed costs across. And lower per-ounce costs naturally lead to higher profits. So production growth is highly sought after by gold-stock investors, with companies able to achieve it commanding premium prices.
There are two major ways to measure gold-mining costs, classic cash costs per ounce and the superior all-in sustaining costs per ounce. Both are useful metrics. Cash costs are the acid test of gold-miner survivability in lower-gold-price environments, revealing the worst-case gold levels necessary to keep the mines running. All-in sustaining costs show where gold needs to trade to maintain current mining tempos indefinitely.
Cash costs naturally encompass all cash expenses necessary to produce each ounce of gold, including all direct production costs, mine-level administration, smelting, refining, transport, regulatory, royalty, and tax expenses. In Q3’17, these top-34 GDXJ-component gold miners that reported cash costs averaged just $612 per ounce. That indeed plunged a major 6.9% YoY from Q3’16, and even 2.5% QoQ from Q2’17.
This was really quite impressive, as the mid-tier gold miners’ cash costs were only a little higher than the GDX majors’ $591. That’s despite the mid-tiers each operating fewer gold mines and thus having fewer opportunities to realize cost efficiencies. Traders must recognize these mid-sized gold miners are in zero fundamental peril as long as prevailing gold prices remain well above cash costs. And $612 gold ain’t happening!
Way more important than cash costs are the far-superior all-in sustaining costs. They were introduced by the World Gold Council in June 2013 to give investors a much-better understanding of what it really costs to maintain a gold mine as an ongoing concern. AISC include all direct cash costs, but then add on everything else that is necessary to maintain and replenish operations at current gold-production levels.
These additional expenses include exploration for new gold to mine to replace depleting deposits, mine-development and construction expenses, remediation, and mine reclamation. They also include the corporate-level administration expenses necessary to oversee gold mines. All-in sustaining costs are the most-important gold-mining cost metric by far for investors, revealing gold miners’ true operating profitability.
In Q3’17, these top 34 GDXJ components reporting AISC averaged just $877 per ounce. That’s down a sharp 3.7% YoY and 0.2% QoQ. That also compares very favorably with the GDX majors, which saw nearly-identical average AISC at $868 in Q3. The mid-tier gold miners’ low costs prove they are faring far better fundamentally today than traders think based on this year’s vexing sideways-grinding stock-price action.
All-in sustaining costs are effectively this industry’s breakeven level. As long as gold stays above $877 per ounce, it remains profitable to mine. At Q3’s average gold price of $1279, these top GDXJ gold miners were earning big average profits of $402 per ounce last quarter! That equates to hefty profit margins of 31%, levels most industries would kill for. The mid-tier gold miners aren’t getting credit for that today.
Unfortunately given its largely-junior-less composition, GDXJ remains the leading benchmark for junior gold miners. In Q3’17, GDXJ averaged $33.81 per share. That was down a serious 28.6% from Q3’16’s average of $47.38. Investors have largely abandoned gold miners because they are captivated by the extreme Trumphoria stock-market rally since the election. Yet gold-mining profits certainly didn’t justify this.
A year ago in Q3’16, the top 34 GDXJ components at that time reported average all-in sustaining costs of $911 per ounce. With gold averaging $1334 then which was 4.4% higher, that implies the mid-tier gold miners were running operating profits of $423 per ounce. Thus Q3’17’s $402 merely slumped 5.0% YoY, which definitely isn’t worthy of hammering mid-tier gold miners’ stock prices over a quarter lower over the past year.
Gold miners offer such compelling investment opportunities because of their inherent profits leverage to gold. Gold-mining costs are largely fixed during mine-planning stages, when engineers and geologists decide which ore to mine, how to dig to it, and how to process it. The actual mining generally requires the same levels of infrastructure, equipment, and employees quarter after quarter regardless of gold prices.
With gold-mining costs essentially fixed, higher or lower gold prices flow directly through to the bottom line in amplified fashion. That wasn’t really apparent in GDXJ over this past year since its composition changed so radically. Normally a 4.2% drop in average gold prices would lead to much more than a 5.0% YoY operating-profit decline. Gold-stock profits generally leverage gold price moves by several times.
Gold itself is overdue for a major new upleg driven by investment demand returning. As I discussed several weeks ago, investment demand has stalled thanks to the extreme stock-market euphoria. These bubble-valued stock markets are due to roll over imminently as the Fed and European Central Bank both start aggressively choking off liquidity. That will strangle this stock bull, reigniting big gold investment demand.
The impact of higher gold prices on mid-tier-gold-miner profitability is easy to model. Assuming flat all-in sustaining costs at Q3’17’s $877 per ounce, 10%, 20%, and 30% gold rallies from this week’s levels will lead to collective gold-mining profits surging 36%, 68%, and 100%! And another 30% gold upleg isn’t a stretch at all. In essentially the first half of 2016 alone after the last stock-market correction, gold surged 29.9%.
The major gold stocks as measured by the HUI, which closely mirrors GDX, skyrocketed 182.2% higher in roughly that same span! Gold-mining profits and thus gold-stock prices soar when gold is powering higher. So if you believe gold is heading higher in coming quarters as these crazy stock markets falter, the gold stocks are screaming buys today fundamentally. That’s especially true of the best mid-tier gold miners.
Since today’s bastardized GDXJ mostly devoid of juniors changed so radically since last year, the normal year-over-year comparisons in key financial results aren’t comparable. But here they are for reference. These top 34 GDXJ companies’ cashflows generated from operations soared 65% YoY to $1515m. That was driven by sales up 96% YoY to $4130m. That left miners’ collective cash balances $28% higher YoY at $5672m.
Yet top-34-GDXJ-component profits crumbled 38% YoY to $212m. Again don’t read too much into this since it’s an apples-to-oranges comparison. Interestingly a single company that was in GDXJ in both quarters is responsible for over 2/3rds of that drop. Endeavour Mining’s earnings plunged from +$24m a year ago to -$65m in Q3’17, largely due to a $54m impairment charge in its Nzema mine which is being sold.
GDXJ’s component list was much more consistent between Q2’17 and Q3’17. QoQ these top 34 GDXJ gold miners saw operating cash flows rise 3.9%, sales surge 7.5%, cash on hand fall 7.6%, and profits plummet 72%. Again an anomaly in a single company is responsible for nearly 9/10ths of this sequential decline. In Q2 IAMGOLD reported a gigantic $524m non-cash gain on the reversal of an impairment charge!
The massive non-cash gains and losses flushed through net income are one reason why all-in sustaining costs offer a better read on gold-miner health. If GDXJ’s component list and weightings finally stabilize after this past year’s extreme tumult, we’ll have clean comps again next year. For now these mid-tier gold miners are generally doing far better operationally than their neglected super-low stock prices imply.
So overall the mid-tier gold miners’ fundamentals looked quite impressive in Q3’17, a stark contrast to the miserable sentiment plaguing this sector. Gold stocks’ vexing consolidation this year wasn’t the result of operational struggles, but purely bearish psychology. That will soon shift as the stock markets roll over and gold surges, making the beaten-down gold stocks a coiled spring today. They are overdue to soar again!
Though this contrarian sector is widely despised now, it was the best-performing in all the stock markets last year despite that sharp post-election selloff in Q4. The HUI blasted 64.0% higher in 2016, trouncing the S&P 500’s mere 9.5% gain! Similar huge 50%+ gold-stock gains are likely again in 2018, as gold mean reverts higher on the coming stock-market selloff. The gold miners’ strong Q3 fundamentals prove this.
Given GDXJ’s serious problems, leading to diverting most of its capital inflows into larger gold miners that definitely aren’t juniors, you won’t find sufficient junior-gold exposure in this troubled ETF. Instead traders should prudently deploy capital in the better individual mid-tier and junior gold miners’ stocks with superior fundamentals. Their upside is vast, and would trounce GDXJ’s even if it was still working as advertised.
At Zeal we’ve literally spent tens of thousands of hours researching individual gold stocks and markets, so we can better decide what to trade and when. As of the end of Q3, this has resulted in 967 stock trades recommended in real-time to our newsletter subscribers since 2001. Fighting the crowd to buy low and sell high is very profitable, as all these trades averaged stellar annualized realized gains of +19.9%!
The key to this success is staying informed and being contrarian. That means buying low when others are scared, like late in this year’s vexing consolidation. An easy way to keep abreast is through our acclaimed weekly and monthly newsletters. They draw on my vast experience, knowledge, wisdom, and ongoing research to explain what’s going on in the markets, why, and how to trade them with specific stocks. Easy to read and affordable, they’ll help you learn to think, trade, and thrive like contrarians. Subscribe today, and get deployed in the great gold stocks on our trading books before they surge far higher!
The bottom line is the mid-tier gold miners now dominating GDXJ enjoyed strong fundamentals in their recently-reported Q3 results. While GDXJ’s radical composition changes since last year muddy annual comparisons, today’s components mined lots more gold at lower costs. These gold miners continued to earn hefty operating profits while generating strong cash flows. Sooner or later stock prices must reflect fundamentals.
As gold itself continues mean reverting higher, these mid-tier gold miners will see their profits soar due to their big inherent leverage to gold. GDXJ now offers excellent exposure to mid-tier gold miners, which will see gains well outpacing the majors. All it will take to ignite gold stocks’ overdue mean-reversion rally is gold investment demand returning. The resulting higher gold prices will attract investors back to gold miners.
Adam Hamilton, CPA December 1, 2017 Subscribe |
|||||||
|
|
|
|
|
|
|
|
|
|
|
|
|
|
|
|||