|
|
|||||||
|
|
|
|
|
|
|
|
|
|
|
|
|
|
|
|
|
|
|
Gold to Fuel Silver Upleg Adam Hamilton March 27, 2015 2979 Words
Silver reversed sharply higher over the past week or so, surging dramatically. This was just after it had successfully retested major secular lows, ramping the odds this strong buying is the vanguard of a long-overdue major new upleg. As usual, silver’s coming gains will be fueled by gold’s own advance. As the yellow metal mean reverts higher initially on heavy futures short covering, capital will flock back to silver.
Silver is a fascinating market. It’s undeniably primarily an industrial metal, as the latest annual data from the world’s leading authority on silver supply and demand shows. The venerable Silver Institute reports that fully 54% of global silver demand in 2013, and 62% in 2012, was for industrial fabrication. In those same years, worldwide investment demand (coins, bars, ETFs) accounted for just 23% and 20% respectively.
Nevertheless, for millennia silver has also attracted investors as a precious metal and governments as a hard currency. From time to time silver captivates investors again, and they flood into this relatively tiny market and bid silver prices sharply higher. These large investment-demand spikes quickly overwhelm the normally-dominant industrial demand, which is naturally slow to change. So silver is catapulted higher.
The magnitude of these investment-driven silver surges can be enormous, multiplying fortunes rapidly. The greatest ones are the stuff of legend, and have left silver with something of a cult following. This volatile metal is always being watched by contrarian investors, who are ready to return when it starts running again. And there is a single overwhelmingly-dominant catalyst that brings investors running back.
The price of gold. Almost without exception, all of silver’s biggest and strongest spikes, uplegs, and bull markets in modern history have been fueled by parallel gold rallies. From an investment perspective, silver is ultimately just a leveraged play on gold. If you want to mischievously provoke hardcore silver zealots, call silver “gold’s little lapdog”. Silver investment demand is almost totally dependent on gold’s fortunes.
The historical data proves this in spades, it is unassailable. Gold drives silver, full stop. Silver prices are super-highly-correlated with gold prices over any reasonable period of time. Silver’s rallies, uplegs, and bull markets correspond almost exactly with gold’s rallies, uplegs, and bull markets. Investors return to silver when gold is strong, and abandon silver when gold is weak. Gold is the key to silver investment demand.
This is true even over the past couple years, which have been extraordinarily anomalous. Way back in late 2012, the US Federal Reserve launched its wildly-unprecedented open-ended third quantitative-easing campaign. Nothing like QE3 had ever happened before, and it along with high Fed officials’ associating jawboning epically distorted the stock markets. QE3 is what drove the past couple years’ levitation.
The Fed’s direct QE3 Treasury monetizing held interest rates artificially low. This enabled corporations to borrow over a trillion dollars very cheaply, which they used to buy back their own stocks. These vast buybacks greatly boosted the broader stocks markets. Meanwhile, the Fed kept implying to stock traders that it was backstopping these anomalous markets, ready to ramp up QE3’s size to arrest any material selloff.
Thus the Fed’s QE3 campaign radically altered investor sentiment and capital flows. Everyone wanted to buy high in overvalued, overextended, and euphoric stock markets. The Fed hypnotized traders into believing stock markets only rise, that there was no significant downside risk. And as stocks surged, demand for alternative investments that move contrary to stock markets like gold and silver collapsed.
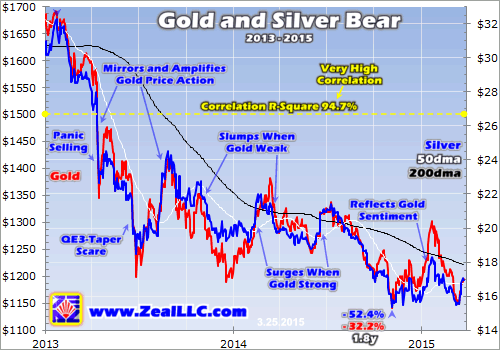
Since nothing like QE3 had ever happened before, the resulting bear-market slide in precious-metals prices is also largely unparalleled. This first chart looks at silver and gold prices over the past couple years or so, the era of the Fed’s QE3 stock-market levitation. And even in one of the most extreme and artificial environments imaginable for silver investment demand, silver prices still mirrored gold’s nearly perfectly.
Statisticians measure data correlations through a construct known as the coefficient of determination. It’s also called R squared, because it is calculated by multiplying the correlation coefficient, symbolized as R, by itself. I bastardize this to r-square, as it flows better in writing. R-square effectively reveals how much movement in one dataset is directly mathematically related to movement in another dataset.
Since the dawn of 2013 when the Fed’s epic QE3 anomaly got underway, silver and gold have had a correlation r-square of 94.7%! That means nearly 95% of silver’s daily price action is directly explainable by gold’s daily price action, or vice versa. And there’s zero doubt about the direction of causality, gold is driving silver and not the other way around. This truth isn’t evident in a chart, it comes from experience.
I’ve been investing for decades, but have spent the last 15 years or so intensely focused as a dedicated student of the markets. In addition to endless research, data-crunching, and writing, a critical part of this is watching the markets all day everyday. When you spend all those years observing how prices react in real-time, causality becomes readily apparent. While many things move gold prices, only one really moves silver.
Like silver, gold prices are affected by shifting sentiment that alters investment and speculation demand. Major catalysts for this range from stock-market fortunes, to how the US dollar is faring, to releases of major US economic data, to a wide range of publications and comments by the Federal Reserve and its officials. The large gold market moves first when sentiment shifts, then the small silver market follows.
This reaction is usually rapid, happening within minutes when gold moves significantly. And as long as that gold trend lasts, hours, days, weeks, months, even years, silver tends to mirror and amplify gold’s price action. Silver surges when gold is strong, and slumps when gold is weak. In a very real sense, silver is a gold sentiment gauge. Investors and speculators only flood into it when they are bullish on gold.
When gold plummeted in the second quarter of 2013 first on panic selling as major multi-year support failed then later on the Fed’s QE3-taper scare, silver plummeted with it. When gold surged sharply on heavy short covering in the third quarter of 2013, silver surged right along with it. This decades-old trading pattern continued last year, silver dutifully rallying with gold and selling off with gold like always.
Whether you look at the past couple years or four decades, gold fuels silver. And within the Fed’s extreme QE3 anomaly since early 2013, which is starting to unwind, almost 95% of silver’s daily price action was directly explainable by gold’s own. This is stunning, as it necessarily means everything else is in the remaining 5%! Just think of the endless commentaries written on silver, ex-gold they’re barely material.
Because of gold price action’s overwhelmingly-dominant impact on silver sentiment among investors and speculators, gold trumps everything else silver-related. This includes worldwide silver supply-and-demand fundamentals, silver technicals, even silver conspiracy theories. If you want to multiply your capital in silver by buying it low then later selling it high, all that really matters is what gold is going to do.
Back in early November 2014, silver collapsed to a brutal 4.7-year low of $15.37. The Fed’s crazy stock-market levitation had gutted demand for all alternative investments, they were starving for capital and rotting into oblivion. Then just a couple weeks ago, silver slumped again to $15.48. This was less than 1% above that secular low. But silver’s low retest proved successful thanks to gold’s subsequent sharp surge.
In these grossly-distorted markets of the past couple years, the lion’s share of big moves have been driven by the Fed. Its Federal Open Market Committee that manipulates interest rates and prints money meets 8 times a year, and its latest decision was just released on March 18th. And again the Yellen Fed pulled out all the stops to portray itself as dovish, signaling that rate hikes were likely to be delayed and gradual.
The US dollar, which had been rocketing parabolic on rate-hike hopes, collapsed on that. This helped ignite a sharp gold rally as futures speculators scrambled to cover extreme shorts. And naturally as gold surged, silver joined it. Over four trading days starting on that FOMC meeting, gold powered 3.7% higher which silver really amplified to a big 9.8% gain. And I suspect that gold-fueled silver buying is only beginning.
With the Fed’s stock-market levitation seducing investors away, the gold price action in the past couple years has been totally dominated by American futures speculators. When they sell aggressively, gold tanks. When they buy aggressively, gold surges. And since their selling has been so extreme in the past couple of months, they have big near-term buying left to do which will catapult gold and therefore silver higher.
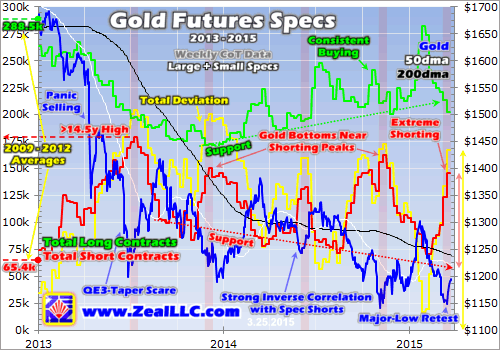
This next chart looks at American speculators’ total positions in gold-futures contracts, both long-side bullish bets and short-side bearish ones. This data is published once a week by the CFTC in its famous Commitments of Traders reports. The latest read before this essay was published reflected these bets as of Tuesday March 17th. And boy were they bullish for gold, which portends a major parallel silver rally.
After its deep early-November secular low, gold was doing really well heading into early 2015. By late January it had powered 14.2% higher to $1303. But then for reasons including the surging US stock markets and US dollar, American futures speculators started to aggressively dump gold. This is readily apparent in this chart, in the recent sharp drop in long-side contracts and sharp rise in short-side ones.
Between late January and this latest CoT report, this single group of traders liquidated an astounding 79.4k long-side contracts. Since each contract controls 100 ounces of gold, this is equivalent to 247.0 metric tons! That is far too much gold supply too quickly for normal gold investment demand to absorb, so gold prices started crumbling. This heavy selling forced speculators’ total bullish bets back under support.
And futures speculators also simultaneously piled on to the short side, exacerbating gold’s sharp selloff. Between early February and this latest CoT report, they sold short 75.8k contracts! They were effectively borrowing gold they didn’t have, dumping it into the market, and hoping to buy it back later at some lower price to repay their debts. This extreme shorting added the equivalent of another 235.8t of gold supply.
Add that up, and in just 6 to 7 weeks American futures speculators alone spewed an astounding 482.9t of gold into the markets! It’s actually an incredible testimony to the strength of latent gold investment demand that this metal didn’t just collapse under such a brutal onslaught. According to the World Gold Council, in all of 2014 global gold investment demand ran 904.6t. Over half of that supplied in weeks is staggering.
Gold only fell 11.8% on that deluge of futures supply, and silver was very resilient with a mere 15.2% loss of its own. Usually silver really leverages gold’s downside too. Silver is looking so bullish today because this extreme gold-futures selling is reversing into buying. We’ve already seen that start since that latest FOMC meeting, which happened to come the very next day after this latest CoT positions data.
The ironic thing about futures speculators, who are considered very sophisticated traders, is they are terribly wrong as a herd at extremes. They are the most bearish right as prices are low and bottoming, as evidenced by high short positions and low long positions. This chart highlights short peaks in red, and all of them occurred when gold was in the process of bottoming right before a major new rally got underway.
While futures speculators have no obligation to reestablish long positions, they are legally required to cover their shorts. The past couple months’ big gold-futures shorting binge was one of the most extreme ever witnessed from a variety of metrics. That left speculators with a whopping 146.2k gold-futures contracts they had borrowed and sold, one of the highest levels in history. These must soon be reversed.
Futures speculation is a radically-riskier endeavor than stock trading. Not only is it a zero-sum game where every dollar won is a direct dollar lost by an opposing trader, but the leverage available is far beyond extreme. The maintenance margin for a single gold-futures contract controlling 100 ounces of gold worth $120,000 at $1200 is merely $4000. That means traders’ leverage can run as high as 30 to 1!
30x leverage is terrifying, as a mere 3.3% move against a futures bet supported by minimum margin will wipe out 100% of a trader’s capital risked. In the stock markets, leverage has been legally limited to just 2x since 1974. Whenever gold started rallying again, which happened in spades after that latest FOMC meeting, these futures speculators would be forced to cover or face catastrophic losses of their capital.
The only way to cover futures shorts is to buy offsetting long contracts to close them. The upside price impact of adding new longs and buying longs to cover shorts is identical. So all the extreme gold-futures short selling of recent months would soon reverse into major buying. And given how high speculators’ total short bets were, the subsequent buying was guaranteed to be big. This chart helps understand why.
The Fed’s anomalous stock-market levitation sparked such extreme short selling that gold suffered its worst quarter in 93 years in Q2’13! Those initial lows around $1200 have essentially held in all of the subsequent speculator gold-futures shorting spikes since. After each shorting binge, speculators were quick to cover and push their bearish bets back down to support. That’s where their exposure wasn’t excessive.
Today that speculator short-position support line is around 60k contracts, or 75k if you want to consider support in horizontal terms. Merely to return to these normal levels, American speculators will have to buy to cover either 86.2k or 71.2k contracts in a matter of weeks to months on the outside. This is the equivalent of 268.2t or 221.5t of gold, both enormous amounts! This will certainly catapult gold sharply higher.
Now remember the latest CoT data by the time this essay was published was as of the afternoon before that latest FOMC meeting ignited this inevitable gold-futures short covering. So some fraction of this has already happened. But we’re only a week into a process that has generally taken a couple months to unfold after the other major shorting peaks of the past couple years. So this gold-futures buying is far from over.
Gold rallied pretty dramatically in the past short-covering frenzies, despite still facing howling headwinds in the form of the levitating US stock markets and the US dollar shooting parabolic. As this latest short-covering episode gets underway, these are shifting to tailwinds as the euphoric US stock markets and US dollar weaken. So this next gold rally initially sparked by futures short covering is likely to grow much larger.
Not only will other futures speculators pile in to chase gold’s upside with new long-side bets, but legions of investors will return via gold ETFs and physical bullion. And as gold powers higher, silver is going to leverage its gains like usual. The first chart illustrated that silver is super-highly-correlated with gold, and mirrors and amplifies its moves. And the second one shows that gold is in for a major short-covering rally.
So with big gold buying fueling silver, the white metal is likely early on in its next major upleg. Investors and speculators alike can capitalize on silver’s next big move in several ways. They can go the traditional route and buy silver coins and bars. Stock traders can deploy capital in the silver ETFs to obtain the same portfolio exposure. These are led by the flagship iShares Silver Trust, which trades under the symbol SLV.
But silver itself and the silver ETFs will merely pace silver’s advance at best. Traders looking to leverage silver’s next upleg can do it with the beaten-down silver stocks. Since silver has fallen so deeply out of favor, the stock prices of the best silver miners and explorers are absurdly cheap. They are discounting a nonsensical future where silver never materially rallies again. So when it does, they’re going to soar.
At Zeal we’ve been intensely studying and trading silver stocks for well over a decade. Just last week, we finished our latest 3-month research project trying to uncover the silver miners and explorers with the best fundamentals even at today’s depressed prices. Our dozen favorites are profiled in depth in a fascinating new 24-page report. Buy yours today, learn about these elite silver stocks, and get deployed at fire-sale prices!
We’ve also long published acclaimed weekly and monthly newsletters for contrarian speculators and investors. They draw on our decades of hard-won experience, knowledge, wisdom, and ongoing research to explain what’s going on in the markets, why, and how to trade them with specific stocks. With major changes afoot in these markets, cultivating a studied contrarian perspective has rarely been more important. Subscribe today!
The bottom line is silver looks to be embarking on a major new upleg, as it just reversed sharply higher after a successful retest of major secular lows. This initial strong silver buying was fueled by major short covering in gold futures, a multi-month process that’s likely just getting underway. Silver sentiment has always been highly dependent on gold’s fortunes, since traders overwhelmingly focus on it to time silver moves.
Over the anomalous past couple years where markets were grossly distorted by the Fed, almost 95% of silver’s daily price action was directly explained by gold’s own. This gold dominance of silver will likely continue as the Fed starts normalizing policy, reversing the market extremes it spawned. So as the gold price mean reverts higher, investors and speculators will flood back into silver and ultimately catapult it to huge gains.
Adam Hamilton, CPA March 27, 2015 Subscribe |
|||||||
|
|
|
|
|
|
|
|
|
|
|
|
|
|
|
|||