|
|
|||||||
|
|
|
|
|
|
|
|
|
|
PM Summer Doldrums 4 Adam Hamilton July 13, 2012 2647 Words
With gold, silver, and their minersí stocks drifting listlessly near correction lows, the sentiment in precious-metals land is even more pessimistic than usual. Bears abound while bulls are now an endangered species. But interestingly, demoralizing consolidations are par for the course this time of year. Throughout most of their secular bull, the precious metals have suffered during the summer doldrums.
Back in the era of wind-powered tall ships, the doldrums were the name given to the areas of the oceans near the equator where prevailing winds often didnít exist. These periods of dead calm meant there was no wind for sails, trapping ships for days or even weeks. Many years ago I thought this was a great analogy for how PMs feel in the summer. They drift lethargically and all hope for progress vanishes.
The ironic thing is even though this phenomenon happens nearly every summer like clockwork, it always crushes sentiment. The great majority of traders arenít disciplined enough to study the markets and learn their rhythms, so each year the PM summer doldrums discourage them anew. It is amusing in a way, but also sad since the resulting poor sentiment bleeds everywhere eroding the resolve of all PM traders.
The best way to combat this irrational bearishness is to understand why it happens and how it tends to look in terms of prices. Naturally gold is the key to the entire precious-metals realm, silver and the PM stocks merely follow its lead. The reason gold prices slump to a long seasonal ebb in summer is because this metalís primary driver, global investment demand, is very uneven across a typical calendar year.
While worldwide gold demand sees big spikes in autumn, winter, and spring for various income-cycle and cultural reasons, there are simply none during the summer. If you are not familiar with the strong seasonality gold exhibits, you can get up to speed with one of my gold-bull-seasonals essays. There are no big buying catalysts in summer, and vacationing traders arenít all that interested in the markets anyway.
In orbital-mechanics terms, summer starts at the summer solstice in late June (longest day of the year) and ends at the autumnal equinox in late September. But in financial-market terms, summer is simply considered to be calendar June, July, and August. It is these market summers over which the precious metalsí performance needs to be considered. Understanding them will steel you against PM despair.
But we canít do a straight price comparison across summers, as prevailing price levels have climbed dramatically throughout goldís secular bull. Back in 2001 in the early days, gold averaged just $272 on close that summer. But by last summer (2011), the average gold price had soared 498% higher to $1627. Obviously a $10 move in 2001 was far more significant than the same move a decade later.
To make all the precious-metals summers perfectly comparable in percentage terms across their entire secular bull, we have to individually index them. So this thread of research indexes each summer for gold, silver, and the flagship HUI gold-stock index. Each index is set at 100 as of the close on the last trading day of May. That way any given percentage move looks the same regardless of base price levels.
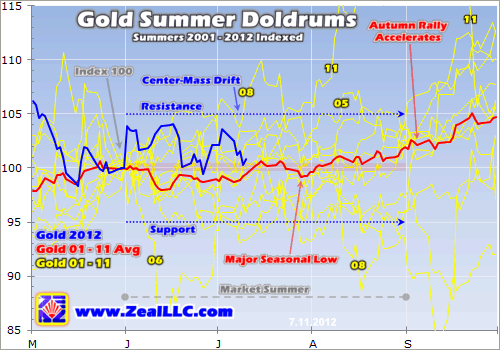
Rendering these individual summer indexes on charts is very illuminating. Each summer from 2001 to 2011 is shown in yellow. While this looks like a mess of spaghetti on these charts, it reveals general trends and outlying summers. All 11 of the indexes from these previous summers are then averaged, the red line. This shows the prevailing trend. Finally our current summer to date is superimposed in blue.
And we have to start with gold, since its fortunes drive silver and precious-metals stocks. When gold is strong, the rest of the PM realm leverages its gains. When gold is weak, its losses are amplified. And in the dead calm of the summer doldrums, gold tends to drift along listlessly with no wind for its sails. How can traders expect upside action in silver and PM stocks when gold is lethargically consolidating?
And lethargically consolidate gold does, as you can see here. The red average of all the yellow individually-indexed summers from 2001 to 2011 is pretty flat. For its entire bull, on average this metal has spent summers drifting from 2% below to 2% above its market-summer starting point at the end of May. A 2% move either way over a 3-month period is hardly noticeable, essentially purely sideways.
And before goldís magnificently-bullish anomaly last summer, goldís average summer performance was indeed dead flat with a downside bias. My last essay in this series has a similar chart from before the wild summer-2011 surge. But even that amazing event didnít alter goldís average summer performance much. Without any major income-cycle or cultural buying catalysts this time of year, gold just drifts.
As the individually-indexed summers in yellow show, the center mass of this drift is between 95 and 105 in indexed terms. Gold tends to stay between 5% below to 5% above its final May close the great majority of the time in June, July, and August. As you can see above, contrary to all the pessimism today gold has actually done quite well so far in this summer of 2012. It spent much of June high in its trading range.
There are outlying summers of course, where one-off factors lead gold to break out of its usual summer-doldrums consolidation to both the downside and upside. Back in June 2006, gold plunged in a sharp correction after rocketing to a major new bull-market high in May. And in August 2008, this metal sold off sharply as a global bond panic ignited a gargantuan US dollar surge that hammered gold prices.
There were upside outliers too. Back in July 2008 gold powered higher rapidly as commodities prices reached a then all-time high before that autumnís once-in-a-lifetime stock panic obliterated them. And of course last August gold skyrocketed on last summerís contentious debt-ceiling debate in the US. With traders believing there was actually a risk of a default on US Treasuries, safe-haven capital fled to gold.
While these occasional outliers really capture tradersí attention, and sometimes distort their perception of how gold usually performs in the summer, they are short-lived. After falling below the center-mass driftís support in 2006 and 2008, gold soon returned to trend. And after surging above the usual summer-consolidation resistance in 2008 and 2011, gold soon fell sharply to reenter the trend channel.
Last year this reversion happened later in September, when gold plunged as you can see on this chart. The point is goldís seasonal tendency to drift sideways in the summer doldrums is so darned strong that even rare breakouts never last. Given its price history for this entire bull in June, July, and August, there is simply no reason to expect anything more than a boring sideways consolidation during any summer.
Yet every year, traders wail and gnash their teeth about goldís poor summer performance. Have they no charts? Is that particular summer the first theyíve ever experienced? It is amazing how few traders take the time to consider price action within historical context. Without that knowledge, they are doomed to make poor decisions. And selling low near goldís major seasonal low in late July is a big one.
Nearly every summer, there is widespread capitulation in gold, silver, and the PM stocks over the next couple weeks. Both speculators and investors somehow hoping for gold to miraculously buck its decade-old summer trend and surge are sorely disappointed. So they whine and cry and dump their positions at exactly the wrong time. Late July marks goldís major seasonal low ahead of its massive autumn rally.
And you can clearly see that autumn rally accelerating in September on this chart. After struggling all summer just to maintain its late-May levels, on average gold has powered 5% higher by late September. So if you can hold on through the summer doldrums, ignore the ubiquitous bearish psychology and sit tight, usually you will be richly rewarded in autumn when major seasonal gold-buying spikes return.
And this is not very hard if you understand these summer doldrums. Because of this ongoing research weíve been doing for many years now, I never expect anything but drifting from PMs in the summer and advise our subscribers to do the same. If you canít handle the psychological stress of a sideways grind, you can simply put your head in the sand and ignore the markets for a few months. Go on vacation!
While silver has a fanatical following, technically it is merely goldís lapdog. Throughout its entire secular bull the only times it has surged are when strong gold prices ignite interest in the precious metals. While there are a handful of short-lived exceptions, the vast majority of the time silver canít do anything unless gold is being bid higher fast enough to be exciting. So naturally silver doesnít fare well in summer either.
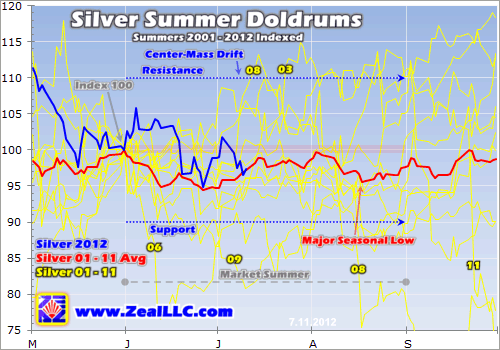
Every summer without fail, I get dozens of anguished e-mails from silver enthusiasts wondering why the white metal canít make any headway. But as this chart shows, there is no reason to expect it to during the PM summer doldrums. Silverís average summer performance is even considerably worse than goldís, drifting between its May close and 5% lower. And silverís autumn rally also starts later on average.
Silver is a hyper-speculative metal that needs excitement in order to thrive. Capital only floods in when traders expect a major surge in gold. And since these are very rare in the summer, silver almost always has a hard time catching a bid. Note in this chart that the yellow outliers above the center-mass driftís resistance are much more muted than goldís, while downside outliers are more common.
Silver tends to drift between 10% above to 10% below its May close in any given summer, with a definite downside bias as evidenced by the preponderance of indexed summers and the sub-100 average. While silver indeed has great potential to soar and leverage goldís gains, June, July, and August is simply not the time to look for one of its periodic spikes. Silver is dead in the summer, trapped in the doldrums.
But despite all the silver bearishness out there, silverís action in early June was its best of this bull as the blue line shows. And despite the slide since, this metal has still managed to remain above its long-term summer average on balance. So while you wouldnít know it without this context, silver is actually exhibiting considerable relative strength this summer. But the odds argue it will still likely end August close to late Mayís levels.
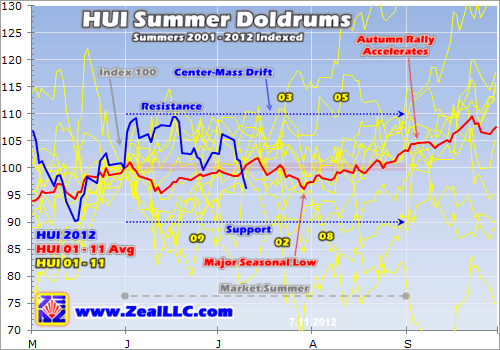
Provocatively even though they are doomed to grind sideways in the summers too, gold stocks fare considerably better than silver this time of year. This last chart looks at the flagship HUI gold-stock index with the same individually-indexed methodology to keep all summers perfectly comparable in percentage terms. Realize that gold stocks actually start rallying on average well before the market summer ends!
This year the HUI has enjoyed a strong early summer as well, although it knifed below its average summer performance this week. Like silver, in general it tends to consolidate between 90 to 110 indexed. It is interesting that this 10% above and 10% below is double goldís 5% above and 5% below for both the HUI and silver. These subordinate precious-metals plays indeed leverage the price action in gold itself.
But unlike silver, after getting sucked into goldís major seasonal low in late July the gold stocks start rallying dramatically on average in August. In indexed terms between late July and the end of August the HUI tends to climb from around 96 to 103 or so. This is a sizable rally in percentage terms, and one speculators and investors definitely want to catch. And it soon accelerates in autumn with goldís rally.
By late September the HUI tends to approach 110 indexed. So from late July to late September, gold stocks as a group have advanced nearly 15% on average throughout this entire secular bull. This is a heck of a rally! And the only way to ride it is to be a contrarian and fight the crowd. When everyone else is convinced gold stocks are heading much lower in late July, you have to buy then or hold on to what you have.
But even with this August rally, the gold stocks donít tend to end the summer much higher than they started it. Seeing the HUI up 3% on average over a 3-month span is certainly not enough to generate any excitement. And this is why gold-stock traders have to steel themselves from the dreadful sentiment wasteland spawned by the summer doldrums. It is hard not to sell when everyone else loses hope.
Understanding the strong gold seasonals is essential for all speculators and investors participating in this wildly-profitable precious-metals secular bull. There are times of the calendar year where big demand spikes emerge around the world which quickly push gold higher. But there are other times when demand is flat so gold makes little progress. And the biggest and longest by far is the summer doldrums.
How on earth can sideways-grinding precious-metals prices demoralize traders in June, July, and August when this is what they always tend to do during the market summers? When you donít expect too much, you canít be let down. And the lackluster historical gold, silver, and HUI price action during the summers certainly proves that it is irrational to expect anything more than a listless drift during this long seasonal lull.
At Zeal we are always prepared for the PM summer doldrums. If the gold stocks enjoyed a strong spring rally, we usually realize the lionís share of our profits by early June. And unless there is a compelling company-specific reason, we try not to sell when everyone else is this time of year. When those usual late-July seasonal lows in gold and the HUI roll around, we often capitalize on the poor sentiment to buy new positions low ahead of the autumn rally.
And this year is no exception. We have some amazing high-potential gold stocks on our books right now that are weak because of the usual summer pessimism. And we will likely add more around late July and early August. So if you are one of the few remaining contrarians strong enough to buy low when everyone else is scared, get ready. You can research some of the worldís most-promising gold juniors in our latest fascinating 27-page fundamental report on our dozen favorites. Buy yours today!
And instead of being worried all the time about the markets, you can gradually learn to thrive through our acclaimed weekly and monthly subscription newsletters. In them I draw on our vast experience, knowledge, wisdom, and ongoing research to explain what the markets are doing, why, where they are likely heading, and how to trade them with specific stock trades as opportunities arise. Subscribe today!
The bottom line is the summer doldrums almost always trap the precious metals in a listless, demoralizing drift. After over a decade of June, July, and August grinding, traders really ought to expect nothing more during this seasonal ebb. While upside breakouts from the usual drifts can happen occasionally, even they are short-lived. Without major gold-demand spikes, summer simply has no sizable buying catalysts.
For speculators and investors aware of this tendency, all it takes is a little patience to weather precious-metals summers. But sadly the majority of traders refuse to study the markets and advance their knowledge, so every summer their depression returns anew and they foolishly sell low. Thankfully we can take advantage of this mistake, and buy low to load up our books ahead of the big autumn rallies.
Adam Hamilton, CPA July 13, 2012 Subscribe |
|||||||
|
|
|
|
|
|
|
|
|
|
|
|
|
|
|
|||


