|
|
|||||||
|
|
|
|
|
|
|
|
|
|
|
|
|
|
|
|
|
|
|
Stock Fear Ceiling Adam Hamilton August 26, 2011 2923 Words
Fear is the greatest buy signal ever seen in the stock markets. This overpowering emotion flares fast, driving excessive selling that rapidly hammers stock prices down to irrational oversold levels. These fear-driven lows are the ideal time for investors and speculators to buy low, necessary before selling high later. Provocatively stock fear has an effective ceiling, absolute levels that demand aggressive buying.
I mentioned this stock fear ceiling in passing a couple weeks ago in my latest essay on trading stock fear. I heard from a surprising number of traders interested in this concept, for good reason. If stock fear has a ceiling, it would flag the highest-probability-for-success buying opportunities ever seen. Whenever this ceiling was hit in the future, it would be the ultimate signal to boldly deploy capital regardless of events.
While fear is ethereal and can’t be measured directly, plenty of sentiment indicators infer it. The most popular by far is the famous VIX (pronounced “vicks”). Discussed often in the financial media, this measures the implied volatility of certain S&P 500 index options. The S&P 500 (SPX) is America’s flagship stock index tracking this nation’s biggest and best companies, and the best proxy for the stock markets as a whole.
The VIX uses complex formulas to analyze and weight SPX options prices expiring over the next 30 calendar days. Traders are constantly buying and selling options based on their own near-future outlook, which bids up or drives down specific options’ prices. The aggregate of all this short-term SPX options trading is distilled down into implied volatility, or how volatile options traders as a group expect the stock markets to be.
The VIX expresses this construct as an annualized percentage. A 20 VIX reading implies that options traders expect to see the SPX move up or down at an annualized rate of 20% over the next 30 calendar days. Since fear is a far-more immediate and powerful motivator than greed, options volatility soars after major selloffs (the time to buy low) before waning to insignificance after major rallies (the time to sell high).
Despite the VIX’s popularity, it is a watered-down usurper. Today’s VIX was created in September 2003 to replace the classic VIX, which is now known as the VXO. That original VIX only looked at options for the elite S&P 100, the top 20% of S&P 500 companies. And it only used at-the-money options. While this methodology lives on in the VXO, the new VIX changed how it is calculated. Today’s VIX considers options for the entire S&P 500, including out-of-the-money ones. This makes it less responsive to fear.
This is a problem for a fear gauge. During sharp selloffs that spark intense fear, the first stocks to be sold are the biggest and most-liquid ones. They have the large volumes and liquidity necessary to absorb the widespread exodus of capital without suffering anywhere near as much price damage as smaller less-liquid companies. And at-the-money options’ prices are always quicker to respond (with bigger moves) than out-of-the-money ones. So while the new VIX works, the classic VXO remains superior.
Fear shows up quickest and largest in at-the-money options representing the largest and most-liquid companies in the US stock markets. Thus I continue to use the original classic-formula VIX, now known as the VXO, in my stock-market-sentiment research. If you prefer the new-formula VIX, it would still lead to the same conclusions. A less-responsive thermometer still gives you the temperature. But with its history only extending back to 2003, its track record pales in comparison to the VXO’s since 1986.
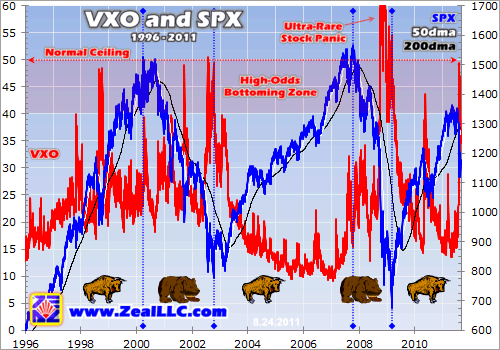
As the classic fear gauge, the VXO is the best sentiment indicator to flesh out the concept of a fear ceiling in the stock markets. This first chart shows the SPX superimposed over the VXO since 1996. While the VXO’s history extends back a decade earlier, there was only one major fear spike in that entire span. So the past 15 years out of the last quarter-century are the relevant ones to illustrate the fear ceiling.
And these 15 years have been extraordinary indeed! They witnessed the once-in-34-years transition from secular bull to secular bear in early 2000 as the Long Valuation Wave crest passed. They saw three cyclical bulls alternating with two cyclical bears within these longer secular trends. They encompassed booms and busts, a popular tech-stock mania and a stock panic, sovereign-debt defaults and currency routs, wars and political turmoil, unprecedented terrorist attacks, and every kind of disruption under the sun. It’s hard to imagine a more extreme 15-year period!
Yet despite all this, with one notable exception I’ll get to later the VXO never materially exceeded 50. A 50ish VXO is the absolute fear ceiling of the stock markets in normal conditions, meaning times when an ultra-rare panic or crash is not upon us. At every single one of these 50ish approaches in the past 15 years, traders were utterly terrified, convinced the stock markets were thundering off a cliff. Yet fear still didn’t surge any higher, I suspect it couldn’t. VXO 50 is the effective limit.
When you think back to some of these events that spawned extreme fear, like August 1998’s Russian debt default or the September 2001 terrorist attacks in the US, it’s hard to imagine anything scarier. These events and several others galvanized the whole world, sparking extraordinary anxiety and fear. Other than ridiculous scenarios like global thermonuclear war or an alien invasion, it’s hard to imagine traders worldwide being any more frightened.
Yet the VXO still peaked near 50 consistently. A 50 VXO means the annualized change options traders expected in the stock markets over the coming calendar month was 50%! At VXO 50 options traders believe there is a one-standard-deviation chance (68%) that the S&P 100 (and broader SPX) will either soar or plunge at a 50% annualized rate over the next 30 days. This obviously isn’t sustainable.
Whenever traders are terrified enough to expect such gigantic moves, which only happens after extreme selloffs, the selling has already passed. Fear works this way in general too, with its maximum levels happening just as the threat is gone. In a haunted house for example, it is anticipation that builds fear. Once the actor with the bloody mask and chainsaw jumps out and screams at you, peak fear has already passed. When options traders expect the worst is exactly when the worst has just been seen.
Yes, stock panics and crashes like 2008’s and 1987’s see fear soar to a whole new level and shatter the VXO 50 ceiling shown above. But these events are exceedingly rare, and only happen at very specific times in the bull-bear cycles. They are essentially once-in-a-generation fear super-spikes. In normal market conditions that aren’t panics and crashes, 99%+ of the time, VXO 50ish is fear’s absolute ceiling.
The stock markets can be viewed as an endless sentiment wave oscillating between extreme fear and extreme greed. If you want to buy low and sell high, you have to “be brave when others are afraid, and afraid when others are brave” as legendary contrarian investor Warren Buffett put it. This means buying when everyone else is scared (high VXO), and selling when everyone else is greedy (low VXO).
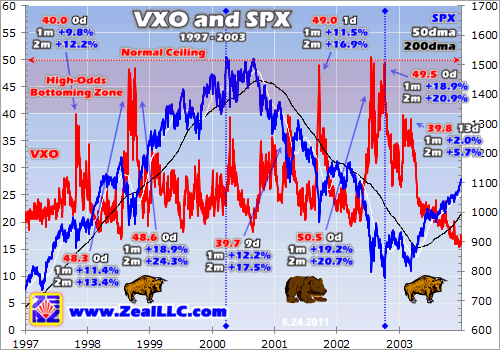
The next two charts zoom in to show all the VXO 50 episodes of the past 15 years in more detail. Since fear mushrooming extreme enough to slam into this absolute ceiling is pretty rare, I also considered lesser fear spikes running from roughly VXO 40 to VXO 50. This is the high-probability bottoming zone all investors and speculators should welcome with open arms.
Every VXO closing high is labeled, along with the number of days it is offset from the actual bottom in the SPX. Normally this is zero, VXO highs occur exactly on major SPX lows. But sometimes the stock markets will grind along and take a week or two to bottom, slumping to a slightly-lower secondary low after fear is already bleeding off. In addition, the best SPX gains seen within the immediate subsequent one-month and two-month periods following each VXO high are noted.
As you can see, buying fear spikes is incredibly profitable. It doesn’t matter whether the stock markets happen to be in a secular or cyclical bull or bear, they always rally sharply after fear grows too extreme. The excessive fear forces stock prices to be battered down to irrational oversold levels, so as that unsustainable fear inevitably abates stocks soar as capital floods back in. The gains are huge!
This essay would grow far too long if I analyzed every major VXO high in detail. But take a look at the kinds of gains across all of them. On average over this incredibly-chaotic span between 1997 and 2003, the SPX soared 13.0% sometime within the first month after a VXO peak and 16.4% sometime within the first two. After extreme fear comes extreme rallies, running as high as +19% within one month and +24% within two!
These are not only incredibly-large and fast gains, but they are in the broader markets. Many investors and speculators prefer individual stocks in leveraged sectors like commodities or technology. Since these high-flying popular stocks are battered much lower during fear spikes, they soar much faster coming out of them. Their gains often double or triple those seen in the broader SPX. Buying great commodities stocks during extreme fear spikes can easily yield 50%+ gains within a couple months!
Since these awesome buying opportunities are rare, as the VXO doesn’t often soar into the 40s or hit its 50 ceiling, contrarian investors and speculators shouldn’t hesitate to capitalize on them. The higher the VXO gets, the more cash (raised from selling high near the preceding interim top) should be immediately plowed into high-potential stocks you want to own. Since these fear spikes are fleeting, this stock research into what to buy must be done well before the short-lived when to buy arrives.
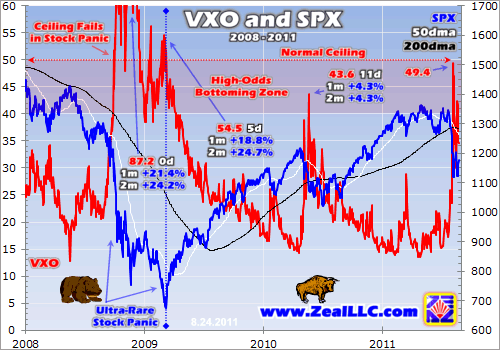
While 1997 to 2003 may seem like irrelevant ancient history to some, it is crucial in establishing the importance of the VXO 50 fear ceiling in normal market conditions. This next chart extends this analysis to the modern period of big fear spikes running from 2008 to 2011. While 2008’s once-in-a-century stock panic was an obvious exception, outside of it the VXO’s high-odds bottoming zone held strong.
2008’s ultra-rare stock panic drove a fear super-spike the likes of which hadn’t been seen since the last extreme selling event in October 1987. On October 19th, 1987 the stock markets crashed with the SPX plummeting an unbelievable 20.5% in a single trading day! This blasted the VXO from its prior-day close of 36.4 straight up to its all-time high of 150.2! Actual crashes easily shatter the normal stock fear ceiling.
After that the VXO never even came close to breaking out above 50 again until October 2008, fully 21 years later. During another crazy-brutal selloff over a two-week period ending October 10th, the SPX plunged 25.9%! This drove a VXO super-spike to 86.0, and a secondary selloff 6 weeks later once again pushed the VXO up to its panic peak of 87.2! Panics also easily rocket above the VXO 50 ceiling.
But this certainly doesn’t mean a panic or crash should be expected every time the VXO nears 50, far from it. These extreme selling events are exceedingly rare, so expecting them is usually irrational. On one terrible day in US history, terrorists hijacked airplanes and flew them into skyscrapers. So every time a jet is seen in the sky, should skyscrapers be evacuated? Ultra-low-probability events shouldn’t be weighted highly.
In our entire lifetimes, we have only seen a single stock panic and a single stock crash. Even in the past century, there have only been a couple of each! The panics were in 1907 and 2008 while the crashes were in 1929 and 1987. These events are exceedingly rare because it takes decades for complacency to grow extreme enough to fuel such massive fear blowouts. They are once-in-a-generation occurrences. Expecting another panic or crash soon after the last one is like expecting another massive wildfire in an area recently burned out by one. It can’t happen because there isn’t sufficient time for enough new fuel to grow back in.
Panics are 20%+ plunges in the stock markets within a couple weeks, while crashes are 20%+ plummets within a couple days. Panics only cascade out of lows deep and late in cyclical bears, representing the capitulation selling climax of those bears. Crashes only erupt from multi-year highs at the ends of 17-year secular bulls. If it hasn’t been decades since the last panic or crash, and the stock markets are not in the right place in their bull-bear cycles to spawn them, they aren’t going to happen. They are irrelevant for fear-ceiling purposes unless the stock cycles are favorable for one, which isn’t often.
Since 2008’s panic there was one major fear spike last summer, but it was sloppy. A variety of crosscurrents dragged the SPX to a secondary low after the initial VXO peak, which moderated the immediate gains considerably. But even if you had bought stocks in that early fear spike as we did, the resulting gains over the next 6 months were huge as the SPX belatedly rallied as expected. Many of our commodities-stock trades added during summer 2010’s fear spikes were realized last winter at 100%+ annualized gains!
And all this brings us to this month’s massive fear spike, where the VXO rocketed near 50 for the first time since the stock panic! Not coincidentally, this happened to be during the second correction of this SPX cyclical bull. Traders have been terrified in recent weeks, utterly convinced that European sovereign debt, or European banks, or Obama’s out-of-control spending, or the resulting USA debt downgrade are going to soon push the US stock markets over a cliff. Fear has been incredibly intense.
But fear was equally intense during all the VXO 50 spikes in the past quarter century as well, yet the markets still rallied dramatically. Each time the VXO slammed into its effective ceiling in normal market conditions, the SPX rallied sharply soon after. Such extreme fear forces everyone susceptible to being scared into selling anytime soon into dumping their positions immediately. This soon exhausts all available selling pressure leaving only buyers, who soon ignite the massive and sharp post-fear rallies.
Fundamentals are irrelevant when fear peaks, things always look the worst after the stock markets have fallen hard. Sharp stock-market selloffs lead to a bearish selection bias among the financial media and traders, they choose to dwell on the most-pessimistic stories they can find while ignoring any positive ones. After being hyper-oversold in a major fear spike, capital floods back into stocks no matter what is going on fundamentally in the global economy at large. Bull or bear, recession or not, it doesn’t matter!
I started my own research into VXO spikes way back in the summer of 2002, and have been well aware of the VXO 50 ceiling ever since. We bought aggressively each time it was seen, and recommended our subscribers do the same. They’ve earned fortunes by steeling themselves to buy low when everyone else was scared and then later sell high when everyone else was greedy. We bought aggressively during 2008’s stock panic too, even though I hadn’t anticipated an ultra-rare VXO super-spike. Their great rarity makes them inherently unpredictable. It didn’t matter though, the subsequent gains were still enormous the following year. Excessive fear must be bought!
Extreme fear flags the best buying opportunities ever seen, the lowest stock prices possible. And VXO 50 is as high as fear gets the vast, vast majority of the time. So when this latest VXO 50 spike emerged in early August, needless to say we started buying aggressively. In our popular Zeal Speculator weekly newsletter, we’ve added 13 new stock trades and 6 new options trades in August alone! I fully expect these to soar to massive gains over the coming months as the stock markets inevitably recover.
While buying fear isn’t easy psychologically, it is necessary if you want to buy low. Fighting the crowd yields amazing gains over time. Since 2001, during a tough sideways-grinding secular stock bear, all 591 stock trades recommended in our newsletters have averaged annualized realized gains of +51%! We didn’t achieve this by buying high when it felt good and selling low when everyone was scared, but by doing the exact opposite. If you want to thrive in the stock markets, subscribe today to our acclaimed weekly or monthly newsletters! Learn how to see the markets and trade them like a contrarian.
The bottom line is stock fear has a ceiling, and that is represented by a 50ish VXO. While this ceiling won’t hold during panics and crashes, those ultra-rare once-in-a-generation events aren’t worth worrying about the vast majority of the time. Normally whenever the VXO surges to 50, it is time to buy aggressively as fear has peaked so a huge stock-market rally is imminent. This is true in secular and cyclical bulls and bears alike.
And just a few weeks ago, the VXO once again slammed into this effective ceiling. Fear was incredibly intense, with perma-bears, chicken littles, and pessimists coming out of the woodwork to call for a continuing stock plunge. But market history clearly shows that expecting the stock markets to head lower after a fear-ceiling approach is almost never the right bet to make. Extreme fear should always be bought!
Adam Hamilton, CPA August 26, 2011 Subscribe |
|||||||
|
|
|
|
|
|
|
|
|
|
|
|
|
|
|
|||