|
|
|||||||
|
|
|
|
|
|
|
|
|
|
|
|
|
|
|
|
|
|
|
Commodities Upleg Cycles Adam Hamilton July 8, 2011 2389 Words
Thanks to their powerful decade-old secular bull, commodities are growing increasingly popular among investors and speculators. Naturally the prudent ones are always looking for insights to optimize their timing in buying low and selling high. Knowledge of this bull’s upleg and correction cycles helps define probability bands for future trade timing.
Measuring commodities as a group is far more problematic than measuring stocks. Individual commodities’ fundamentals are generally much more divergent than individual stocks’. Surprise factors driving material individual-commodity price movements often have little impact on other commodities. Geopolitical turmoil in the Middle East instantly moves crude oil, but the domestic natural-gas market totally ignores it. An Australian drought affects wheat prices globally, but doesn’t move orange juice.
This is very different from the stock markets, where surprise economic data often changes the outlook for (and hence pricing of) stocks in all sectors simultaneously. A bad jobs report drives the entire stock markets, and the vast majority of individual stocks, lower. This makes stock indexes more representative of their underlying companies than commodities indexes of their component materials.
Due to their divergent drivers, analysis of individual commodities will always remain the core of trade timing. If you are interested in trading oil or oil stocks, you have to carefully monitor the technical, sentimental, and fundamental scenes in that particular commodity. But this doesn’t mean there is no value in considering commodities as a group.
The more capital that flows into these raw materials, the more true this becomes. Commodities have grown into a popular “risk trade” globally. This means traders flood into raw materials as a group when optimism reigns, and quickly exit them as a group when pessimism flares. Since the state of the stock markets is the primary driver of universal sentiment, commodities have become very highly correlated with the flagship S&P 500 stock index. This commodities risk trade is critical for all traders to understand.
With big funds increasingly viewing and trading commodities as a homogenous whole, the correlations of individual commodities’ price action is gradually rising. And this makes considering commodities as a group increasingly valuable for traders. The premier index for following commodities as a group is not today’s CRB index as the financial media assumes, but the Continuous Commodity Index (CCI).
Launched in 1957, the CRB has a venerable and proud history. Periodically it was revised to reflect changing economic realities, with commodities fading in importance removed. The original version included hides and lard, which are certainly no longer relevant today. By 1995 this index had been revised nine times, but the underlying calculation methodology remained the same. All component commodities were equally-weighted and geometrically-averaged, to smooth out price volatility.
But in July 2005, the CRB’s entire history was cast aside for its controversial tenth revision. Equal weighting was thrown out in an attempt to reflect the economic importance of individual materials. Thus oil soared from 5.9% of the classic CRB to 23.0% of the new CRB. Total petroleum products ballooned from about 1/8th of the classic to 1/3rd of today’s. This tenth revision not only changed weightings, but calculation methodologies. So now the CRB is an oil index totally unrelated to a half-century of history!
Thankfully the classic equally-weighted geometrically-averaged 17-component CRB lives on in the form of the CCI. The CCI is simply the superior ninth-revision CRB before Thomson Reuters/Jefferies bastardized and adulterated it. The new CRB is simply too dominated by oil to reflect commodities as a whole, as I have shown extensively. So the CCI is now the flagship commodities index, and as more traders understand why the CRB’s popularity is gradually fading.
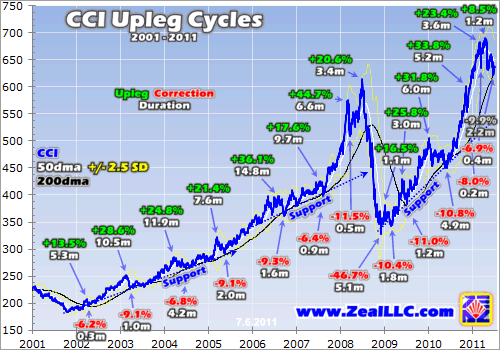
My chart this week looks at all the major uplegs and corrections of this entire secular commodities bull, rendered through the lens of the CCI. Considering these past upleg-correction cycles gives investors and speculators all kinds of valuable insights into what kind of behavior is probable in future uplegs and corrections. And ultimately since the future is unknown, trading decisions simply game probabilities.
Commodities’ performance during this past decade’s secular bull has been mind-boggling. The CCI stealthily bottomed way back in October 2001, when Wall Street ridiculed the brave contrarians then buying deeply-out-of-favor commodities like gold. But nearly 10 years later at its latest all-time high in April 2011, the CCI had powered 276.1% higher! Commodities investors and speculators, including our subscribers, have made fortunes.
And while this performance is outstanding absolutely, it is even more impressive relatively. The S&P 500 stock index is universally considered the benchmark from which all performance is measured. Over this exact decade-long span, this major stock index only advanced 23.3%. Commodities provided stellar performance an order of magnitude greater than the stock markets! This was during a brutal secular stock bear to boot, truly awesome.
In the early years before the vast pools of risk capital started chasing commodities, the CCI’s uptrend was remarkably consistent. Before mid-2007, there were a half-dozen major uplegs and corrections. These uplegs averaged 23.7% gains over 10.0 months each, while the subsequent corrections averaged 7.8% losses over 1.7 months. And the variance between individual uplegs and corrections was generally fairly moderate, with most clustering near mean levels.
Back in those early years as we traded commodities stocks to huge realized profits, I researched using the CCI (then classic CRB) as a timing tool. But it wasn’t representative enough of the individual commodities produced by the companies we were trading including gold, silver, copper, oil, and natural gas. So for years I rarely bothered using the CCI as a secondary timing indicator. But that changed in late 2007.
For the first time in this entire secular bull to that point, commodities really began to catch mainstream fund managers’ attention in mid-2007. As their huge capital flooded into these raw materials, commodities as a group surged 44.7% in just under 7 months leading into early 2008! This was the CCI’s biggest upleg of this entire bull market, and it looked near-parabolic on the charts. Naturally as commodities gained favor, the popular metals and energy surged dramatically on this influx of capital.
Right after this massive upleg topped in March 2008, the sharpest normal correction of this bull occurred. This was not unexpected given the outsized upleg before it. The CCI plummeted 11.5% in just a half month on a gigantic 75-basis-point rate cut by the Fed. Curiously this inflationary move that ought to have supported commodities prices spooked futures traders, who sold aggressively. But indeed commodities soon started surging again in another fast upleg ending a few months later in July 2008.
Then the biggest market anomaly and discontinuity of our lives started unfolding, the infamous 2008 stock panic. In July a bond panic started snowballing as US mortgage giants Fannie Mae and Freddie Mac teetered on the edge of bankruptcy following their stocks plummeting 72% and 78% in a single month!
Bond traders all over the world rushed to sell these GSEs’ bonds to park their capital safely in US dollars and US Treasuries. So a massive US dollar rally was born. Ultimately the US Dollar Index blasted 22.6% higher in just 4 months, its biggest and fastest surge ever! Naturally this hammered commodities, which are denominated in dollars.
Soon this bond panic morphed into the first true stock panic in 101 years. The S&P 500 plummeted 42.2% in just 3 months, an epic bloodbath that sparked monumental fear. Traders were so terrified that they rushed to dump everything regardless of fundamental merit. So commodities, just discovered by big risk capital in the past year, were sold with reckless abandon. The CCI plummeted a previously-unimaginable 46.7% in just over 5 months! Commodities prices were devastated.
But this was a sentimental selloff, a totally-irrational fear-based panic. Underlying commodities fundamentals remained strong, global demand for these scarce raw materials was still growing at faster rates than their supplies. So prices had to be bid back up as soon as that hellstorm of fear passed, as I argued at the time. Indeed we advised our subscribers to aggressively buy commodities stocks in that panic’s wake, a hugely-contrarian bet that proved wildly profitable.
Since the CCI’s panic bottom in December 2008, it has powered 110.7% higher to major new all-time highs in April 2011. Not surprisingly, this post-panic recovery happened a lot faster than the early years of this secular commodities bull. Not only were commodities prices driven to ludicrously-oversold levels during the panic, but speculators, investors, and fund managers remained very attracted to raw materials after that once-in-a-lifetime anomaly. So capital was quick to return.
Since the panic, the CCI’s half-dozen uplegs have averaged gains of 23.3% over a 3.3-month duration. Its post-panic corrections (not including today’s since we don’t know if it is finished yet) averaged 9.4% declines over 1.7 months. These numbers are very interesting, and not what I expected given the steeper rise in the CCI after the panic compared to before it.
Average post-panic uplegs of 23.3% are nearly identical to the pre-panic era’s 23.7%! For some reason commodities as a group generally don’t rally much more than this before a healthy correction emerges to rebalance sentiment. So once any commodities upleg as measured by the CCI approaches 25% gains, speculators need to be cautious. The odds for an imminent correction increase dramatically then.
Despite similar pre-panic and post-panic upleg gains, the average upleg duration has shrunk dramatically. Where pre-panic CCI uplegs averaged 10.0 months each, the post-panic ones were only a third as long at 3.3 months each. Commodities price action has been greatly condensed in this new world where risk capital quickly sloshes into and out of raw materials when influenced by stock-market sentiment.
Once again the post-panic corrections averaged losses of 9.4% each over 1.7 months. This compares very closely to the pre-panic averages of 7.8% also over 1.7 months. It is very intriguing how similar corrections are today despite much faster uplegs leading into them. So when commodities as a group are correcting, once the CCI loses 8% to 9% and 6 or 7 weeks have passed the odds balloon that a new upleg is imminent.
If you average all the uplegs of this entire bull, their average gain is 24.8% over 6.4 months. Every correction (except that brutally outsized and unrepeatable panic plunge) averaged 8.8% losses over 1.6 months each. While these numbers can’t tell you exactly when a future upleg or correction will end, they can certainly help define probability bands to help investors and speculators make prudent decisions.
And really these upleg-correction cycles don’t need to define precise tops and bottoms, as individual commodities’ technicals and sentiment are vastly more adept at that. But as a secondary tool to help confirm likely tops or bottoms, knowledge of these general-commodities upleg-correction cycles is extremely valuable. The more floodlights illuminating price action from different angles, the better traders can understand and react to it.
These probability bands based on a decade of major uplegs and corrections in the CCI are easy to understand and use. When a CCI upleg approaches 25% gains, odds are it is getting mature. If other individual commodities’ technical indicators concur, speculators should lighten up their positions, realize profits, and prepare for another correction. While uplegs can grow larger, most of the time they don’t.
Conversely after a 9% correction in this definitive commodities index, probabilities really start favoring a new upleg being born. If individual commodities’ technical indicators also show oversold readings, speculators and investors alike should aggressively buy new positions ahead of the next upleg. With the exception of that anomalous stock panic, around 11% is about as big as CCI corrections ever get. Also note that CCI corrections usually end near its black 200dma line, so watch for that as well.
Why are these corrections relatively small? I suspect the CCI’s equal weighting among its 17 components and geometric averaging of their prices is a major factor. And other than stock-market-sentiment-spawned risk-on and risk-off biases, individual commodities’ fundamentals still don’t often line up. Factors that drive wheat prices generally don’t affect gold prices or oil prices. So a big correction in any one component or group of them generally isn’t universal across all 17 commodities. This along with this index’s inherent mathematical smoothing makes CCI selloffs modest.
Provocatively, our current CCI correction hit 9.9% over 2.2 months in late June. This implies, based on bull-to-date precedent, that this general-commodities correction has largely run its course. This is one reason among many why we just started a new commodities-stock deployment in our newsletters. Still in its infancy, we expect to add many new trades in the coming months that ought to prove very profitable by this winter or next spring.
At Zeal we started actively gaming commodities prices and trading commodities stocks a decade ago when few others were doing it. All the experience since generated priceless wisdom, knowledge, and instincts on this sector that newer commodities-stock traders simply can’t match. Our track record is stellar. Since 2001, all 583 stock trades recommended in our newsletters averaged annualized realized gains of +52%! Can you imagine your capital growing 50% a year for a decade?
We share the profitable fruits of our hard work with our subscribers, who finance our ongoing research efforts. We publish acclaimed weekly and monthly subscription newsletters that help speculators and investors learn to thrive. In them I weave together all our research and experience to show what the markets are doing, why, and where they are likely heading. When opportunities arise, we capitalize on these trends with specific stock trades you can mirror. Subscribe today and start thriving!
The bottom line is general commodities upleg-correction cycles offer valuable insights into timing trades. While this is a secondary indicator since individual commodities have very different price drivers, it still helps define probability bands. When the CCI has rallied high enough to hit its tight secular-bull-to-date average gain, or corrected low enough to hit its average loss, odds are a major trend change is imminent.
If individual commodities’ indicators concur on being overbought after a CCI upleg or oversold after a correction, speculators and investors should sell or buy accordingly. And as more mainstream capital migrates into commodities, the correlations of their individual price action will continue growing despite divergent fundamentals. So CCI analysis should become more relevant and valuable for trading.
Adam Hamilton, CPA July 8, 2011 Subscribe |
|||||||
|
|
|
|
|
|
|
|
|
|
|
|
|
|
|
|||