|
|
|||||||
|
|
|
|
|
|
|
|
|
|
|
|
|
|
|
|
|
|
|
Commodities-Stock Buying Op Adam Hamilton June 4, 2010 2729 Words
Commodities stocks have two primary drivers, commodities prices and the general stock markets. When both are doing well, commodities stocks thrive. But when both are weak, commodities stocks amplify their losses as we’ve seen during the sharp universal correction since late April. The resulting deeply-oversold commodities stocks have created an outstanding buying opportunity today.
In order to understand why commodities stocks have been beaten down to such great bargains, we have to explore the technicals of their primary drivers. Commodities prices are best quantified through the Continuous Commodity Index (CCI). It is the traditional old-school equally-weighted geometrically-averaged CRB index. Today’s version of the “CRB”, created in July 2005, is dominated by crude oil and uses a brand-new methodology not comparable to the decades of classic CRB history.
The best gauge for the state of the general stock markets is the flagship S&P 500 (SPX). It is the biggest and most-important stock index in the US (and indeed the world). It is far superior to the Dow 30, much broader and it weights its components by market capitalization (as opposed to the Dow’s antiquated and misleading share-price weighting). Thus professional traders zealously follow the SPX’s progress.
All investors and speculators interested in buying commodities stocks low and selling them high need to monitor the CCI and SPX. Their technical states on an ongoing basis show whether commodities stocks are oversold and likely to rally or overbought and likely to retreat. And today, for the first time in a year, the pendulum has swung deeply into the oversold region of this buy-low-sell-high continuum.
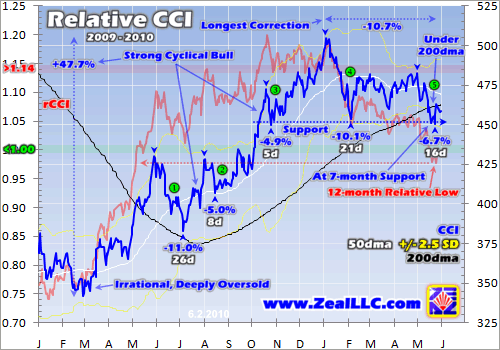
We’ll start with the CCI, because the influence of commodities prices on commodities-stock fortunes is the most obvious. Commodities stocks naturally explore for and produce commodities. The higher commodities prices go, the more profitable they are to produce. And the more profitable the producers become, the higher the markets bid up their stock prices. Thus a higher CCI translates into better commodities-stock prices, and vice versa of course.
This first chart renders the CCI in blue along with some of its key technicals. In addition the Relative CCI is shown in light red. It expresses the CCI as a multiple of its critical 200-day moving average. This helps define overbought and oversold levels in comparable terms over time, illuminating excellent entry and exit points. This is based on my Relativity Trading system, a simple and logical approach that can greatly benefit all investors and speculators who take the time to understand it.
Commodities have been in a strong cyclical bull (within their secular bull) since their irrational and deeply-oversold levels of early 2009. Between March 2009 and January 2010, the CCI soared almost 48% higher! This is a gargantuan move for this index, particularly because its multi-dimensional geometric averaging has a strong smoothing effect that retards sharp moves.
As in all bull markets, the CCI has experienced both pullbacks and corrections along the way. Typically a pullback is defined as a temporary retreat under 10% in an ongoing bull, while a correction is over 10%. The CCI’s 5 major retreats have lost between 4.9% to 11.0%, slightly crossing into correction territory on the large end. If you want to buy low within an ongoing bull, the best opportunities to do it are when pullbacks and corrections climax. The bigger the retreat, the better the buys.
Since early May, the CCI has fallen 6.7% at worst over 16 trading days. The average of the previous 4 retreats in this cyclical bull was 7.8% over 15 days. Compared to this precedent, the CCI’s latest pullback is actually on the small side. But this is somewhat misleading, as you can see in this chart.
This is because the CCI’s latest major interim high was achieved way back in early January. This commodities index has been grinding lower to sideways ever since, even hitting modestly lower lows in its latest 5th correction than it saw in its 4th. So technically, we’ve actually witnessed one big, extended correction since early January! It drove the CCI 10.7% lower over 96 trading days. This is much larger than the averages in the preceding 3 retreats of 7.0% over 13 days.
So the commodities action we’ve seen for all of 2010 has actually been the longest correction by far of this entire cyclical bull. A correction that extends this long evolves into a high consolidation. This gets traders comfortable with the new higher prevailing price levels and builds a base from which the next upleg will launch. Yet of all the technical arguments for an oversold CCI, this longest-correction one is the least compelling.
Just last week, this latest CCI correction drove it back down to a strong support line that has held for 7 months. Commodities prices were trading at the same levels they were back in early October 2009. And of course back then there was a lot more uncertainty in the markets and economy. All the chartists watching commodities will see the recent bounce off this well-established support line as very bullish.
Another tool for measuring oversoldness is the standard-deviation bands rendered in light yellow above. The CCI fell so sharply in May that it plowed into its lower 2.5 SD band for the first time since early February. Only about 0.6% of the trading days see such an extreme, so they are pretty rare. We have only seen two such episodes in this entire bull. Whenever a price falls far or fast enough to hit its lower 2.5 SD band, odds are it is oversold and due for a sharp rebound rally. This happened in early February.
But most important of all, consider where this latest correction has driven the CCI relative to its 200-day moving average. In order to buy low and sell high, traders need some kind of evolving baseline from which to judge “low” and “high”. 200dmas are ideal. They gradually follow bull markets higher, while smoothing out all the endless day-to-day volatility. This creates an excellent balance for a price-judging baseline.
In May for the first time in this entire cyclical bull, the CCI actually plunged under its 200dma! Commodities hit a new low relative to their recent price levels, a very important technical event. Per Relativity Trading theory, which has already made our subscribers fortunes in today’s secular commodities bull, the best times to buy in an ongoing bull market are when prices fall near or under their 200dmas.
Visually as prices rise on a chart, it is hard to judge the distance between the blue price line and the black 200dma line. But if you divide the CCI by its 200dma, you get the light-red rCCI line. It expresses the CCI as a perfectly-comparable percentage multiple of its 200dma over time. And for many years prior to 2008’s crazy stock panic, this rCCI tended to trade in a range between 1.00x to 1.14x. In other words, the CCI tended to bounce near its 200dma in corrections and then rally to 14% above it during major uplegs.
But in this latest correction, the CCI plunged to 0.976x its 200dma. This is the lowest we’ve seen in this cyclical bull since the CCI’s 200dma turned higher again. A 12-month relative low is very rare technically, and a very powerful buy signal. By definition something can only grow this oversold once per year. So in late May per this metric, we just witnessed the best buying opportunities in commodities seen in a year!
From a variety of key technical perspectives, commodities prices as represented by the CCI are extremely oversold today. And as long as they remain in fundamentally-driven bull markets, meaning their global demand growth usually exceeds their global supply growth, prices must continue higher on balance. And we remain many years away yet from ramping up world supplies to meet the gigantic Asian-driven demand surge. So commodities are enjoying an outstanding buying opportunity thanks to this correction.
As one of the primary drivers of commodities stocks, these low commodities prices have really hammered producers. Commodities stocks were sold aggressively as commodities prices fell sharply in recent weeks. The net result is deeply-oversold commodities stocks, fantastic buys. And as commodities prices recover, naturally so will the prices of commodities stocks.
While commodities prices have a direct fundamental link to commodities stocks, the general stock markets have a powerful sentimental link. The fortunes of the SPX drive sentiment universally. When it is rising, investors and speculators are happier and their greed drives them to buy all sectors including commodities stocks. And when it falls, traders grow scared and their fear convinces them to sell all sectors. Thus commodities stocks are inexorably linked to the flowings and ebbings of the SPX.
While this link is not strictly necessary and is purely psychological, it is usually ostensibly justified in economic terms. When stock markets are rising, traders assume the global economy is improving and thus commodities demand will grow. This makes commodities stocks very attractive. But when stock markets are falling, traders assume the global economy is weakening. And of course lower economic output means less commodities demand, which makes commodities stocks look far more risky.
Although commodities’ fundamental link to commodities stocks is far more important over the long term, the stock markets’ sentimental link utterly dominates this sector in the short term. On any given trading day, the fate of the SPX is far more influential on commodities-stock levels than whatever commodities prices happen to be doing. Thus major stock-market selloffs create the best buying opportunities ever seen in commodities stocks.
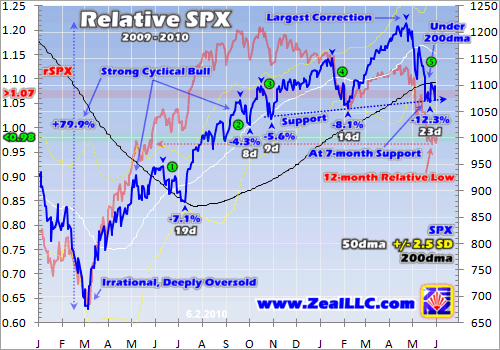
This next chart looks at the same technical metrics in the SPX. Before you move on, carefully compare the CCI pullbacks/corrections above with the SPX ones below. The 1st, 3rd, 4th, and 5th retreats in commodities all coincided very closely with the SPX’s own selling events. Stock-market selling affects the sentiment of futures traders too, which get caught up in the hype and drive down commodities prices. The sentimental impact of the stock markets on commodities is huge. Don’t underestimate it!
The SPX’s cyclical bull emerging out of March 2009’s irrational, deeply-oversold lows has been enormous! By late April 2010 it had rocketed nearly 80% higher! Commodities stocks leveraged this run tremendously, with gains on the order of hundreds of percent in many smaller, medium, and some large producers. We told our subscribers to buy this sector aggressively near the SPX lows, and they were richly rewarded.
Over this cyclical-bull span, the SPX also experienced 5 major retreats. And all but the most minor, the 2nd, were mirrored by the CCI above. Prior to our latest 5th one which started in late April, the averages of the preceding 4 were 6.3% over 13 trading days. And every single one was well under 10%, making them pullbacks and not corrections. This precedent shows just how big and mean our latest retreat has been, the first true correction of this cyclical bull market.
Between late April and last week, the SPX plunged 12.3% over 23 trading days. This was approaching double the bull-to-date averages on both fronts, a major selling event. While Europe fears were credited for most of this recent correction, I strongly suspect the stock markets just needed to retreat after being so overbought for so long without a healthy correction to rebalance sentiment. Stock markets rise and fall, and more often than not pure sentiment drives these moves. Despite this, the financial media always tries to attribute fundamental causes because crediting greed or fear doesn’t make for good stories.
So after its largest correction by far in this bull, the SPX was going to be pretty oversold. And the same metrics we used above to explore the CCI’s oversold condition apply to the SPX as well. It fell down to its 7-month support line, a bounce off of which is a strong technical buy signal for chart-watching traders. It also plunged to crowd its lower 2.5 SD band for only the second time in this cyclical bull. Statistically not many days get this oversold, so the ones that do are rare buying opportunities.
Like the CCI, the SPX also plunged well under its 200dma for the first time in this cyclical bull. The SPX’s pre-panic relative trading range ran between 0.98x on the low side and 1.07x on the high side. By late May, the rSPX fell to 0.967x! This is not only a 12-month relative low, but a very strong buy signal in an ongoing bull market. It is not often that you get an entry point that is effectively as low as one a year earlier during such a strong move higher. In absolute terms, the SPX is back to October 2009 levels.
Naturally this sharp plunge in the stock markets generated a great deal of fear and economic uncertainty. As usual, commodities stocks bore the brunt of these fears. Exacerbating matters, during sharp stock selloffs flight capital floods into the US dollar and US Treasuries. This certainly happened during the stock panic. A higher dollar hits commodities prices and amplifies the selling pressure in commodities stocks. Thus sharp stock selloffs hammer this sector on multiple fronts.
This is especially true in smaller high-potential stocks, commodities explorers and small producers. Roughly coincident with the SPX’s recent 12.3% 23-trading-day correction, many small commodities stocks plunged by 20% to 40%! The carnage in this sector, which even extended to many larger stocks, was incredible. There was blood in the streets as fears of a Europe-driven global slowdown and endlessly-rallying US dollar led to heavy commodities-stock selling.
But if you want to buy low, which is absolutely crucial for achieving success in investing and speculating, fear is your friend. The more scared traders get, the lower they drive commodities stocks, and the greater the resulting bargains for prudent contrarians. For those who have trained themselves to trade coldly without emotion, fantastic buying opportunities have been seen in deeply-oversold commodities stocks. And they still exist since much of the irrational end-of-the-bull psychology persists!
If you fear commodities prices and the stock markets are still just too darned high, consider the long view. In the first 6 months of 2008 prior to the extreme disruptions of the stock panic, the CCI and SPX averaged 537 and 1361 respectively. Today they remain well under those pre-panic norms, 15% and 19% lower. Heck, the stock panic didn’t even start until the SPX fell under 1200 in September 2008! So the SPX’s latest interim highs in late April had just merely erased the panic’s epic losses. Neither commodities nor stock markets are high today by any long-term measures.
At Zeal in recent weeks we’ve been aggressively buying commodities stocks in our weekly and monthly subscription newsletters. These include smaller high-potential oil explorers and producers, copper explorers and miners, a platinum miner, a nickel miner, a uranium miner, and a molybdenum miner among other trades. The charts of these stocks are just amazingly beat up, radically oversold in many cases. The commodities-stock bargains I’ve seen in recent weeks are the best since the summer of 2009.
As hardcore speculators and students of the markets, we are always looking for oversold buying opportunities and overbought selling opportunities. Every month I integrate our endless research into current market events, explaining what is happening, what is driving it, and how we can capitalize on these trends in real-world trades. If you are interested in commodities stocks, you’d love our acclaimed Zeal Intelligence monthly newsletter. A great bargain at only $10 a month, there is no excuse not to subscribe. Join us today and start thriving in these markets!
The bottom line is commodities stocks are deeply oversold today. Both of their primary drivers, commodities prices and the general stock markets, have suffered exceptional corrections. Commodities stocks, as usual, leveraged these declines to fall to incredibly-low levels in many cases. Simultaneous sharp CCI and SPX corrections offer the best opportunities to buy low ever seen in cyclical bulls.
In order to capitalize on these fantastic opportunities, you have to ignore your emotions and focus on the big picture. Without exception, newsflow is always highly pessimistic following sharp corrections. If things didn’t feel bad and look bearish, stocks wouldn’t be driven to bargain-basement prices. If you have the courage to fight the crowd, the wisdom to be a contrarian, don’t let this rare commodities-stock buying op pass you by.
Adam Hamilton, CPA June 4, 2010 Subscribe |
|||||||
|
|
|
|
|
|
|
|
|
|
|
|
|
|
|
|||