|
|
|||||||
|
|
|
|
|
|
|
|
|
|
HUI Bull Seasonals 2 Adam Hamilton March 21, 2008 2921 Words
After an incredibly volatile week for the precious metals, PM-stock traders are very worried. Despite Bernanke’s Fed forcing real interest rates even more massively negative, gold plunged. The PM-stock traders, never paragons of courage anyway, panicked. The HUI gold-stock index plummeted with gold.
We were stopped out of a lot of trades in the carnage, but the great thing about stop losses is they automatically get your capital out early in a sharp plunge. So we are now blessed with lots of dry powder to scoop up irrationally beaten-down bargains. Great opportunities have bloomed! I will discuss our trading strategy in depth, including specific new trades, early next week in Zeal Speculator.
But today my mission is to explore gold and HUI seasonals. This week’s sharp selloff that rained terror on the PM realm like hailstones of fire makes seasonals more relevant than ever. A seasonal perspective really helps put the recent extreme volatility and heavy selling pressure in gold and the HUI in context. Contrary to the legions of Chicken Littles frantically squawking today, perhaps the sky is not falling.
Seasonality, of course, is the tendency for a price to behave in a particular way at a particular time during the calendar year. The key word here is tendency, as seasonals are seldom the primary driver of prices. They are more like prevailing winds influencing prices peripherally. An aviation analogy nicely illustrates this concept.
If you are flying somewhere, you’ll reach your destination regardless of the prevailing winds at altitude. But it is certainly nice to have a tailwind, as it will shorten your flight time. The engines on the airplane are the primary driver of its velocity, but prevailing winds can really affect the time (and fuel) it takes to reach your destination. In the financial markets seasonals are like these prevailing winds, an important secondary influence.
Interestingly both gold and the HUI have exhibited strong seasonal tendencies over their powerful bulls. Both tend to be strong at certain times of the calendar year and weak at other times. While it is easy to understand why a grown commodity like wheat has seasonal tendencies, I find many traders are surprised to learn that seasonality even exists in gold and PM stocks. Orbital mechanics don’t affect mining, after all.
If you’d like more background on some of the cultural drivers of gold seasonality, check out my initial essay in this series. It also explains the methodology used to construct these updated seasonal charts below, so I won’t rehash that discussion here. Instead let’s dive right in to gain some important seasonal perspective on gold and the HUI today.
Any discussion on HUI seasonals has to start with gold itself, as this metal is the primary driver of gold stocks’ fortunes. Over the long term, higher gold prices mean higher profits for the companies mining this metal. And in the stock markets, higher profits ultimately translate into higher stock prices. So as always, we have to look to gold first to understand the gold stocks’ volatile gyrations.
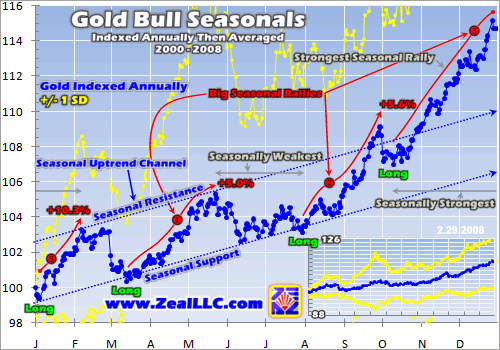
This chart looks at an annual composite of the gold price’s calendar tendencies since 2000. Daily gold price data for each year is indexed starting at 100 and then all the resulting annual indexes are averaged. Thousands of formulas and one complex spreadsheet later, the final results are rendered above. Since 2000, gold has exhibited a very clear and strong seasonal uptrend reflecting this metal’s secular bull.
If you apply standard technical analysis to this uptrend, gold seasonality has definite support and resistance lines shown above. Generally gold doesn’t retreat much below its seasonal support. Thus when it hits seasonal support, it is usually an excellent time to add long positions. Note that one of only three support approaches during the year happens in mid-March! Gold tends to be weak right now.
Now lest you suspect the sharp selloff just witnessed this week has unduly influenced the charts in this essay, I cut off this data as of February 29th, 2008. So all these charts reflect average Marches from 2000 to 2007, but not 2008. You hardcore skeptics can prove this to yourself by carefully comparing March in these charts with March in my last seasonal charts from September 2007. March seasonality is identical!
So even before this week, seasonal weakness in gold in mid-March was a well-established tendency. In fact, gold generally started selling off in late February before finally bouncing at seasonal support in mid-March. While not as apparent above, in earlier seasonal charts not including February 2008 this selloff was two-phased. It started modestly in late February, then gold consolidated sideways for a couple weeks, and then it fell more sharply into mid-March.
But this year, of course, gold bucked its usual seasonal tendency. It surged into late February when it usually tends to start correcting. Then it consolidated near its highs, in the $970s, for the first couple weeks of March. And then it started surging again, contrary to seasonal tendencies, to close over $1000 for a couple days. So perhaps this week’s sharp plunge was simply seasonality catching up with gold in a very temporally-accelerated way. Three weeks’ worth of seasonal selling was done in three days!
At least it’s certainly a provocative thought to ponder. Gold traders are worried that the Fed’s negative real-rate policies are now somehow mysteriously helping the US dollar. They are worried that hedge funds unwinding leveraged commodities positions must think this commodities bull is over. But wouldn’t it be ironic if gold was simply overbought, needed to retreat a bit, so seasonals finally caught up with it quickly?
Understanding context is critical to psychologically weathering sharp adverse moves. Gold hit $925 for the first time in history on January 28th, $950 on February 27th, $975 on March 3rd, and $1000 on March 14th. So just two months ago, the levels gold plunged to this week would have been considered fantastically high! This metal has certainly earned a breather, and seasonally a pullback was probable anyway.
And if you can stay coldly rational in the midst of a howling sentiment storm, the mid-March seasonal support approach is very bullish. Starting about now, gold tends to rally strongly into late May. On average from 2000 to 2007, this rally carried the gold price 5% higher. The next two months are usually one of gold’s biggest seasonal rallies of the year. And today’s seasonal support approach is where it launches.
I suspect gold will have little problem embarking on its usual March-to-May seasonal rally this year. Many bullish forces are stacking up behind it, building upside pressure. The key one is inflation. So far, higher commodities prices largely have not been passed on from producers to consumers. But they soon will be. As general prices rise, interest in gold among mainstream investors will grow dramatically.
On top of this, the Federal Reserve has ramped the US MZM money supply by a jaw-dropping 16.0% over the past year! Relatively more money chasing relatively fewer goods, services, and gold means higher prices. And Ben Bernanke’s disastrous negative real-rate policy, right out of the inflationary 1970s playbook, is extremely bullish for gold and bearish for the US dollar. Gold will thrive.
And as goes gold, so go the gold stocks. While sentiment amongst PM-stock traders was decimated this week, they will be back when gold resumes rallying. I’ve been actively trading PM stocks since this HUI bull began in late 2000 and I’ve never seen a more manic-depressive lot. In the HUI’s 1331% bull to date, sharp selloffs to shake out the weak hands have been par for the course. Once they’ve exited, rallying resumes.
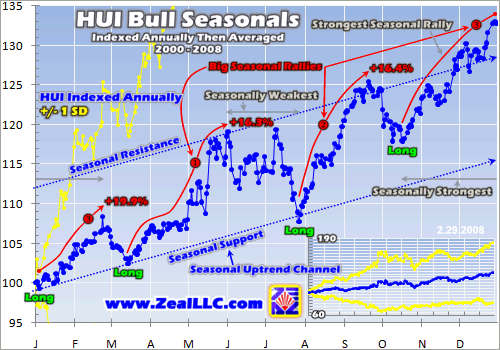
So with gold likely near the launching point for one of its three biggest seasonal rallies of the year, how do the HUI seasonals line up? Pretty darned well! If you quickly scroll between the gold chart above and this HUI chart, you’ll see that HUI seasonals generally mirror and amplify the underlying gold seasonals rather nicely. The HUI too also hits seasonal support in mid-March and then rallies seasonally into late May.
Once again, this data is current as of the end of February. So the indexed and averaged March shown here has no data from March 2008. And what do we see? HUI weakness in late February accelerating into a mid-March low right along seasonal support. The HUI has already had a strong tendency for years to grind lower into the middle of this month, and this week’s plunge played into it.
This year, the HUI rallied into late February as its seasonals suggest. But instead of starting to pull back then, it consolidated sideways for a week and then started retreating modestly. But gold drives the gold stocks, so the HUI caught the gold fever and surged to a new all-time high of 515 on March 14th. But this rallying, fun though it was, was contrary to the HUI’s usual seasonal tendency to retreat into mid-March.
So perhaps like gold, the HUI’s seasonals finally caught up with it this week. Instead of having three weeks to pull back seasonally and bleed off greed, the HUI had three days. And of course the sharper a move, the more fear is generated which tends to exacerbate that move. While this week’s selloff was irrationally fearful and extreme, it did occur near a seasonally weak time of the year. It had a tailwind.
Now please realize I am not emphatically saying that an accelerated seasonal catch-up is what hammered gold and the HUI. Seasonals are merely secondary drivers. But if the primary driver was a short-term overbought gold price that needed to retreat, and the Fed scared leveraged speculators into unwinding gold longs, then the weak seasonals added a tailwind. Seasonals could help explain this plunge’s severity, and maybe some of its timing, even though they weren’t its prime mover.
I know from past consulting experience that some PM-stock traders won’t survive a week like this. The leveraged ones using debt to bet with other people’s money can be totally wiped out by sharp selloffs like we saw this week or last August. The traders without emotional control can be so psychologically scarred that they never want to see another PM stock as long as they live. Both camps sent me e-mails this week.
But if you prevailed and your rationality and sanity is intact, this mid-March seasonal support approach in the HUI offers great opportunities. Just like gold, one of the HUI’s three biggest seasonal rallies of the year tends to erupt out of these mid-March seasonal lows. It tends to run into late May and is really quite powerful with a 16.3% average indexed gain.
A 16% run in about 10 weeks may not sound like much by PM-stock standards, but realize two key things. First, this is an indexed average from 2000 to 2007 encompassing 8 years. As the widening yellow standard-deviation bands above reveal, the spread on individual March-to-May seasonal rallies is quite broad. Second, seasonals are merely a tailwind, not a primary driver. We must look to the primary driver for clues on the size of this rally.
As I wrote in February on HUI upleg structure, it looks like the HUI is currently in one of its periodic massive uplegs of this bull market. While awesome in hindsight, these massive uplegs are very challenging psychologically in real time. Sharp selloffs within the uplegs aren’t uncommon, as PM stocks do everything in their power to shake out bulls too soon before their greed-driven highly-profitable climaxes.
If today’s upleg continues to unfold like a massive upleg, it should see half its gains in its final two months. At past massive uplegs’ average duration, today’s upleg’s final two months run into mid-May. May is also the highest-probability topping time seasonally, by far, for all of the HUI uplegs of this bull. Thus if this upleg continues higher after this week’s panic, it will have a strong seasonal tailwind leading into May.
The biggest gains of this entire HUI bull have been witnessed during the final two months of massive uplegs. And to have seasonal tailwinds concurrent with these probable final two months of our current upleg is all the better. So despite this week, probabilities still appear to favor a big HUI rally heading into May. Gold stocks are really compelling to buy even at $800 gold, let alone today’s awesome prices.
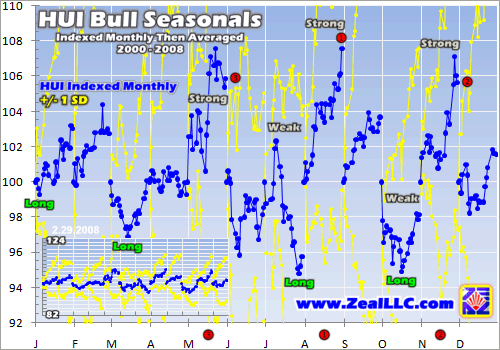
So with a primary driver, continuing high gold prices, and a secondary influence, bullish seasonals, lining up, this week’s sharp HUI selloff seems totally irrational. While emotions can spark fast anomalous moves, emotional extremes never persist. When the dust settles and rationality returns, PM stocks should prove irresistible. This final chart looks at the HUI bull seasonals indexed monthly instead of annually.
Monthly indexing then averaging reveals the same seasonal tendencies discussed above from a different perspective. The HUI tends to be weak seasonally heading into mid-March. It pulls back rather sharply but then recovers late in the month. And then April tends to be flat as sanity slowly returns to the easily-excitable PM-stock-trader herd. But then this sector tends to soar in May in one of its biggest monthly rallies of the year.
Between 2000 and 2007, the HUI’s seasonal selloff in mid-March provided one of the four best opportunities to go long gold stocks of the entire year. Odds are 2008 won’t break this tendency. Out of extreme fear comes great opportunity, and this year’s outsized selloff drove far more fear than is normal seasonally. It is never easy buying during widespread fear, but that is how contrarians earn big profits.
I really wish I could tell you that I expected such a sharp HUI selloff in mid-March, but I didn’t. I was well aware of this seasonal tendency to retreat, but I suspected it would be just a lazy consolidation and pullback this year like usual. Its raw magnitude caught me by surprise too. But such is speculation. The volatility and surprises are what make this game so exciting. The markets never cease to astonish!
The upside of big selloffs is they create excellent buying opportunities. Short-term fear temporarily overwhelms long-term fundamentals so prices are briefly driven down to totally irrational lows. Astute and fearless traders can swoop in and buy on the cheap. And the prudent PM-stock traders running stop losses just recovered much capital from stopped trades, most at gains, that is now ready to be redeployed.
Not only should we be regaining the seasonal tailwinds now, but gold stocks have yet to fully reflect gold’s stellar run since August. Regardless if gold stabilizes at $900, $850, or $800, mining gold is going to be a lot more profitable going forward than it has been in the past. In calendar 2007, the gold price averaged $697. So far this quarter, the average has soared to $926! Sooner or later gold stocks will be bid up to reflect this. Even after a big pullback, the days of sub-$700 gold are probably history.
The timing of this fear-driven panic selling is really fortuitous in one way. Back in November, my business partner Scott Wright and I started wading through the morass of junior gold stocks. We started with 285, gradually researching them all and whittling the field down to our 12 favorites. Just this week Scott finished his brand new Zeal Report fundamentally describing each of our favorite junior golds in depth.
Juniors are small and very-high-potential stocks, so they are even more slave to sentiment than larger gold miners. They tend to thrive the most late in massive uplegs when widespread greed returns, like in spring 2006. If we are indeed in another massive upleg due to peak in May 2008, they should soar again soon.
The panic selling this week helped drive our favorite gold juniors even lower, offering stellar buying opportunities. If this HUI upleg remains on track, today is a rare junior-gold fire sale right before greed is likely to return with a vengeance once traders realize gold isn’t going to zero. Buy our awesome new report today to get the fundamental lowdown on our favorite high-potential junior golds!
Also, as always, we’ll continue to explain our actual commodities-stock trades as we launch them in our acclaimed monthly Zeal Intelligence newsletter. If you are tired of being tossed to and fro by your own capricious emotions or those of the marketplace, you’ll love our analyses. After actively trading this gold-stock bull since its birth, we offer a strong, steady, logical, and unemotional anchor of cutting-edge research and real-world trading knowledge. Subscribe today!
The bottom line is gold and HUI seasonals have long exhibited a tendency to retreat in mid-March. While this week’s selloff was far sharper and more extreme than seasonally expected, the metal and stocks had been bucking seasonal trends in the weeks prior to this. So perhaps a secondary driver of the severity of these selloffs was simply overstretched seasonals springing back, doing a few weeks’ worth of work in a few days.
While such an extreme selloff stung, good traders never lick their wounds. They look forward. Heading into May, seasonal tailwinds are due to resume. Over the past 8 years, they have driven one of the three biggest annual seasonal rallies in both gold and PM stocks. They ought to again, with PM stocks not yet reflecting new high prevailing metals prices even after the metals selling. So unless you think gold is going to zero, carpe diem!
Adam Hamilton, CPA March 21, 2008 Subscribe |
|||||||
|
|
|
|
|
|
|
|
|
|
|
|
|
|
|
|||


