|
|
|||||||
|
|
|
|
|
|
|
|
|
|
Stock Bear Extremes Adam Hamilton October 17, 2008 3055 Words
The brutal stock markets have been exceedingly hostile to long-term investors for a couple months now, crushing all stocks regardless of their individual fundamentals and merit. And in the last couple weeks, even speculators have been getting slaughtered. This frenetic hyper-volatile environment is making short-term trading nigh-on impossible to execute successfully, even to the short side.
Everyone involved in the markets, including me, is trying to wrap their minds around so many unprecedented developments coming at us so fast. From a supposedly free-market government incessantly meddling and interfering with healthy corrective processes, to relentlessly negative newsflow, to epic levels of fear and unease, this market is unlike anything ever witnessed.
Although no two bear markets are ever identical, the declines they drive in headline stock indexes usually tend to follow certain tendencies well defined throughout history. While background conditions underlying bears change, the greed and fear dominating traders’ hearts never changes. The interplay between these perpetually warring emotions leads to tradable downlegs and bear rallies within every bear.
But this time, many of these tendencies that have held strong through decades of bears are getting unceremoniously blasted out of the water. Even for students of the markets, trying to trade this beast has become a voyage into uncharted seas. We are so far outside the bounds of historical bear precedent that it reminds me of the edges of old seafaring maps that filled unknown territories with the legend “here there be monsters”.
As I work to navigate these storm-ravaged seas, I’m trying to understand them in historical context. Perspective is everything, even in unforeseen scenarios, since it really helps temper the ever-present temptation to get too emotional. With more market gurus advising investors to totally liquidate any positions from which they may need the cash for the next five years, rationality has grown very rare.
The last two bears of similar magnitude to today’s occurred in the early 2000s and mid-1970s. Between March 2000 and October 2002, the flagship S&P 500 (SPX) stock index lost 49.1%. Between January 1973 and October 1974, the SPX lost 48.2%. Incidentally, back in January 2008 when the SPX was a third higher than today I wrote an essay warning about a new 1973-to-1974-style bear. It wasn’t a surprise.
But what was surprising, and unsettling, is the ferocity with which our current bear has unfolded over the last couple months. Bears are usually plodding and methodical. Since too much fear can breed enough selling to end a bear prematurely, bears usually tend to back off a bit before fear gets too excessive and prices fall too far too fast. Probably due to government meddling, this balancing mechanism isn’t working very well in today’s bear.
That 49.1% SPX bear in the early 2000s occurred over 30 months or so. The 48.2% SPX bear in the mid-1970s took about 21 months to unfold. But as of October 10th, 2008, our current SPX bear has lost 42.5% on a closing basis in just 12 months! Such speed and ferocity is unprecedented. On a per-day basis, the early-2000s bear lost 0.077% per day on average. In the mid-1970s, it was 0.111%. But over the past year, the average daily rate of decline has run a staggering 0.168%!
This is 2.2x as fast as the early-2000s bear and 1.5x as fast as the fabled mid-1970s bear! The magnitude of the SPX’s latest 42.5% decline is typical (cyclical bears tend to cut headline stock indexes in half), but its duration is incredibly compressed. So much selling happening so quickly has blown many sentiment and technical indicators up to levels that would have been unimaginable just a few months ago.
The first I want to discuss is the VXO, the implied-volatility index for the S&P 100 stocks. This top 20% of the S&P 500 includes the biggest, best, and most-liquid companies trading in the US. When traders need to raise cash fast in a steep decline, these are the go-to stocks to sell. The larger the market cap and bigger the average volume of a stock you need to sell, the less your own selling will impact the price you actually realize.
The VXO is one of the best bear-market trading tools, as I discussed in depth last week in an essay. It works because bears oscillate between greed and fear extremes. Bear downlegs drive fear way too high, forcing the VXO to very high levels. But this fear is self-limiting and soon exhausts itself as everyone scared into selling has finally sold. It gives way to greed that ignites major bear-market rallies. And then when this greed gets excessive, the selling returns and the next bear downleg arrives.
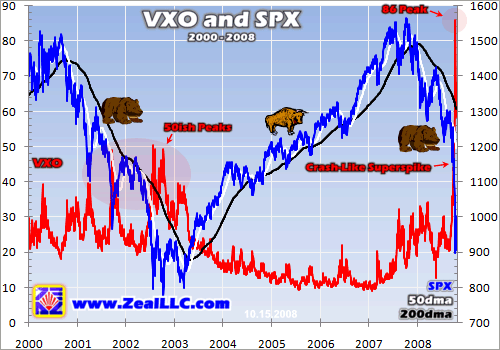
Well, as you can see in this chart, 50ish VXO levels are what marked the fear climaxes during the early-2000s cyclical bear. All year many contrarian speculators, including me, have been betting that we’d see a major bear rally at a VXO 50. Unfortunately this hasn’t happened. Rather than fear peaking at VXO 50, this fear has continued to grow until the VXO’s incredible 86 closing peak last Friday! I never thought I’d see this in my lifetime due to the post-1987-crash circuit breakers implemented to retard fast selloffs.
But it happened nevertheless, the markets never cease to amaze and confound. Despite such extreme fear like has never been seen outside of the infamous October 1987 SPX crash (down 20.5% in one trading day!), fear is not infinite. Even a VXO superspike will burn itself out as soon as everyone remotely interested in selling soon has sold. As soon as all the scared traders have exited, only buyers remain so stocks enter a sharp V-bounce leading into a strong bear rally.
There is no doubt today’s epic levels of fear will lead to a monster bear rally. But unfortunately government meddling interfering with sell decisions has driven fear to levels unimaginable during the last bear. Each time the government “tries to help”, it gives false hope to those remaining weak hands interested in selling. This slows the corrective process. But soon these hopes are dashed and the traders who wanted to sell earlier still end up selling anyway. Intervention prolongs the selling and amplifies fear.
This next indicator isn’t at an extreme yet, but it probably soon will be. It is the 21-day (one month) moving average of the Put/Call Ratio. The more scared traders are, the more puts (bets stocks will decline) they buy compared to calls (bets stocks will rise). The raw PCR is exceedingly volatile, so smoothing is necessary via a moving average. But of course using a 21dma makes the resulting smoothed indicator lag by a couple weeks.
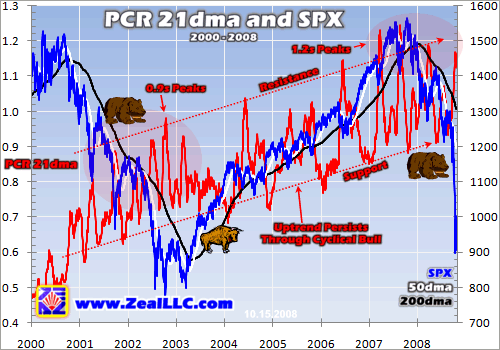
Back in the early-2000s bear, even extreme fear could only drive the PCR 21dma into the 0.9s. Even at the climaxes of the worst downlegs of that bear, and believe me they were darned ugly in real-time, put buying never consistently exceeded call buying as evidenced by the sub-1.0 PCR. But our latest bear has seen this indicator surge towards 1.2, levels that were unimaginable even at the end of the last brutal bear.
Even more paradoxically though is the PCR 21dma’s curious secular uptrend. Between October 2002 and October 2007, the SPX powered 101.5% higher in a mighty cyclical bull. Normally during long bull markets like this, technical indicators turn bullish. This is certainly evident in the VXO chart above, as that indicator was very low (indicating little fear and lots of greed) for years.
Such strong put buying even during a big and long bull is very interesting. Perhaps options traders understood we were in a secular bear (17 years of sideways-grinding stock indexes) even when mainstream investors didn’t have a clue. They may have been buying so many puts, either hedging longs or speculating, in anticipation of the mid-secular-bear cyclical bull failing. This finally happened in October 2007.
The PCR’s uptrend is very intriguing. If it persists, in another year or so the PCR 21dma’s support will head over 1.0. This would mean put buying would always exceed call buying on balance. It sounds unlikely, but if we are in a 17-year secular bear as I first wrote about in 2001, such an outcome is certainly possible. The PCR could continue to rise on balance until our next true secular bull ignites in 9 more years or so.
This next indicator is the Bullish Percent Index (BPI) for the NYSE. While I haven’t written about the BPIs for some years now (since 2004), we still track them at Zeal. They show what percentage of all the stocks in a particular index are currently showing buy signals based on a standard Point-and-Figure chart configuration. If the Dow 30 BPI is at 50%, it indicates 15 of the 30 stocks in this index are currently flashing P&F buy signals.
The granddaddy of the whole BPI realm is the one for the New York Stock Exchange Composite Index, the NYSE BPI. It shows what percentage of the entire universe of stocks traded on the NYSE (about 3300 today) have bullish P&F chart signals. While sadly not very popular today despite its storied 53-year history, it is a very useful indicator to signal both sentiment and technical extremes.
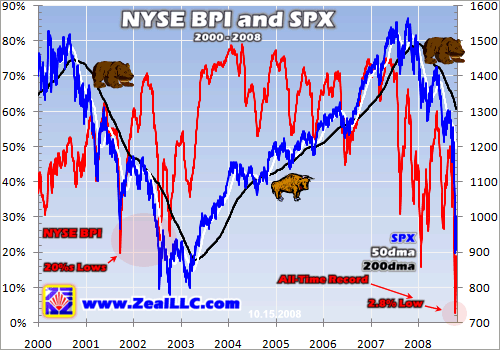
Back during the early 2000s bear, even at the climaxes of the very worst downlegs the NYSE BPI would stay in the 20%s. That meant around 80% of all the stocks traded on the NYSE were beaten enough near the ends of these downlegs to have P&F sell signals. You could play these BPI extremes for V-bounces and bear rallies, as the kind of sentiment that can drive 80% of stocks into bearish sells isn’t sustainable.
While the sharp January 2008 global stock selloff briefly drove the NYSE BPI under 20%, for the rest of our current bear until this month the 20%ish levels easily held. But last week this venerable indicator plunged under 20% again before finally bouncing at the unimaginable level of 2.8% on Friday the 10th! Just 2.8% of the 3300 or so stocks in the NYSE still had buy signals showing on their P&F charts. It was crazy.
Such levels have never before been witnessed, it felt like BPI Armageddon. The NYSE BPI hadn’t been that low in the early 2000s, during the 1998 financial crisis, during the 1987 crash, nor during the mid-1970s bear. So if you are dismayed that your stocks with great fundamentals have been sucked into this nightmarish orgy of selling, realize there has been no refuge within the stock markets. The damage has been universal.
In past bears, certain sectors (particularly in commodities stocks with strong underlying commodities’ prices) have been able to climb despite broad-market selling. Not this time. The carnage has spared no sectors and virtually no stocks. This sobering (and painful) realization made me interested in the breadth of the selling in the early-2000s bear. I wanted some perspective on all this craziness of late.
So I looked at a couple metrics, again derived from the broad-based NYSE Composite. The first is advancing stocks on the NYSE as a percentage of all NYSE stocks. And the second is the percentage of new 52-week lows in NYSE stocks. The charts of these metrics across the last cyclical bear and bull really drive home just how anomalous and extraordinary the events of the past couple weeks have truly been.
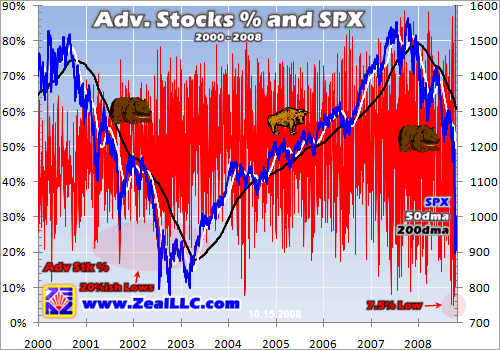
The raw NYSE-advancing-stocks percentage is extremely volatile as you can see, but we are just concentrating on the extreme lows. During the last bear, it was rare to see this measure below 20%. Even in downlegs, enough sectors and stocks were holding their own so there was always a place within the stock markets to take refuge. Gold stocks were one such area in the early 2000s, they soared despite the SPX being cut in half.
But even before the stunning events of the past couple months, this indicator had spent over a year witnessing many sub-20% days. Sectors and stocks with negative correlations to the headline stock indexes were getting harder to find. And late last week, this indicator fell to an unbelievable 7.5%. The markets were so overwhelmingly down that less than 1 in 13 stocks managed to eke out a small gain.
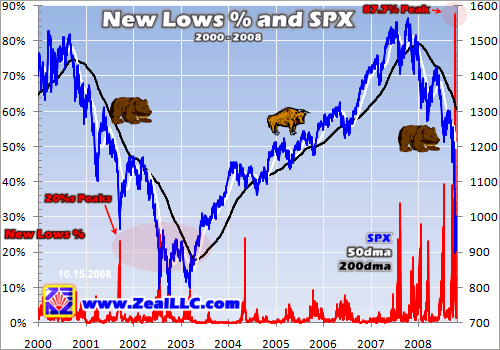
The overwhelming breadth of this intense selling is also apparent in the number of NYSE stocks that were hitting new 52-week lows. Once again the degree to which this recent selloff was unprecedented is just staggering. I am torn between feeling privileged for witnessing such an anomalous event and punished for investing and speculating in stocks through it. Market historians will study this event for decades.
Back in the early-2000s bear, even at the climaxes of the very worst downlegs new lows as a percentage of all stocks only pushed into the 20%s. And at the bottom of that bear, after a 49.1% decline in the SPX, only 17.8% of NYSE stocks were trading at fresh 52-week lows. It is really interesting that even deep in a serious cyclical bear the vast majority of stocks weren’t simultaneously driven to new lows on the day that bear climaxed.
Fast-forward to the present. We were already seeing much larger new-lows percentages in January, March, and July 2008 than witnessed at the very bottom of the last bear. And starting last week, this breadth-of-selling indicator soared off the charts. Here there be monsters indeed! On Friday October 10th a mind-blowing 87.7% of the stocks in the entire NYSE simultaneously hit new 52-week lows! This has never come close to happening before.
Such broad selling, sparing no sectors and few stocks, happening simultaneously on one day is way outside the usually restrictive realm of market history. To some extent, all trading models are based on historical norms and boundaries. So when the markets do something that no one has ever seen before, and few even thought possible, everyone with capital deployed is going to suffer some outsized losses.
Thus the last couple weeks rattled everyone involved in the markets. Investors and speculators, professionals and amateurs, hedge funds and mutual funds, big stocks and obscure stocks, virtually no one and nothing was spared. The technical and sentimental extremes we have just witnessed in this bear dwarf anything ever seen in history’s previous bears. We are deep into uncharted territory, way out on the extreme end of the probability band of what is even possible.
Despite this big mess, all this government meddling exacerbating selling, this seemingly endless reservoir of fear, some key principles still remain true. First, for investors and speculators alike the best time to buy stocks is when fear is extreme and the mere thought of stock investing is sickening. Second, emotional extremes can never persist, no matter how incredibly large and overpowering they have ballooned.
Just as fear is not infinite, stocks are not going to zero. While some stocks are junk, the vast majority are not. The best represent fractional equity ownership in elite companies engaged in profitable businesses in promising sectors. A sharp 2-week selloff, or even a long 2-year bear in most cases, does not alter their core fundamentals. They will continue earning profits and creating value for shareholders going forward as they have done for many decades.
Benjamin Graham, Warren Buffett’s mentor, is the famous father of value investing. Among his many brilliant observations is that the markets are a voting machine over the short term but a weighing machine over the long term. Over the short term traders “vote” their emotions by buying or selling, sometimes resulting in wild and irrational stock prices. But over the long term stocks are truly weighed and will ultimately reflect their fundamental value to create earnings for their shareholders.
With stocks “voted” down to ridiculously low levels through highly emotional panic selling, great opportunities exist today for investors and speculators. Even though we are deep in a secular bear, this current cyclical bear has driven stocks down near the bottom part of this secular bear’s range. While the SPX could fall lower still, it isn’t likely to go much lower than 800 before a big cyclical bull erupts that should eventually drive a double in this index. You can invest now when prices are artificially low.
For speculators, this incredible fear that drove such bear extremes cannot persist. And when it yields, after everyone who is going to sell has sold, the resulting V-bounce and bear rally should be massive. Since there is often symmetry between the size and sharpness of the preceding downleg and the resulting rally, we should be in for a big one. While tough to time, speculators long when this erupts will make a killing.
As life-long investors and speculators ourselves at Zeal, we have been hit hard by this brutal selloff too. Companies in sectors that have done really well in previous bears, mainly commodities, have been beaten into pulps this time around. Nevertheless, despite all of the short-term pain it is essential to maintain perspective and keep the long view. This selloff, like all before it, shall pass as well.
We will keep studying today’s markets, researching market history for context, analyzing everything, and making trades accordingly. The bargains to be seen at this bottom, whenever it arises, are going to be tremendous. If you’d like cutting-edge analysis and commentary on all this craziness, all focused towards launching real-world trades, subscribe today to our acclaimed monthly newsletter. We’ll keep you calm and focused.
The bottom line is this incredible recent selloff has indeed been largely unprecedented in market history. It was compressed into a lot shorter period of time than normal, even for a major cyclical bear. Nevertheless, even this fear is finite and has to soon burn itself out. All bears ebb and flow and this one will be no exception. Don’t make the mistake of extrapolating the present into infinity. It never works in the markets.
While it is awfully hard to buy when everyone thinks it is lunacy, that the markets are going to spiral lower indefinitely, this is the time when fortunes are made. It is not often that an irrational selling frenzy drives virtually every stock you’ve ever been interested in owning to multi-year or even multi-decade lows. Brave contrarians willing to buy into this fear are going to reap fortunes as the markets recover.
Adam Hamilton, CPA October 17, 2008 Subscribe |
|||||||
|
|
|
|
|
|
|
|
|
|
|
|
|
|
|
|||

