|
|
|||||||
|
|
|
|
|
|
|
|
|
|
|
|
|
|
|
|
|
|
|
Tactical Oil-Stock Trends Adam Hamilton March 24, 2006 3009 Words
Out of all the major commodities-stocks sectors that are thriving in today’s commodities bull, oil stocks are probably the surest thing. While their ultimate returns won’t be as high as smaller high-flying sectors like precious-metals stocks, oil stocks have a vastly superior ratio of potential returns to risk.
In other words, oil stocks are almost certainly the least risky commodities-stock sector in which to deploy capital today. This unique attribute of oil stocks is a product of several factors including the global importance and fundamentals of oil, the massive size and scale of the oil companies, and their unbelievably low valuations.
Oil is the lifeblood of modern civilization, and despite countless attempts to render it less important no suitable energy substitute is anywhere close to being found. All over the world people, companies, and nations will not hesitate to buy oil products regardless of their price. Global demand growth is outstripping global supply growth as the world becomes more explored and fewer giant oilfields remain to be discovered.
Since the world oil markets are so big and essential, the companies taking the immense risks necessary to pump and transport this crucial commodity have also grown very large. The raw size and scale of the oil companies, on average, utterly dwarfs those in every other commodities sector. The bigger companies are, the less they are buffeted about my shifting tides of capital flows and the less prone they are to sudden movements up or down.
But as tech investors learned in 2000, even big companies are not immune from major stock declines. When companies get too pricey relative to their earnings power an adjustment lower is all but inevitable. The most important attribute of the oil stocks is not their size, but their valuations. Today oil stocks are dirt cheap in fundamental terms, the biggest bargains relative to their earnings streams in the entire stock market.
Earlier this week in our Zeal Speculator alert service I compared the valuations of the six biggest oil stocks with the six largest NASDAQ stocks. The six biggest oil majors commanded a staggering $1146b in market capitalization. The six biggest NASDAQ 100 stocks were a bit smaller with a combined market cap of $802b. To gain a sense of scale on how big these numbers truly are, the total NASDAQ 100 market cap is about $2050b.
These giant tech stocks had an average P/E ratio of 31.9x earnings, which is still above the 28x level that has marked major stock-market bubbles in history. Meanwhile the six elite oil majors had an average P/E ratio of only 9.6x! This is just slightly above the 7x levels that flag multi-decade market lows in history, the only times when long-term investors are virtually guaranteed big wins by buying blue-chip companies at fire-sale prices.
Thus, earlier this week a single dollar of elite oil-company earnings only cost 30% as much as an identical dollar of elite tech-company earnings. At their current low valuations probabilities overwhelmingly favor oil stocks moving much higher just to reach normal fair-value levels at 14x earnings. These low valuations have created a stunning intersection where commodities investors’ interests are overlapping with those of value investors. The combined capital of both these groups should continue flooding into oil stocks.
Given their unparalleled importance in the global economy and cheap valuations, the risks in oil stocks are very low today despite their awesome run higher last year. But even with these overwhelmingly bullish fundamentals, oil-stock investors and speculators remain quite skittish. Oil stocks are the best buy in the commodities-stock world as well as the greatest value-investment opportunity today, yet they are being largely shunned. Why?
I suspect the answer to this crucial question is two-pronged. While Wall Street is slowly making the adjustment to realize that $60+ oil is not an anomaly but a new base, this truth hasn’t yet fully dawned on all funds and advisors. Many still think oil prices are going lower and don’t want to buy into oil companies if their profits will be falling. But if oil stays near $60 or above as fundamentals suggest it should, then oil companies are way too cheap today.
The second factor is the oil-stock technicals. Since oil stocks retreated sharply in early February and have been rather choppy since, perceptions of them are tainted at the moment among technically oriented speculators. But in their proper perspective, the tactical oil-stock trends actually look really bullish today. I am penning this essay in the hopes of illuminating these promising oil-stock technicals.
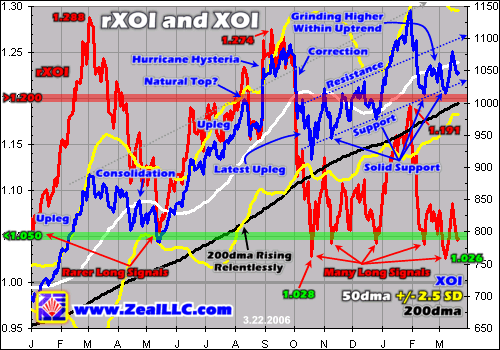
As always, the best proxy for analyzing oil stocks as a sector is still the Amex Oil Index, better known by its symbol XOI. Our first chart examines this index over the last 15 months or so, continuing a line of research from last November. The XOI and its technicals are graphed in blue on the right axis. Underneath the XOI is the Relative XOI, or the XOI divided by its key 200-day moving average. This rXOI forms a horizontal trading range where Relativity-based long and short trading signals are defined.
While this chart looks busy, it is really pretty easy to understand. We’ll start with the blue XOI line that represents the progress of oil stocks as a sector. Note that the oil stocks surged a couple times in 2005 in major uplegs to reach new interim highs. But after these highs were reached, as in all bull markets, sentiment was waxing too ecstatic so a consolidation sideways or a correction downwards was necessary to rebalance sentiment and lay the foundation for the next major upleg.
In order to gain perspective on and better understand what is going on in oil stocks today, we need to start back in August. On August 11th the XOI managed to close over 1000 for the first time in history. The next day it crawled a little higher and reached its apex, but after all this excitement a correction was necessary to restore sentiment balance. The XOI fell sharply in the next few days which left what looked like a natural interim high in the index.
Over the following couple weeks the index consolidated just as it had done between March and May after its previous upleg. But this normal and healthy consolidation was interrupted by an extraordinary event, hurricane Katrina slamming into the Gulf Coast. In the weeks after that disaster as the markets tried to determine how much damage was done to critical oil infrastructure, oil stocks were bid up sharply.
But by the end of September, oil prices had stabilized and it had become readily apparent that the worst-case infrastructure-damage scenarios had thankfully not come to pass. In early October the XOI responded to this and plummeted in a brutally sharp correction. This correction was exacerbated by a couple factors. First it was overdue since August and second it happened from an unnaturally high level driven by the hurricane hysteria.
After a gut-wrenching plunge in early October, the XOI bounced. Oil-stock investors realized that oil near $60 was still an incredibly profitable level for established oil companies so they started buying back in. The XOI then meandered higher and started carving a new uptrend for the next couple months. Then it surged mightily in January as some of the annual flood of year-end pension capital that deluges into the markets sought a home in oil stocks. The XOI was once again overbought by early February and corrected hard yet again to rebalance sentiment.
Since this sharp February correction, which blasted many oil-stock positions back down to their trailing stops, oil-stock investors and speculators have been overly pessimistic on the oil stocks. Despite their amazingly low valuations, the wall of worries that confronts every bull is still looming large in the minds of oil-stock traders. But while oil stocks may feel weak compared to their late January levels, in reality their overall technical uptrend remains quite strong.
The latest XOI tactical uptrend channel is rendered on the upper right side of this chart. With the exception of the mighty January surge and its aftermath, the XOI has been nicely meandering higher within this uptrend. It has tested its support no fewer than four times in four different months since its latest interim bottom and every support test has passed with flying colors. The support underlying this latest XOI uptrend remains rock solid.
Since its October interim bottom, the XOI has been carving a series of higher lows and higher highs. Even after its sharp February correction the XOI is still grinding higher within its uptrend. Technically this is very bullish behavior and is nothing to be concerned about. The important comparison for oil-stock traders to make is not from late January to today, but from the October lows to today. The XOI is now in a textbook-perfect bull-market uptrend!
Next I’d like to direct your attention to the red Relative XOI line, slaved to the left axis. Like all bull markets, the XOI bull flows and ebbs. It surges higher in magnificent uplegs and then periodically retreats in healthy corrections. This natural rhythm can be quantified by measuring the distance between the XOI and its 200-day moving average, which is rendered in black above. When the XOI is close to its 200dma a new upleg is probable and when it is stretched far above its 200dma a correction is highly likely.
The rXOI expresses this key relationship as a constant multiple which forms a horizontal trading band. As I showed in November, the XOI tends to oscillate between 1.05x its 200dma on the low side to 1.20x+ its 200dma on the high side. The highest-probability-for-success time to add new long positions in oil stocks is when the XOI is within 5% of its 200dma. Interestingly the XOI’s recent behavior that is irritating investors has also created a dazzling opportunity to load up on elite oil-stock positions.
From mid-2003 to late 2005, rXOI long signals were fairly rare. There were only five of them over this entire time frame and they were very short-lived, so investors and speculators did not have many ideal chances to deploy capital in oil stocks. But since last October, there have been no fewer than six more rXOI long signals! There have been more awesome relative opportunities to buy oil stocks in the past six months than in the preceding two years combined!
Thus at Zeal we have been looking at the XOI’s lethargic meanderings near its 200dma as a huge opportunity. Since November we have been heavily researching and continually adding new oil and gas trades to our portfolios in both of our newsletters. Rather than considering the XOI’s long convergence with its 200dma as a burden, I think it provides an exceptional opportunity to throw long before Wall Street and value investors realize what a great deal oil companies are and flood in with a vengeance driving their prices much higher.
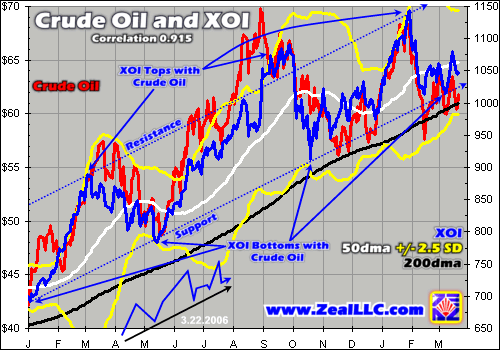
Today many oil-stock investors are also concerned that oil stocks will follow the general stock markets, so if a selloff in the markets ignites it could drag the oil stocks down with it. But in reality the primary driver of oil stocks by a huge margin is the price of crude oil. The biggest technical risk the oil investors face is not a general market selloff, but a decline in the oil price. Oil stocks are only a wonderful bargain if oil prices remain near $60 or higher. Check out the XOI’s stellar correlation with crude oil.
Over the past 15 months the XOI’s daily price correlation with crude oil has run 0.915. This translates into a high 84% r-square value, which suggests that 84% of the daily price action in the XOI over this period of time was directly explainable by the daily price action in oil. Although there are times above like in October where the XOI briefly diverged with oil, for the most part the blue XOI line fits in with the red oil line like a lock and key. Oil is indeed the key to unlocking oil-stock performance.
Over this same period of time the XOI’s correlation with the S&P 500 was much lower at 0.784. Thus the XOI only followed the S&P 500 61% of the time. And a lot of this correlation exists simply because both oil and the general stock markets happened to have strong years in 2005. The levels that oil stocks ultimately achieve depend on their profits, and their profits depend solely on the fortunes of oil prices and have nothing to do with the general stock markets.
Since this chart is less busy than the first one, I used it to illustrate a couple more points about the XOI technicals. First, note that the XOI is also in a much larger uptrend as well. This strategic trend channel is well-defined with multiple support and resistance intercepts. Today this flagship oil-stock index remains near its lower support, a great time to buy. And the XOI’s latest pullback in early March bounced right at this long-term support line. This shows that no strategic technical damage has been done to the XOI’s uptrend at all.
In addition, the late January highs in the XOI turned south right at its resistance. This is what probabilities favor and what traders should have expected. The endless bouncing between support and resistance creates a sawtooth pattern in bull markets, as the stylized drawing on the bottom of this chart shows. The best times to buy oil stocks is near the bottoms of these XOI sawteeth when it is near its 200dma. Longer duration 200dma approaches, even though they distort this sawtooth pattern, are far more advantageous to investors since they leave more time to buy oil stocks at relatively low prices.
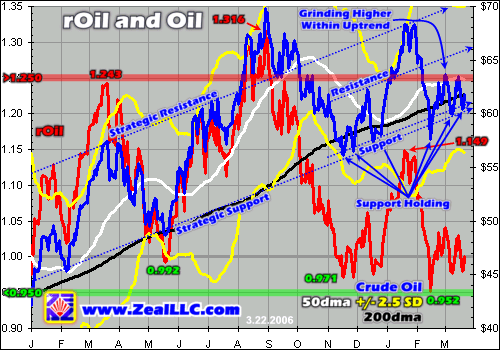
As is also readily apparent above, the XOI tends to top with crude oil and bottom with crude oil. Oil drives the oil stocks since it alone determines their ultimate profits. Thus the best time to buy oil stocks is when crude oil is technically low near an interim bottom. Not surprisingly, as our final chart illustrates, this is the case once again today. Oil’s loitering of late near its 200dma has created a rare extended opportunity for investors and speculators to buy the elite leveraged oil stocks.
Oil’s chart is not surprisingly much like that of the XOI that so diligently mirrors it. Since November the oil prices have been grinding relentlessly higher within a new well-defined uptrend. The support under this new uptrend is rock solid. It has already been tested a half-dozen times yet the oil price just refuses to decisively break under it. And within this uptrend oil is carving higher lows and higher highs, the definition of a bull market.
While oil’s tactical technicals look great and suggest it is heading higher which will drive up the XOI along with it, its longer-term strategic technicals look wonderful as well. Oil has created a nice major uptrend over the past 15 months that has only been briefly violated for a couple months late last summer. And that was an upside breakout, which investors never complain about. Today oil is looking beautiful technically at both scales and is likely to continue powering higher in its secular bull.
Now if oil is heading higher as fundamentals and technicals suggest, then the profits of the oil stocks are going to continue climbing as well. In Q4 the oil price averaged $60, which drove all-time record profits. So far this quarter, oil prices are averaging over $63, or 5.4% higher! Thus as the Q1 profits are reported by oil companies in the coming weeks they should once again reach new all-time record highs. This will drive their already low valuations even lower!
Ultimately a stock is nothing more than the fractional ownership of the future profits stream of a business. The higher the profits that any particular company earns, the higher its stock price will be bid as investors compete for these profits. Higher oil prices will lead to higher oil-stock profits which will guarantee higher oil-stock prices in the months and years ahead. Both commodities investors and value investors will be scrambling to own these incredible oil companies.
At Zeal we have been thrilled by and very grateful for the XOI’s long visit near its 200dma since late last year. Before that in the preceding couple years neither oil nor the XOI have loitered around their 200dmas for very long during their periodic convergences. But in the last six months we have had a half-dozen awesome opportunities to deploy capital into elite leveraged oil-stock speculations and investments. We will continue to research and layer in oil-stock trades and recommend them in our newsletters as long as this anomaly persists.
I don’t think this rare opportunity will last for long though. The moment Wall Street and the value investors finally decide that $60+ oil is here to stay, they will stampede into the ridiculously underpriced oil stocks. Oil stocks are now priced for an oil environment far lower than $60 so they will have to adjust soon to reflect the new global fundamental oil realities. If you want to deploy into the elite oil stocks before this happens, please subscribe today!
The bottom line is today’s tactical oil-stock trends look very bullish, despite all the grumbling due to their early February correction and its aftermath. Oil stocks remain in a strong new uptrend, their primary driver crude oil remains in a similar powerful uptrend of its own, and on top of all this oil stocks are probably the most undervalued sector in not just commodities stocks but the entire stock markets.
Even if oil goes no higher than $60, which is very unlikely, many big and small oil stocks alike will have to double from here just to hit fair value. And if oil goes higher as its fundamentals suggest it should, the stocks will have to adjust even higher. Investors and speculators who deploy capital to ride these trends will probably earn fortunes.
Adam Hamilton, CPA March 24, 2006 Subscribe |
|||||||
|
|
|
|
|
|
|
|
|
|
|
|
|
|
|
|||