|
|
|||||||
|
|
|
|
|
|
|
|
|
|
Trading the Oil-Stock Bull Adam Hamilton November 4, 2005 2985 Words
On August 30th, the day the world started to realize just how devastating hurricane Katrina would prove to be for US oil-refining infrastructure, crude oil closed just under $70. Like any euphoric sentiment top, oil prices were a universal topic of interest as they crested.
But whenever a price extreme becomes so well known that it dominates even the general news media, a reversal is imminent. Markets abhor extremes. Since then oil has corrected considerably, off 14% so far. A couple weeks ago I examined this ongoing crude-oil correction and its probable technical downside targets.
Periodic corrections, completely natural and healthy in any secular bull market, often create awesome buying opportunities for investors. While oil was definitely overbought when Katrina hit, its long-term global supply and demand fundamentals remain dazzlingly bullish. Oil demand continues to grow worldwide but supply growth just canít keep pace as it gets more and more difficult to find major new oilfields.
With their product in high demand and supply growth constrained, oil-producing companies are likely to thrive for years to come. Regardless of how much people like to complain about high energy costs, virtually no one is willing to severely curtail their own energy usage. Despite the naysayers, so far oil demand has been remarkably inelastic, it hasnít fallen much despite the new higher equilibrium prices.
And, amazingly after their nearly three-year bull run, most oil companies remain fundamentally undervalued! Many are now running low P/E ratios around 10x earnings, under 14x fair value. Compare this to the NASDAQ 100 which is still trading over 30x earnings. Every dollar oil companies earn today only costs about one third of what an identical dollar of technology-company earnings is going for. Talk about bargains!
Oil-stock valuations remain so low because investors donít yet fully believe that $50+ oil is the new fundamental reality. High oil prices are not a short-lived shock anomaly, but the only possible economic response to a world where oil demand growth will outstrip supply growth for many years to come. Eventually oil stocks will be bid up to and beyond normal valuations, and investors who ride this secular trend ought to make fortunes.
Even in light of this rosy outlook, prudent investors and speculators still want to deploy capital into oil stocks only when they are relatively low. The best time to buy is during the periodic oil-stock corrections when they are the most beaten down. Buying these interim lows provides the most bang for the buck and the highest potential returns.
For quite some time now we have been extensively researching oil stocks at Zeal and looking for the best of the best to buy and recommend to our clients. While picking great companies likely to thrive is important, so is timing our actual oil-stock purchases. As such, oil stocks must be analyzed technically to give us an idea of where the high-probability bottoming zones will appear during their periodic corrections. How low are they likely to go?
The best proxy for analyzing oil stocks as a sector is probably the popular Amex Oil Index, or XOI. The venerable XOI, launched over two decades ago, is currently comprised of 13 major oil stocks. It is designed to track widely-held corporations involved in the exploration for, development of, and production of petroleum. It is to oil stocks what the HUI is to gold stocks.
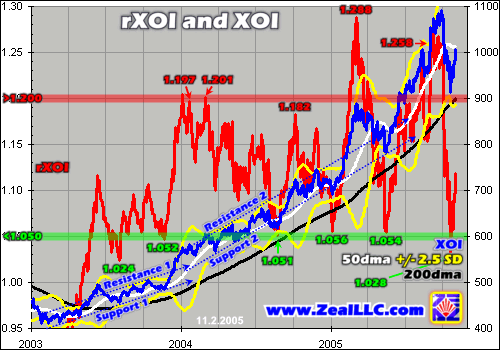
Speaking of gold stocks, Iíd like to start by applying a technical tool to the XOI that has served us very well in gold stocks. Since all bull markets tend to diverge away from their 200-day moving averages in uplegs and then periodically converge back down to them in corrections, I developed a tool called Relativity to quantify this phenomenon. It simply divides the XOI by its 200dma to create the Relative XOI, or rXOI.
The rXOI shows where the XOI trades over time as a constant multiple of its baseline 200dma. Charted in red below, it creates a horizontal trading band. Bull markets tend to have some regularity in the magnitude of their swings away from and back to their 200dmas, yielding high-probability-for-success long and short signals. If todayís oil-stock bull also exhibits this common tendency, then rXOI extremes will help reveal optimal buy times.
Indeed the rXOI does form a horizontal trading band, although it is far better defined on the lower buy end than the upper sell end. This tendency is normal and is certainly not a problem. Buy timing for oil-stock deployments is critical, but sell timing is not as important. Sell decisions are best left to mechanical trailing stops since they eliminate all emotion. On the sell side oil stocks can run as high as they want and then automatically back into their stops when a particular upleg grows too overbought.
On the buy side, major XOI lows have so far tended to occur within a remarkably tight range of rXOI 1.02 to 1.06. Their accompanying rXOI levels for six major XOI lows are noted above in green. They average XOI bottoms at about 1.044x its 200dma. After every one of these near approaches of the XOI to its 200dma the index rallied strongly. As such, I am initially defining the rXOI buy zone as levels near and under 1.05.
Investors and speculators interested in deploying into oil stocks probably have the highest probability of success if they wait to buy until the XOI is within 5% of its anchoring 200-day moving average. The last such opportunity flashed very briefly, for just two days, in late October. For a variety of reasons that will become more apparent below though, I suspect the rXOI will once again revisit sub-1.05 levels before the next major oil-stock upleg truly begins.
On the sell side the major XOI highs have corresponded to rXOI levels running from 1.18 to nearly 1.29. Note in the chart above that the particular rXOI levels noted occurred on days of actual XOI tops, which are not necessarily the exact same days as the rXOI tops. If the rXOI levels at these major tops are averaged, they yield 1.225. Since their range is so volatile though, I am initially assigning an rXOI sell level of 1.20.
When the XOI stretches more than 20% beyond its 200dma in the future, investors and speculators should prepare for a correction. Investors can ratchet up their trailing stops, tightening them from maybe 20% normally to 10% or so to ensure they are stopped out sooner in a pullback. Speculators can sell stocks outright, close oil-stock call positions, and/or add oil-stock puts when rXOI 1.20+ levels are reached. The higher the rXOI travels, the higher the probability a major correction is imminent. It doesnít loiter at upper extremes for long.
This relative analysis of high-probability interim bottoming and topping zones in the XOI can be augmented by standard technical analysis. So far in its bull to date, which is rendered in its entirety in all the charts in this essay, the XOIís major support line has steepened. Initially in 2003 the XOIís upslope was moderate, but in 2004 a new steeper support line formed that has held well into this year. A third steeper-still support line may be forming now, but weíll have to wait a couple more months to know for sure.
Progressively steepening support lines are common in secular bull markets. Identifying the current one is very useful as countless traders still watch linear support zones. When the oil-stock sector hits its current support line, which remains under 900 at this point, odds are a bounce will ensue. A big part of technical analysis is gaming othersí responses, and few price conditions elicit more buying excitement than hitting major support.
There is one more technical observation above that may prove profitable. The XOIís black 200dma line has risen in a constantly accelerating upslope since 2003, which draws the initial lower part of a parabola. If this parabola continues, oil stocks would launch vertically in the next year or so and then crash. Such an event is extremely unlikely though. Vertical blowoff tops are not likely to occur in the middle of secular bulls, but only near their ends.
During the middle years of most bulls, the 200dma upslope moderates and flattens a bit before heading higher. This has occurred in gold prices worldwide as well as gold stocks. The only way for the XOIís 200dma to flatten is for the index to trade under it for a considerable period of time. Obviously if this happens the rXOI numbers will fall under 1.00. This is one reason why I am not convinced the late October XOI lows were the final interim bottom for this particular correction.
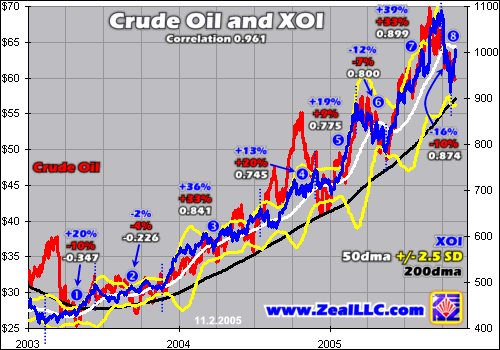
What could drive the XOI under its 200dma? Probably one of its two primary drivers. So far in its bull to date, the main influences on the timing of major uplegs and corrections in the XOI appear to be the price of crude oil itself as well as the general stock marketsí fortunes. Our next two charts will explore each of these driving forces in turn, examining their respective correlations with the XOI.
Both of these charts are divided into 8 corresponding sections to offer higher-resolution correlation analysis. In 2005 these sections each mark major uplegs or corrections. But in 2003 and 2004 they just mark periods of time ending in either a major interim top or bottom since the delineations between uplegs and corrections were much more ambiguous back then thanks to the shallow corrections.
Blue numbers note the XOIís performance in a given section, red numbers show crude oilís performance, and the white numbers reveal the correlation between the daily closing prices of the XOI and oil within each section. Not surprisingly the correlation between the XOI and its driving crude oil has been very high.
In 2003, somewhat surprisingly, the initial correlations between the XOI and crude oil were negative. As the following chart examining the correlation between the XOI and the general stock markets will show, the early XOI bull seemed to be driven purely in sympathy with the strong war rally in general stocks. As 2004 dawned though, the correlation between the XOI and oil synchronized just as it ought to in parallel secular bulls.
I am particularly interested in the correlations between the XOI and oil starting in late 2004, when the XOI really began exhibiting the major-upleg-followed-by-major-correction pattern so typical in secular bull markets. In sections 5 to 8 above, roughly the past year, the correlations between the XOI and oil have averaged 0.837. When this correlation is squared, it yields an r-square value of 70% which is important for traders to consider.
The correlation squared, or r-square, is a statistical construct that describes how likely the changes in one data series will be able to explain the changes in another. At 70% in this case, 70% of the daily price moves in the XOI over the past year or so are likely predictable by the parallel daily price moves in crude oil. As goes crude, so ought to follow the XOI. And this relationship is even strengthening as the correlations have been trending higher since mid-2004.
With the XOIís correlation with oil so high, odds are it will follow oil lower in its current correction. A couple weeks ago I looked at oil technicals and three separate perspectives yielded a probable downside target for oil of $55ish. If oil goes from its nearly $70 levels of late August to $55 in the coming weeks, this will represent a 21% correction right in line with its bull-to-date average. So far though it is only off 14%, or two-thirds as much as is probable.
If oil still has a third or so of its own correction to go yet, and the XOIís correlation with it is strong and growing stronger, then it is reasonable to expect the XOI to keep correcting under its 200dma as long as oil is weak. Thus this current XOI correction will probably carve a low well under the usual 1.05x rXOI buy zone. I am really excited for this probable interim XOI low as it should offer fantastic buying opportunities for oil stocks.
Unfortunately though, oil stocks face one complicating factor that gold stocks do not. While gold stocks are still hardcore contrarian, almost totally overlooked by the mainstream, oil stocks are certainly finding their way into mainstream portfolios. If the general stock markets correct sharply as they ought to due to extraordinarily high complacency, will mainstream investors throw out the baby with the bathwater and dump oil stocks too?
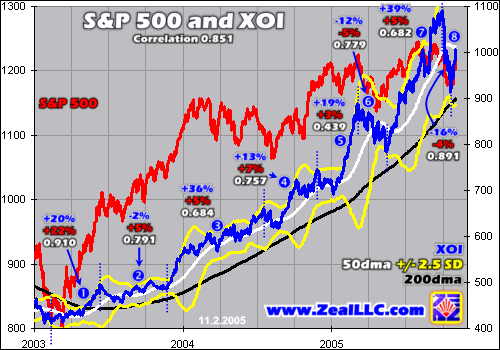
Our final chart examines the correlation between the XOI and the S&P 500 (SPX), the best proxy for the US stock markets as a whole. Back in June I wrote an essay delving into this relationship in more depth if you are interested. If the XOI is more highly correlated with the SPX than oil, then our long-awaited major XOI low may not come to pass until a major stock-market correction drives oil stocks lower.
Back in early 2003 the general stock markets were correcting dramatically, near bear-to-date lows, as Washington prepared to invade Iraq. While nowhere near as weak as more mainstream stocks, oil stocks definitely shared in this carnage. But when the invasion began and the worst pre-war prognostications didnít come to pass, the stock markets soared heavenwards in relief and oil stocks joined the exciting ride.
In section 1 above the correlation between the XOI and SPX was very high, 0.91. After that it started to fade though. Sections 2, 3, and 4 averaged an XOI/SPX correlation of 0.744. This may sound fairly high, but it only yields a modest r-square value of 55%. In most of 2003 and 2004, only 55% of the daily moves in the XOI were statistically explainable and predictable by parallel daily moves in the SPX.
When we examine late 2004 and this year, the period of time when the XOI uplegs and corrections really started to get large and interesting enough to be tradable, the average XOI/SPX correlation has dropped even farther. Sections 5-8 average a correlation of 0.698, which translates into only a 49% r-square. And if section 8 is excluded, which is really too small anyway at only 9 trading days, these numbers plunge to 0.633 and 40%.
With the trend of correlations between the XOI and general stock markets dropping the higher the XOI climbs, this is great news for oil-stock investors. It appears that as this oil-stock bull gets more mature investors are realizing that oil stocks should move based solely on oil prices, not just in sympathy with the tides of fortune buffeting general stocks around. The more the old XOI affinity with the SPX fades, the lower the probability a major general-stock correction will obliterate oil stocks as well.
This is very encouraging. With the XOI and crude-oil correlation growing at the same time the XOI and stocks correlation shrinks, odds are we should see a major interim low in the XOI near crude oilís own low in the coming weeks. While I do suspect that the XOI will still be susceptible to a sharp general-market correction if it materializes, the damage it wreaks in oil stocks should be far lower than it would have been a couple years ago.
In light of all this data, it really looks like a major buying opportunity in oil stocks is rapidly approaching. They are correcting right alongside crude oil and before oilís correction matures it ought to even pull the XOI below its 200dma to its lowest relative levels since 2003. It may even prove to create the best relative buy-low opportunity of this entire bull to date.
Even though oil stocks are undervalued now, they will be even more undervalued at such a major interim low. To be able to buy the elite oil-producing companies that are likely to lead the stock markets in the ongoing great commodities bull at very low valuations is extremely exciting. And with the XOI gradually decoupling from its old tendency to track the S&P 500, we donít have to be as concerned about stock-market weakness adversely affecting our oil-stock trades after the crude-oil low.
At Zeal we have been waiting a long time for this potentially amazing oil-stock buying opportunity. Weíve been researching oil stocks for a year now and are patiently waiting for a great time to buy. I am really excited about our upcoming oil-stock campaign and see vast opportunities. As we make actual trades ahead, we will certainly detail them and recommend them in our acclaimed newsletters. Please subscribe today!
The bottom line is oil stocks, like all bull markets, flow and ebb. Today they are ebbing in a healthy periodic correction. With their increasing correlation to crude oil, they will probably continue correcting until oil itself bottoms. When this happens, the oil stocks will probably be as relatively inexpensive as we are likely to see again for a long time. And with the oil stocks tracking general stocks less and less, their risk of plunging with the stock markets wanes considerably.
Within secular bulls ideal buy-low moments in time are scarce and extraordinarily precious. To be able to buy the best producers of the worldís most important commodity barely a third of the way into a secular commodities bull at very low valuations is a priceless opportunity. I canít wait!
Adam Hamilton, CPA November 4, 2005 Subscribe |
|||||||
|
|
|
|
|
|
|
|
|
|
|
|
|
|
|
|||


