|
|
|||||||
|
|
|
|
|
|
|
|
|
|
Silver/Oil Ratio Extremes Adam Hamilton October 7, 2005 3097 Words
With energy prices so strong in 2005, even well before the hurricanes slammed into the Gulf, more and more investors are starting to pay attention to the long-neglected realm of commodities.
Just as sectors in stocks have interrelationships, so do sectors among commodities. Late next year when the new Microsoft Windows Vista operating system is released, a software event, it will drive massive sales of new computer hardware as early adapters upgrade to run all the new bells and whistles. This software release in one sector will spawn hardware sales in another.
Events in one commodity can also drive demand in another. For example, if lumber demand is up due to huge numbers of new homes being built, you can bet copper demand isnít far behind. The average new house uses about 440 pounds of copper. In this case lumber doesnít drive copper directly, but residential copper demand is sympathetic to and symmetrical to residential lumber demand.
One of the most well known commodities interrelationships exists between oil and gold. Oil is the most important commodity in our world, absolutely essential for transporting everything physical that needs to move from one place to another. And gold is the king of currencies, the only government-meddling-proof and inflation-proof form of money in six millennia of human history.
Since way back in June 2000 when oil was still under $30 and gold remained under $285, I have been studying and writing about the gold/oil ratio. Its basic lesson is simple. Over secular timeframes as goes one so goes the other. So if oil is up gold has a high probability of following sooner or later. While considered fairly heretical over five years ago, contrarians trading on this thesis including our clients have earned huge profits since.
One professional analyst even wrote me a few weeks ago and said he had seen one of our famous Zeal Gold/Oil Ratio charts shown on CNBC! This is fascinating as it means the mainstream is gradually starting to shine light on an important trading principle that contrarians have been profiting from for many years now. Like Army Rangers, contrarians lead the way to profits and mainstreamers eventually follow.
As Iíve been writing about this Gold/Oil Ratio over the years, I have received lots of feedback wondering about the Silver/Oil Ratio. Is there also a meaningful historical relationship between silver and oil? Can we profitably trade this relationship like we have done with the Gold/Oil Ratio? To address these intriguing questions, I investigated the silver/oil ratio this week.
Before we dig in, I have to acknowledge one major bone of contention on silver. No one, not even the central bankers who claim they own tens of thousands of metric tonnes of gold, disputes that gold is money. Since gold is money, it makes sense to price crucial things, like crude oil, in terms of gold. Gold is a timeless inflation-neutral currency that holds its value over centuries regardless of government machinations.
But the monetary nature of silver is heavily contested. There are some brilliant contrarian thinkers who believe that silver is money just like gold. They may be right. And there are other equally gifted monetary minds who are convinced silver is just another commodity, albeit highly alluring and speculative. Since there is not universal agreement about the monetary nature of silver, please be aware that the silver/oil comparison is not as philosophically tidy as the gold/oil one.
Indeed, one of the reasons silver has been struggling relative to gold in recent years probably has to do with this monetary struggle. Silver canít seem to decide at the moment whether it wants to trade like a precious metal, monetary behavior, or trade like a base metal, like another commodity. Personally I believe silver will trade like a precious metal ultimately with gains far eclipsing goldís in this bull, but I do acknowledge that the monetary case for silver is not as clear cut as goldís.
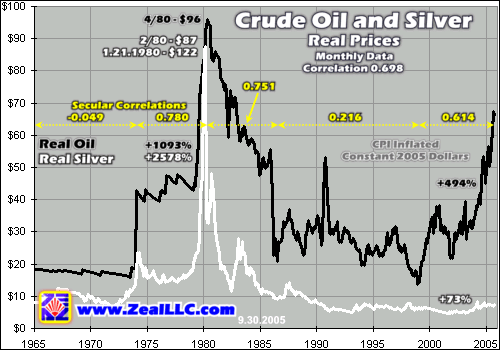
So pricing oil in silver certainly has some validity, but itís just not as sound as pricing it in gold. Nevertheless, silver and oil have had strong positive relationships and correlations during certain secular epochs in modern history. Of particular interest, during the last secular commodities bull in the 1970s silver tracked oil nicely. Our first two charts are inflation adjusted based on the US CPI, with oil and silver priced in constant 2005 dollars.
Weíve looked at inflation-adjusted oil and gold prices many times since 2000, but real silver prices are not as well studied. Diehard silver bulls like me have to get a tingle of excitement sparking up their spines when they see just how high silver went in its last major bull in todayís dollars. The numbers achieved are truly mindblowing!
On a monthly basis, and these charts are monthly since monthly numbers have less random noise for correlation analysis purposes, silver topped near $87 in todayís dollars in February 1980. But on a daily basis, silver achieved its record high of $122 per ounce in 2005 dollars back on January 21st, 1980. $122! So all those scoffers who think even $20 this time around is an outrageous silver target are thinking far too myopically for todayís monetary environment.
Since 1965, silver and oil have had a 0.698 positive correlation. This is strong, but nowhere near as tight as the gold and oil correlation of 0.816 over this same period of time. In order to dig down and better understand this long-term relationship between silver and oil, I divided the chart above into five secular periods based on major stages in oil price history. These are marked with the dotted yellow arrows shown above.
Before the US severed its dollar-gold standard and went to totally unbacked pure fiat currency in 1971, silver and oil actually had no correlation at all. But in the 1970s up to the 1980 commodities tops, the positive correlation between silver and oil jumped to its highest levels in history, 0.780. This is quite fascinating as silver and oil did have a strong positive relationship during the last great commodities bull, which was the period of time most like today.
After this bull market topped and started retreating in the first half of the decade of the 1980s, silver maintained its strong correlation with oil. But from the mid-1980s to the late 1990s, when oil ground sideways to lower in real terms, the relationship between silver and oil imploded. The correlation ran a very weak 0.216 which is not even statistically relevant. But since this latest oil bull launched in the late 1990s, silverís correlation with oil is once again strengthening.
This secular correlation analysis shows that silver does have a strong positive correlation with oil during secular commodities bulls and the secular bears that follow. The rest of the time silver seems to do its own thing, but when oil is moving up in a long-term bull silver tends to follow. This is great news for silver investors today who are hoping silver will catch a bid based on strength in oil and other commodities. Their thesis is rock solid historically.
Indeed silverís ultimate bull-market gains ought to dwarf oilís. In the 1970s commodities mega-bull oil blasted up nearly 1100%. But with a jaw-dropping gain of nearly 2600%, silver utterly dwarfed oil before their parallel bulls ultimately ran their courses. Silverís gains actually ran 2.36x those of crude oil in the 1970s. And if you look closely at this chart, the lionís share of silverís gains happened in the final year or so before its blowoff top.
Today crude oil is up nearly 500% while silver isnít even up 73% in its own bull to date. Even if crude oil was to stop its advance right here in a secular sense, extremely unlikely, then silver should have a long way to run yet based on 1970s precedent. At a similar 2.36x multiplier on oilís gains, silver would need to run 1166% or so before its bull gives up its ghost. This yields an ultimate silver target based on this thread of analysis near $55 per ounce!
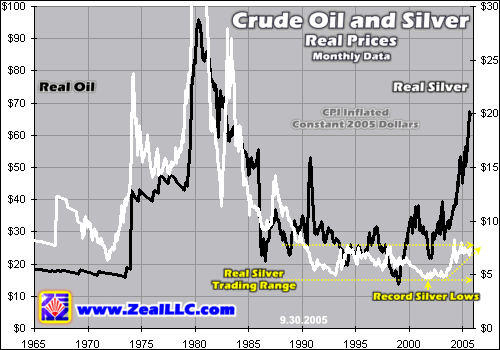
One problem with this chart is that silverís parabolic bubble top in 1980 was so high that it distorts the rest of its journey. In order to better see how these correlations stack up visually, I made another chart with the silver price clipped at $30 real in order to show better resolution on silverís non-bubble price activity. A couple of interesting insights emerge out of this second real silver and oil comparison.
As the correlation numbers above indicated, we can indeed see a visual parallel between silver and oil during the last great secular oil boom and bust of decades past. And silver did carve a record real low in US dollar terms right near the time oil was bottoming and preparing for its next major upleg back in 2001. Indeed only a few years ago silver in real terms was as cheap as it has ever been in US history and probably world history as well.
Another interesting aspect of this chart is silver has been locked in a tight real trading range running from roughly just under $5 to $8 in todayís dollars for over 15 years. Silver has made two recent attempts to break above $8 in real terms but has failed so far. But during one of these uplegs sooner or later silver will break through and this will be a hugely bullish event. Look for speculators to flood into silver once it decisively breaks out of its long-running inflation-adjusted trading range.
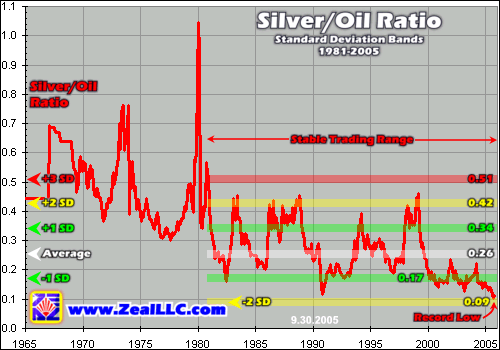
Now that we know there is indeed a historical relationship between silver and oil, especially during major secular bulls and bears, it makes sense to take a look at the Silver/Oil Ratio. This ratio, or SOR, simply divides the dollar price per ounce of silver by the dollar price per barrel of crude oil. It also offers some tantalizing price-target insights that silver investors and speculators will definitely appreciate.
At first glance this ratio appears to be a simple downtrend rather than a horizontal tradable trend pipe like the Gold/Oil Ratio. When I first created this chart I was kind of disappointed as it didnít look anywhere near as clean as the GOR. After drawing some trendlines and studying it a bit though, a stable trading range did appear out of the noise. From 1981 to today, nearly a quarter-century-massive slice of time, the silver/oil ratio does indeed have a stable trading range.
In some ways it even makes sense to cut out the activity prior to 1981. From 1971 to 1980 the commodities markets were grappling with a US dollar that suddenly had no basis in reality, a pure fiat paper currency. The commodities moves back then were so violent due to the currency adjustments that we are probably not likely to see such violently sharp moves again. After this adjustment more normal trading conditions returned.
During the past quarter century, on average the price of silver has been 0.26x the price of a barrel of oil. This average line, shaded white above, has been crossed nine times and nearly hit a couple more, so it is rock solid. Around this average, standard deviation bands are rendered. The SOR should be within +/- 1 SD 68.3% of the time, +/-2 SD 95.4% of the time, and +/-3 SD 99.7% of the time.
These bands help define the probabilities of any particular SOR extreme being sustainable. The further out from its 25-year average the SOR travels, the less likely it is to remain at such extremes. And today, interestingly, the silver/oil ratio is near its lowest levels ever. Silver is only worth 0.11x as much as oil, an unprecedented development in history. Markets abhor extremes and usually mean revert back to norms.
Using these probability bands, we can define various silver price targets based on likely SOR mean reversions. For instance, the SOR spent roughly half of its time in the past quarter century above its average. Maybe seven of these years it was more than one standard deviation above its mean. And for a cumulative time of a year or so it even traded two standard deviations above its mean.
So odds are the SOR will revert to these levels at some point. It is extremely likely to at least return to its average, very likely to overshoot and get to one standard deviation above its average, and there is a possibility it will even blast up to two standard deviations above its average. All we have to do is define a conservative oil price target and then we can use these SOR tendencies to define silver price targets.
Oil is in a secular bull, there is no doubt about it. Global demand is growing relentlessly, particularly out of Asia, yet world supplies are barely keeping up and no major new oilfields are being found. So oil prices are likely to continue higher for years to come on balance. But, even in long-term secular bulls, periodic corrections to bleed off over-enthusiastic sentiment are essential. Such an oil correction is seemingly in progress today following its storm-driven surge.
So far in its bull to date, oil has tended to correct to 95% of its key 200-day moving average. Based on todayís prices, this yields a conservative oil price bottom target of $53. If we set expectations for oil trading at this low price for some time to come, which is unlikely but conservative, we can use the SOR ratio to calculate some possible silver price targets.
As you can see above, in the past quarter century the SOR has spent very little time under one standard deviation below its mean. If the SOR only goes back up to these levels where it spent much time even since 2000, it yields a target silver price of $9.01 even at $53 oil. If the SOR reverts back to its mean, as it certainly ought to, this target rises to 0.26x the price of oil or $13.78 per ounce of silver. And at +1 SD, our silver target balloons to $18.02!
Now there is no doubt these silver targets feel high relative to todayís abnormally low silver prices. But the silver/oil ratio has traded in a strong horizontal trading range for a quarter century now and certainly illustrates that such silver prices are not only possible but quite probable. Most commodities tend to move together in secular terms and silver and oil are no exception to this rule. Silver really ought to follow oil higher.
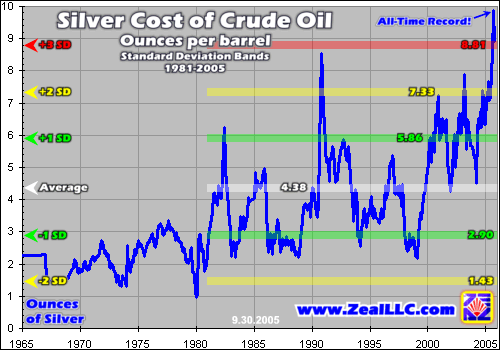
Another way to look at the relationship between silver and oil is the Silver Cost of Crude Oil, or SCCO. This number reveals how many ounces of silver it has taken to buy one barrel of crude oil throughout modern history. While this number has been steadily climbing just like the SOR has been falling, in the last 25 years some semblance of a trading range has emerged. And todayís all-time-record high SCCO is almost certainly not sustainable.
Today crude oil priced in silver is way over three standard deviations above its quarter-century mean! Such massive divergences are very rare in the financial markets and are never sustainable. The only other time in history that the silver cost of crude oil even came close to +3 SDs was in the early 1990s when Iraq invaded Kuwait. And as you can see above that earlier spike promptly crashed back down to a far more reasonable average level.
Even though the monetary nature of silver is contested, we can still use these SCCO standard-deviation bands to define similar targets for silver. If oil drops to the $53 correction low described above and the SCCO mean reverts to various standard deviation bands, it gives us potential silver targets that silver is likely to meander to as the comfortable trading relationship between silver and oil during bulls reasserts itself.
If the SCCO merely goes back to +2 SDs, a high probability, it will take 7.33 ounces of silver to buy a barrel of crude oil. At $53 this works out to a silver price of $7.23, about todayís levels. But odds are the SCCO will mean revert even farther, to +1 SD, the mean, or maybe even -1 SD. At +1 SD the silver price would rise to $9.04 at $53 oil. At the mean it would catapult to $12.10. And at -1 SD silver would need to hit $18.28!
This is obviously wonderful news for silver investors. Silver and oil have a strong positive correlation during oil bulls and their ratios tend to trade within reasonably well-defined trading ranges. If the conservative ends of these ranges hold and even if oil corrects, silver prices still ought to go a lot higher from here based on their historical relationship with oil prices. And if oil doesnít correct as much, the silver picture is even brighter.
Now this silver/oil relationship certainly isnít the only reason silver prices should continue their bull market, and it isnít even the most compelling. Yet, it offers one more facet of analysis that confirms silverís dazzlingly bullish fundamentals. The price of silver is undervalued now for a whole host of reasons including its relationship with crude oil. Just as prudent investors used the gold/oil relationship to earn fortunes in the past five years, a similar awesome opportunity exists today in silver.
At Zeal we have been painstakingly researching the best of the worldís silver producers to prepare for this accelerating bull market in silver. We are currently deployed in some of the best elite silver miners that should leverage the gains of silver many times over. Please subscribe to our monthly newsletter today to see our existing silver stocks and mirror our new trades as this silver bull gains strength. Odds are fortunes will be won and you may as well stake a claim.
The bottom line is silver, even though its monetary nature is disputed, does have a strong positive correlation with oil historically, especially in major bull markets. And today oil and silver are once again in such secular bull markets. Oil has advanced far ahead of silver, but the historical relationship between these two commodities strongly suggests silver will close this gap by catapulting ahead sooner or later.
Todayís extremes in the silver and oil relationship are almost certainly not sustainable, and no matter what the oil price does the silver price is likely to advance enormously when the silver/oil ratio inevitably starts mean reverting. Will you be along for this extremely profitable ride?
Adam Hamilton, CPA October 7, 2005 Subscribe |
|||||||
|
|
|
|
|
|
|
|
|
|
|
|
|
|
|
|||


