|
|
|||||||
|
|
|
|
|
|
|
|
|
|
Gold Boiling in Oil Adam Hamilton June 30, 2000 3632 Words
"Everything is soothed by oil … because it smooths every part which is rough." Natural History, Book ii, Sect. 234 Pliny the Elder. 23-79 A. D.
Although our friend Pliny was not pontificating on crude oil, his quote still rings true in a new context almost two millennia after he uttered it. Interestingly, even before Pliny, bitumen, globs of jellified crude oil tar, was among the most valuable commercial products in the world 2,400 years ago. The Nabataeans built a great empire centered in the legendary city of Petra (in modern-day Jordan) financed by collecting bitumen from the Dead Sea area and exporting it to Egypt and the rest of the ancient world. They obtained so much wealth that they instituted a punitive tax on members of society who became POORER!
In the modern industrial economy that has sprung up around the world in the last century, bitumen’s present day commercial equivalent, has, in a very literal sense, become the lifeblood of the global economy. Cheap crude oil has fueled some of the most astonishing advances of the 1900s, including a vastly increased scale of global trade, the birth of heavy industry, rapid and (relatively) painless global transport of people, and that consummate icon of Americana, the automobile. Crude oil, enabling the efficient movement of goods and people, has brought us into an era where distance is rapidly becoming irrelevant.
With every good we consume having a small cost component representing the cost of oil burned in transport, the price of crude oil has far reaching effects on the economy. Any material changes in the price of oil can rapidly cascade through the global economy and markets, creating large ripples capable of altering the price structure of almost every good and service produced. With apologies to Pliny, every economic thing is indeed soothed by cheap oil, because it smooths out costs of global transport and enables true worldwide commerce.
Crude oil has astonished analysts and consumers alike in the last 18 months, rocketing up an incredible 200%. Even folks not interested in studying the markets are seeing the effects of higher crude oil in their pocketbooks, as gas prices continue to rise at the pump and more and more companies tack on fuel surcharges. In addition to heralding inflation, oil has historically had a very high positive correlation with the undisputed king of assets, gold. In this essay, we will explore the historical relationship between gold and crude oil.
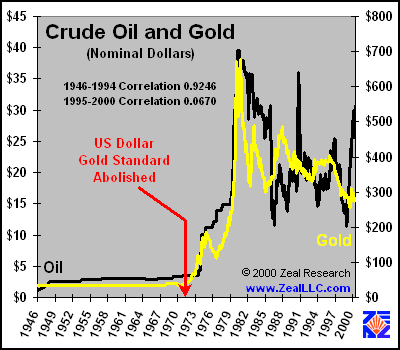
To begin, we will take a look at 55 years of monthly gold and crude oil data in nominal US dollars.
Several themes on this graph stand out dramatically. First, from 1946-1971, gold and oil prices were flatlined. This lack of price volatility in oil was a great asset to the booming post WWII US industrial economy. Oil price volatility greatly complicates strategic industrial planning, and increases risk aversion to new ventures heavily dependent on crude prices. From 1972-2000, however, gold and oil prices look like an electro-cardiogram of a hamster on speed. With Nixon’s fateful decision to sever the critical link between the US dollar and gold in 1971, all semblance of discipline in fiat currency growth was forever vanquished. The wild gyrations on the right side of the graph are the direct result of the lack of prudent restraint of fiat currency growth. The second critical theme to note is the recent divergence of the correlation numbers. From 1946-1994, gold and crude oil had a very high positive correlation of 0.92. The correlation is highly logical, as gold and crude have almost always both performed extremely well in periods of inflation, as they are both REAL assets that always appreciate in fiat currency terms over the long run. From 1995-2000, however, strange things are apparently afoot in the gold and crude relationship. The correlation drops to an unbelievable 0.07! So what the heck happened in 1995 to obliterate a previously rock-solid relationship? The following graph of the S&P500 versus M3 offers some important clues…
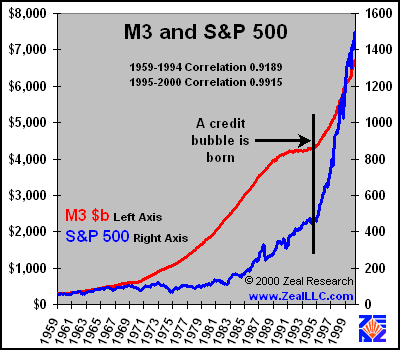
In 1995, for some reason, the US Federal Reserve embarked on an unprecedented binge of M3 growth. Shortly after the famous “Irrational Exuberance in US Equity Markets” speech given by Chairman Greenspan, the Fed chose to open the blowout valves and unleash a deluge of liquidity into the US economy. Like rain from a hurricane, all the new fiat dollars had to go somewhere, and the destination of choice was the already overvalued US equity markets. The phenomenal exponential growth of the S&P 500 following the massive goosing of M3 is very evident in the graph. Money available in an economy and stock market valuations have generally been strongly positively correlated all throughout history, in many different countries. In the US, M3 and the S&P had a 0.92 correlation between 1959 and 1994. That correlation shot up to an incredible 0.99 between 1995 and 2000, as the Fed fiat fire hose was turned on full bore and stuffed down the throat of the US equity markets. Like Dr. Frankenstein’s diabolical creation, a credit bubble was born.
Gold has been the most sensitive barometer imaginable to inflation, throughout all of human history. As the proverbial canary in the fiat coal mine, gold always announces fiat currency problems (inflation, or debasement as it was called in the past) in advance by rising dramatically in value. Many brilliant analysts, including the Gold Anti-Trust Action Committee, have hypothesized that the US government began operations in 1995 to suppress the price of gold. By artificially capping the gold price in US dollars, the world financial community would be blinded to the reckless growth in US money supply and inflation numbers, and be deluded into thinking the US economy was in far better shape than M3 growth alone would suggest. The alleged methodologies used by the government in suppressing the gold market include selling gold derivatives contracts in the open market, persuading other central banks to loan or sell physical gold into the market, and commissioning certain key money center bullion banks to cap fledgling gold rallies. Although a discussion of gold market manipulation since 1995 is beyond the scope of this essay, I strongly encourage everyone to visit www.GATA.org and carefully read the Gold Derivative Banking Crisis document recently presented to every member of the US Congress. This document offers a mountain of evidence on why the historic gold and crude price relationship has all but vanished. Although the canary seems to be dead, history suggests it is simply feigning. Gold is no ordinary canary, and it has easily burst asunder all iron bands with which men have vainly tried to bind it.
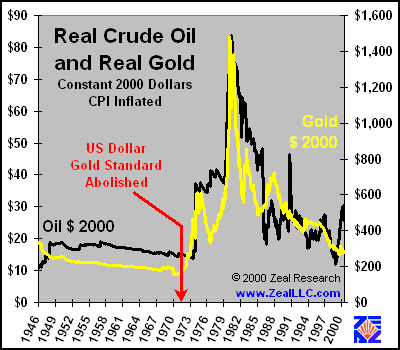
Continuing our gold and crude oil analysis, we will take a look at gold and crude oil in REAL inflation adjusted prices. Constant May 2000 dollars are used, inflated by historical Consumer Price Index growth.
Adjusted for inflation, even $30 oil seems cheap relative to the early 1980s! In terms of today’s dollars, gold was trading at over $1,500 per ounce in the 80s. Prior to 1971, in real terms, even the price of oil was declining, obviously very healthy for the US economy. The consequences of the fateful fiat decision in 1971 are even more apparent when viewed from a real perspective. The last few years of the chart are also most interesting. Generally, over the last 55 years, gold and oil have moved in close sympathy. As the graph shows, however, the recent sharp spike in crude oil prices has not been shadowed by gold. To further explore this anomaly, we will take a look at the historic gold to crude oil ratio.
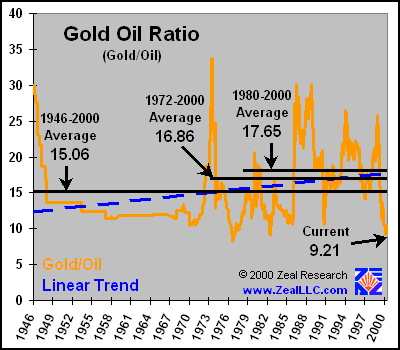
The average gold to crude oil ratio (gold price divided by crude oil price) for several different periods of time is shown in the graph above. For the last 55 years, an ounce of gold has been worth about 15x as much as a barrel of crude oil. (This relationship is exactly the same in nominal AND real dollars.) The dotted blue-line shows the linear trend of the data, indicating a rising of the gold to oil ratio. Over the last twenty years, for instance, the ratio has risen to over 17x. Currently, the ratio is at an unsustainable low of 9. This level has only occurred two other times since 1946. Each time levels below 10 are seen, they proceed a sharp and sustained rally of the ratio back above the historical average. There is no reason to believe the present low will last any longer than historical precedence indicates. There are only two events that can bring this ratio back into line. A sharp rally in gold prices, or a sharp drop in crude prices. Which event is more probable? A mega-rally in the price of gold, or $15 crude oil?
Before we explore that question, which has phenomenal implications to the future performance of almost every investment in the world, including global stock markets, we will take another look at the gold to crude oil relationship from a different perspective… the cost of oil as denominated in gold.
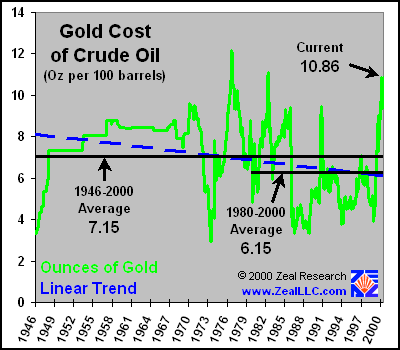
The above graph shows the ounces of gold required to purchase 100 barrels of crude oil. This measurement is particularly important for oil producing nations. Oil, of course, is a wasting asset. Sooner or later, all oil producing countries, including Saudi Arabia and Kuwait, will run out of oil. As an oil selling country, one’s primary motivation is to maximize the return on the sales of the wasting asset. For 6,000 years, the only real store of wealth that has survived every government, currency, and war has been gold. As an oil producer, there is no better trade for the temporary asset of oil than the seemingly eternal asset of gold. Although OPEC loves to be able to buy almost 11 ounces of gold for each 100 barrels of oil they sell, this perspective also shows the current price anomaly. Historically, the average gold cost per 100 barrels has been in the 6 to 7 ounce range. There have only been two other times in modern history when the gold price of oil has exceeded 10 ounces, and each time was an incredibly short-lived spike that soon plummeted well below the historical average. The 55 year equilibrium cost of oil in terms of gold can not sustain such high oil valuations, and gold catapulted northward each time these high relative oil costs were seen in order to bring the gold cost of oil back in line with historical levels. As with the gold to crude ratio discussed above, the current high gold cost of oil will not be an exception to history. Once again, only two events can solve this oil valuation problem. A sharp rally in gold, or a massive drop in crude. The decision between these two contenders could have a massive impact on the future net worth of everyone who holds assets valued in US dollars. In order to determine whether gold up or oil down has the highest probability, some brief technical and fundamental analysis is in order.
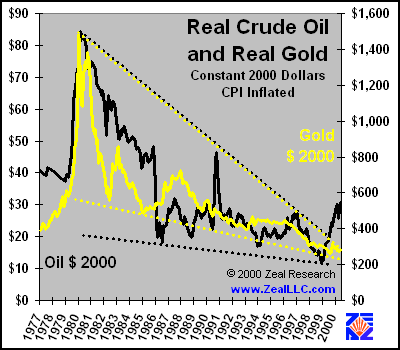
Yet another look at real gold vs. real oil, from 1977 to 2000, from a technical perspective…
The technical 23 year charts of gold and oil are very similar. Both exhibit formations known as descending triangles, a type of horizontal triangle that denotes imminent change as the formation nears its apex. As many technicians have pointed out, a descending triangle is typically a powerfully predictive chart formation. When a commodity or stock enters a horizontal triangle with a strong upward movement, like gold and oil have, the formation is considered bullish. When the triangle is broken, the commodity tends to move sharply upward. Oil is already exhibiting this characteristic, and is having a technically significant breakout. The breakouts from descending horizontal triangles are typically violent, with rapid price movements. Technicians usually expect the breakout to reach a level at least equal to the base of the triangle, an amazing $85 per barrel for oil, in this case! From a technical standpoint, the probability of oil trading below $15 per barrel to bring the gold oil ratio back in line is virtually nil. Gold is the real superstar of the chart. Gold’s 20 year descending horizontal triangle has reached its apex, indicating a large probability of an imminent move. In addition, gold entered the triangle with an extremely strong bull move to a high of over $1,500 per ounce in 2000 dollars. The chart predicts a very high probability of a violent jump in gold to the upside, similar to oil’s recent breakout. The chart also indicates a price target for gold of over $1,500 per ounce, a fantastic gain over today’s depressed levels. From a technical standpoint, the probability of a rise in gold is vastly higher than the probability of a drop in oil. Although the technical picture is bullish for gold, it pales in comparison to the fundamentalist slant. We will leave the charts to the technicians and analyze some fundamentals.
From a fundamental standpoint, the bullish case for gold AND oil is extremely compelling. First, let’s take a brief look at bullish oil fundamentals…
o Global oil demand is growing rapidly, and projected to keep growing dramatically for the next decade. China and India alone, representing over a third of the population of the planet, are industrializing rapidly and will need vast amounts of oil to fuel each of their billion people plus population economies. Americans, which are estimated to consume over a third of world oil produced currently will not give up their gas guzzling land yachts for many years for two reasons. First, families feel more safe and secure driving 6,000lb tanks than 2,000lb tin cans. Second, with the low savings rate and hand to mouth existence of most Americans, few can afford new cars based on hybrid gas/electric or future hydrogen cell technology. There is no global demand relief in sight for many, many years. o Global oil supply in production is stagnant. Low oil prices in recent years, coupled with capital enamored with promiscuously chasing dot com type debacles, has left oil production infrastructure in deteriorating conditions. In addition, existing wells have been pumping for many years, often with artificially increased production levels through techniques such as salt water injection. Artificially stimulated wells tend to rapidly drop off in production when they near the end of their useful lives. Many of the major oil reserves in the western world are nearing the end of their expected lives at present production levels. Although many other large reserves exist which will be tapped, logistical realities and political hoops indicate it will take many years to bring these reserves online. It takes time to drill wells, set up transportation infrastructure, and bring new mega-well facilities to a live state. Political maneuvering, such as the ban in drilling off certain areas of California (wrecks the movie stars’ views, apparently) and the present US administration’s staunch resistance to opening up vast Alaskan reserves makes rapid increases in marketable supply in the western world unlikely. In the east, geopolitical problems limit new marketable supply as well. Vast reserves exist in the landlocked Caspian Sea, but they are surrounded by those paragon nations of peace and stability including Russia, Chechnya, Azerbaijan, Kazakhstan, Turkmenistan, and Iran. For many years western and eastern nations have been arguing over where to lay a pipeline from Baku on the Caspian, but no agreement can be reached. The US wants the pipeline to go through Turkey, which means it would have to go through the warzone in Chechnya. Iran wants it to run through Iran. (Iran has also offered to swap oil, filling western tankers with Persian Gulf oil in exchange for western Caspian Sea oil delivered to northern Iran.) Bottom line, it is a political mess that will not resolve itself overnight just because oil prices are rising. o Many brilliant petroleum analysts believe OPEC is operating at levels over 95% of maximum production. Only Saudi Arabia is thought to have significant capacity left, and even the Saudis have not upgraded oil infrastructure sufficiently due to the increasing cost of their domestic social problems. Lots more oil is NOT coming from OPEC for a long time, regardless of political grandstanding in the west. o God forbid, if another war breaks out in the Middle East, oil is going stratospheric. The region, as always, is rife with tensions. Iraq hates Iran. Kuwait and Saudi Arabia fear both Iran and Iraq. Syria loathes Turkey. Everyone in the region except Turkey would like to drive Israel into the sea and retake Jerusalem and the Dome of the Rock (the third most holy site in Islam). Israel now has nuclear tipped submarine launched cruise missiles to deter ballistic missile strikes from the Arabs. The whole region is a powderkeg, waiting for an inherently unpredictable and errant spark. As an added bonus, Iran is currently heavily fortifying the small island of Abu Musa, which is one of the most important strategic islands on the planet. Whoever controls Abu Musa exercises unilateral hegemony over all the oil in the Persian Gulf, as Abu Musa is the “cork” which bottles up the gulf. If supertankers (the ultimate targets of opportunity in war, as one’s enemies can’t fight without oil) can’t get out of the gulf, crude oil prices will reach heights that are unfathomable today.
From a technical and fundamental standpoint, the future for crude oil is bullish. If the prospects for crude are bright, the near future for gold shines like a supernova. Some brief positive fundamentals for gold…
o Global gold demand is rising rapidly, fueled by everyday people living in the east who have seen firsthand the effects of hyperinflation and despotic governments, and empirically realize gold is the ultimate refuge in financial and political storms. With Southeast Asia recovering from the recent financial crisis, gold demand is booming. As history has taught over and over, the western equity credit bubbles WILL burst at some point, and the consequences will be catastrophic financially. When western investors began chasing gold to salvage some wealth as fiat paper and overvalued stocks burn, global gold demand may jump by an order of magnitude or more. All the gold mined in the history of the world would fit in a space a little larger than a 60 foot cube. When the bubble bursts, there simply isn’t enough gold to go around. o The annual rate of increase in the global mined supply of gold has continued to dwindle. At recent prices of $255 to $290 per ounce, most mines in the world are unprofitable and many are being mothballed. When the inevitable gold rally of legend arrives, it will take many years to spin up capacity to meet demand, for the same reasons discussed above in the oil fundamentals. The bullish supply and demand fundamentals for the gold price in the next few years are phenomenal. o Mountains of evidence continue to accumulate that western central banks have conspired to suppress the price of gold to mask reckless expansion of fiat currencies. Virtually irrefutable evidence also exists that many years of future gold production are already spoken for, because several large money-center banks have borrowed many thousands of tons of gold, which they promptly sold in the open market and used the proceeds to invest in equities. These “naked shorts” will have to buy gold in the open market to pay back their gold loans to bullion banks and central banks. It will probably take a decade or more of heavy buying to repay this borrowed gold, which is incredibly bullish for the metal. Also, as we see today, many governments historically have tried to suppress the price of gold. As King Solomon wisely said, “There is nothing new under the sun.” EVERY gold suppression effort in history has failed, and a large gold rally always ensues upon failure of the manipulation, blasting to a new high gold price level well above the market clearing equilibrium price. Today’s suppression efforts will come to the same fiery end. o As the real charts above show, gold is at 25 year real lows. All investments are cyclical, and gold is the ultimate smart money contrarian play of the first decade of the new millenium. There is not an asset class in the world that is as beaten down as gold.
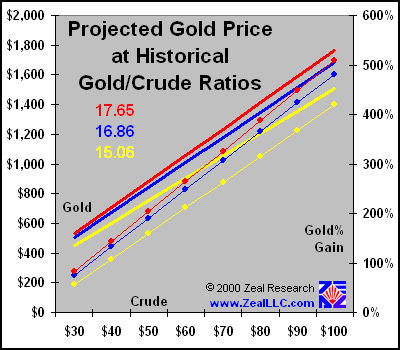
So, very conservatively, completely ignoring all the incredibly positive technical and fundamental factors for gold discussed above, what does the current gold oil relationship indicate the short-term price of gold should rise to?
This graph speaks for itself. The heavy solid lines indicate the projected gold price (left axis) at a given crude oil price per barrel (bottom axis) at the various historical gold/crude relative valuation ratios noted earlier in this essay. The gold percentage gain axis on the right (thin dotted lines) is the percent gain in gold from a market price of US$290/oz. Once again this graph is incredibly conservative, not factoring in any of the amazing fundamentals for gold and oil discussed above.
Great fires of demand are being stoked under the massive cauldron of crude oil as you read this essay. The surface of the oil is beginning to boil. At the bottom of the cauldron gold languishes, at ice-cold temperatures, defying all logic and physics. As the oil begins to boil more and more violently, and the cauldron heats up, this gold boiling in oil will not stay cold for long. It will absorb the relentless heat of the maelstroms of oil price increases and fiat inflation scalding it from all sides. Sometime soon, gold will heat up so much it will explode out of the seething cauldron and into the stratosphere. Are you and your portfolio prepared?
Got gold?
Adam Hamilton, CPA June 30, 2000 |
|||||||
|
|
|
|
|
|
|
|
|
|
|
|
|
|
|
|||

