|
|
|||||||
|
|
|
|
|
|
|
|
|
|
|
|
|
|
|
|
|
|
|
HUI Tests Support Adam Hamilton June 11, 2004 3222 Words
In light of the latest gold-stock weakness earlier this week, once again precious-metals investors and speculators are nervously watching gold and silver and the companies that mine them.
Just as at any apparent inflection point in the financial markets, bullish and bearish theories on the precious-metals markets abound. Some folks believe we are heading lower, others believe we are heading higher, and still others are betting on a new trading range developing.
As usual, compelling arguments exist advocating all three possible outcomes. These competing opinions are very healthy and keep the markets exciting to study and trade. If the vast majority of players were either bullish or bearish, then the probabilities of a major move in the opposite direction contrary to consensus would be high. But when popular sentiment is fractured and fragmented as it is today, the risk of large moves is fairly low. This type of uncertain environment is ideal for technical analysis.
While sharp daily plunges like Wednesday’s 5% drop in the flagship HUI unhedged gold-stock index are certainly psychologically grating for PM bulls, I still find myself firmly entrenched in the bullish camp. Not only do the rock-solid fundamental foundations of this metals bull remain intact, but the technical chart picture is also encouraging as the HUI tests its major support zones.
Of course the fortunes of the HUI are directly tied to those of gold. As goes gold, so goes the HUI. As such, the strong fundamental case for the Ancient Metal of Kings itself directly transfers right through to the ultimate leveraged proxies on the metal, the unhedged gold stocks. If gold is destined to march higher in the months ahead, then so will the HUI. It is gold that drives the HUI, definitely not the other way around!
The bullish fundamental case for gold is well-traveled ground. Most importantly, annual global demand exceeds mined supply, and since new mines take years to bring online this structural deficit is likely to persist for many years into the future yet. And this is certainly not the only part of gold’s bullish outlook.
Real interest rates remain negative, the ideal monetary environment to spawn a gold superbull. Unbridled monetary growth in the First World is also leading to a surge in inflation, relatively more money chasing after relatively fewer goods and services. This is already painfully evident in crude oil along with other key necessities of life.
On top of all this gold continues to shine as pretty much the only relatively safe alternative investment today. The US equity markets remain terribly overvalued by all historical standards and destined for a mean reversion back down through fair value, under 14x earnings. Residential real estate and the bond markets are in serious trouble as soon as the Fed starts raising interest rates in the weeks ahead. Even the mighty US dollar, gold’s arch nemesis, still appears to be topping after an expected major bear-market rally.
But even with gold’s strategic fundamentals remaining extremely favorable, it is often hard to keep them in sight during periods of short-term weakness. On days when gold falls and your own PM stocks are threatening to trigger their stop losses, bearish analysis and opinion seems to drown out everything else.
We all have a natural human tendency to pay more attention to information on a daily basis that tends to explain that particular day’s trading activity. If the HUI is up we look for bullish supporting info to rationalize it, and if it is down we listen to the bears. Being in the newsletter business, I am all too aware of this innate propensity as it has a direct impact on newsletter sales!
Whenever I write an essay advocating a particular market view that I expect to unfold over a few months or a few years into the future, newsletter sales are far more dependent on the markets’ behavior immediately on publishing day as opposed to whether or not I was right over my stated time horizon. So, if gold happens to be up the day this essay is published, we will sell far more newsletters than if gold was down on that particular day. This observation provides a crucial insight into speculator psychology.
Daily market price performance drives popular sentiment, which in turn seeks information that tends to support and explain the most recent daily price movements. The danger in succumbing to this short-sighted behavior is that it can easily lead to a circular reasoning cycle that traps a speculator.
Allowing oneself to be tossed to and fro emotionally based on daily psychology leads to a chronically short-termed focus, poor decisions, and ultimately unbearable psychological stress from being in the markets. And these bad habits render one even more vulnerable to the fickle daily swings in herd psychology which help accelerate a further downward spiral.
How do we overcome this natural tendency to focus too heavily on just the price behavior of the past few days or so alone? First, it is crucial to keep the broad strategic fundamental picture in mind at all times, especially during countertrend moves such as the HUI’s pullback. Second, make sure you always view current daily activity within the context of longer time horizons. This is where technical analysis and charts shine brilliantly.
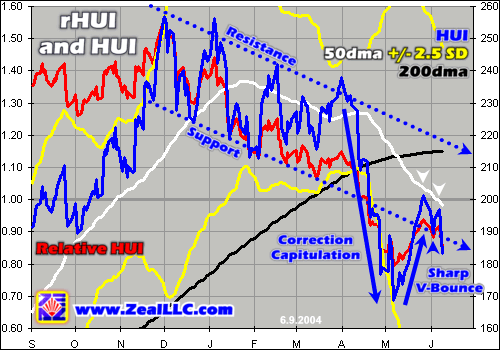
The HUI weakness earlier this week which spawned so much angst in the gold community was not at all fearsome or even impressive within the proper context of multi-month and multi-year price charts. Both short-term and long-term HUI charts are presented below, along with a technical interpretation from both perspectives.
An investor or speculator who always remembers to view daily action within the context of longer-term trends on charts is far less likely to be swept away in the capricious popular day-to-day market psychology. In a very real sense, studying the markets from a technical perspective helps steel oneself from the rapidly shifting sands of prevailing emotions.
Wednesday’s 5% plunge in the HUI is the last day of data on this chart. 5% is a big daily number and sounds ominous, but when viewed within this short-term technical context it does not seem outrageous or threatening at all. We can even add in Tuesday’s 2% drop as well to consider the HUI’s total 7% fall in only two trading days this week. Interestingly though, a careful examination of this chart reveals even larger consecutive daily losing streaks in the recent months.
In December, the HUI fell 9.9% in three days. In January it fell 12.0% over four days. In February it fell 10.3% in four days. We were granted a welcome little breather in March, with no significant daily losing streaks. The real carnage erupted in April though, which witnessed three sharp declines of 9.9% over four days, 8.5% over three days, and 9.5% over two days. There was yet another final HUI plunge in May, 10.7% over three days.
In only six months we have already seen no less than seven consecutive daily losing streaks that were worse than what we witnessed this week in the HUI. So in terms of raw probabilities, the two-day 7% decline in the flagship gold-stock index this week was not at all uncommon and actually rather anemic for a pullback. On this chart you can easily see visually how this latest slide looks much smaller than those of recent months. So while a 7% drop over two days seems ominous when considered in isolation, in the context of the HUI’s chart it is hardly even worth noticing.
Who so much HUI weakness in recent months? It is not because the bull market in gold has ended, as it almost certainly has not based on fundamentals, but because the PM stocks were simply overbought in early December. At the time the HUI was soaring leading to far too positive sentiment. Anytime that the majority of popular opinion within a market community lines up on only one side of a trade, odds are a contrary move is imminent. And that is just what happened in the HUI.
The multi-month correction/consolidation in the HUI since December that is responsible for all these consecutive daily losing streaks was not a surprise. I wrote about the high probability for a coming correction in early December in “Trading the Gold-Stock Bull 3” and again in early January in “The Relative Dollar and Gold”. Gold and the gold stocks had simply run up too far into overbought territory and just needed to correct. No big deal.
Like all countertrend corrections running against a primary trend though, this HUI correction had to end somewhere. I believe it hit that point in early May following a brutal capitulation in April. The HUI entered a sickening waterfall decline as selling intensified and fed on itself. These relentlessly falling prices naturally drove psychology within the gold community terribly negative, deep into fear-laden oversold territory. When everyone wanted to sell after a blistering 29% slide, the seeds of the V-bounce were born.
The HUI’s V-bounce of early May is crystal clear in this graph. It went from massively oversold hugging its lower Bollinger Band to soaring back up to its 50-day moving average before regrouping. The 50dma, as is evident above, tends to act as either support or resistance for gold stocks. Coming up from below in this case, the 50dma was seen as a potential resistance zone by the markets so traders sold the HUI in recent weeks when it was challenging this resistance.
Encouragingly, even this week’s 7% plunge in the HUI really didn’t take it into dangerous territory technically. The HUI ended up just below its short-term linear support line that has held for most of its consolidation/correction since early December. It is not at all uncommon for old support to temporarily turn into short-term resistance and almost magnetically attract prices trying to break back above. We could certainly see the HUI flirt around this old support line a bit more yet before it starts marching higher again.
Thus, technically we have an expected HUI correction that began in December with a consolidation gradually grinding lower. After four consecutive lower interim highs by early April, fear finally kicked in and the consolidation turned into a full-blown correction that ended in a waterfall decline that is a typical of the psychological capitulation marking bottoms. Since early May, the HUI has rebounded sharply before pulling back modestly to retrace, which brings us to this week.
As the capitulation ended in May, the HUI closed at 168.80, which felt pretty darned low at the time. This Wednesday, the last day of data in these charts, the HUI closed at 183.18. This latest interim low is already 8.5% higher than the May V-bounce. And technically what do a series of higher lows mean? An uptrend! This chart looks like the HUI is in the early stages of developing its next major upleg. This is really exciting for gold investors and speculators as the last few major uplegs of this gold bull have been fantastically rewarding!
Even from a short-term technical perspective, this week’s HUI weakness does not look at all frightening and makes perfect sense within context. Whenever any financial instrument that you are tracking or trading makes a large daily move that threatens to unleash your deadly emotions of greed or fear, it is best to immediately grab a chart of at least six months in duration to see where the latest daily swing fits in context.
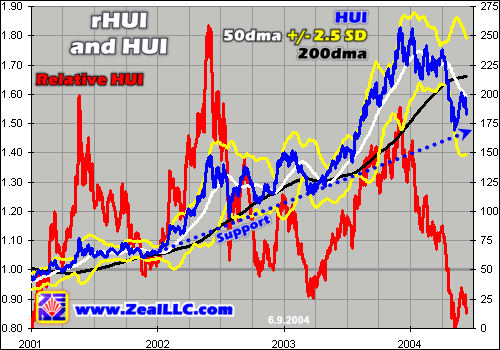
These charts go a long way towards short-circuiting deadly emotions and shifting the emphasis back away from day-to-day action to the multi-month trends that really matter for investors and speculators. And, not surprisingly, the broader the context in which you view a particular day’s trading action, the less important it becomes. This long-term HUI chart remains fantastically bullish even in light of all the correction weakness since December!
Any secular bull market, including this one in the HUI, tends to flow and ebb, usually surging higher with its primary trend but sometimes correcting back down in countertrend moves to eliminate temporarily overbought conditions. In long-term context the past week’s weakness as well as the entire correction since December looks totally healthy, a necessary ebbing back down to major support.
Over its entire bull to date, the HUI has generally surged higher from two primary support lines, its key 200-day moving average, drawn in black above, and its simple linear support, the dotted blue line. Back in early December I figured the HUI would probably correct to its 200dma and bet accordingly. In late 2001, mid and late 2002, and early 2003 the HUI’s 200dma had held pretty solid as major support and marked the bottoms of the periodic corrections in the index.
While I was thankfully proven right on the correction, I underestimated its magnitude. The HUI did correct back down to where its 200dma was in early December at its latest interim top, 165 or so, but since the correction consolidated for so long before plunging the HUI ended up falling far below its 200dma in real-time.
The red line in these graphs, the Relative HUI, quantifies the distance away from its 200dma that the HUI has been traveling in its bull to date. For example an rHUI reading of 1.00 indicates the HUI was trading at its 200dma, while 1.10 shows it 10% higher than its 200dma.
This rHUI line has formed a beautiful series of waves as this bull market unfolded. In each of the last three years, the HUI surged far above its 200dma stretching the rHUI much higher. But following each of these major and hugely profitable uplegs popular sentiment within the gold community was waxing too bullish so a correction was necessary to weed out short-term speculative excesses. The rHUI waves above really do a superb job of quantifying these sentiment waves that gradually push a bull higher.
Unfortunately the 200dma failed to hold as support this time around though so the rHUI just fell to its lowest levels in this bull to date. This spooked a lot of folks, and I certainly wasn’t very happy about it myself in early May. But, provocatively, after rapidly knifing through its 200dma the HUI fell down to its next major logical support level and then bounced. This is the linear blue support line drawn above, the most basic of all technical analysis tools.
As you can see, linear support approaches have marked every major interim bottom in unhedged gold stocks since 2001. Our 2004 bounce along this old support line is extremely encouraging for technical-psychology reasons. Since every technical analyst on the planet with a straight-edge and a HUI graph can easily draw this linear support line, its getting hit again is a huge deal. When the HUI approached its old linear support zone, countless technical buy signals around the world fired which no doubt contributed to its sharp V-bounce last month.
With the HUI still near its linear support, most technical analysts considering this strategic view remain very bullish since the HUI’s primary bull-market uptrend remains intact. And technical analysis ultimately drives trading decisions, either directly or indirectly, for the majority of the world’s investors and speculators. A linear support bounce at the most foundational support line of the entire primary bull in the HUI is probably the ultimate technical buy signal!
This longer-term view also yields a fascinating fractal comparison. Fractals are a mathematical term used to describe geometric structures that have the same basic shape at different scales. The markets really tend to be fractal in nature too, with similar price patterns occurring on charts whether they encompass any range from only a day to several decades. The major gold-stock uplegs of early 2002 and late 2003 look remarkably similar above, very comparable shapes at different scales, like fractals.
Both the 2002 and 2003 HUI uplegs embarked from their linear support, marched relentlessly higher for at least a couple quarters, hit a dazzling new high, consolidated in a moderate downtrend, and then plunged in a final capitulation panic before bouncing off of their major support again. I think the correction stage of our latest gold upleg in early 2004 closely matches the behavior of the correction stage in the middle of 2002. If you compare these two patterns they are remarkably similar.
The 2003 gold upleg ultimately witnessed a massive HUI gain of 124.6% from March to December of last year. The 2002 gold upleg blasted up by 145.4% from November 2001 to June 2002. If May’s capitulation lows really prove to be the bottom of our recent correction, then the HUI sold off by 34.3% from December to May. Back in 2002 that older consolidation/correction/capitulation ultimately dragged the HUI down by 35.7% from early June to late July.
Thus, not only does the pattern of our recent upleg and correction match 2002’s example, but the upleg magnitude is similar and the correction distance from the respective interim highs is virtually exactly the same! The events we have just witnessed in 2004 look remarkably similar to those of mid-2002, which proved to be very bullish after the HUI bounced along its same major linear support line that it just hit again in early May.
These fractal uplegs illustrate the timing of the popular psychology waves flowing under the surface, from bullish to ecstatic to bearish to panic-stricken and back to bullish again. This progression is all part of the natural bull-market cycle. Bull markets flow and ebb, taking two steps forward and then one step back. The charts clearly illustrate this phenomenon.
Coming full circle, the best way to ensure that the inevitable daily sentiment swings don’t seduce you into making emotional trading decisions is to focus on the fundamentals as well as technicals within their short-term and long-term context. On the charts neither the sharp pullback in April nor the down days earlier this week look at all strange or threatening. Actually the V-bounce looks like the birth of a major new upleg in the HUI!
Day to day all kinds of funny things can happen in gold stocks, which tend to closely follow the price of gold. If the US dollar rallies gold is usually hit, and when gold drops so does the HUI. Conversely when the dollar slumps and gold gets a bid, the HUI tends to blast higher as well. While these short-term forces often seem random and frustrating, they never trump fundamentals over the long term.
If you are interested in speculating in precious-metals stocks, by analyzing the markets, stalking opportune moments to trade, and then jumping into specific researched elite gold and silver miners that have phenomenal appreciation potential in this metals bull, please consider subscribing to our acclaimed monthly Zeal Intelligence newsletter today.
In it I discuss current market developments within the crucial overarching strategic context of fundamentals and wider technicals. This broad perspective can help keep you emotionally neutral and ready and able to make excellent trading decisions when great opportunities arise.
The bottom line is the HUI has just been testing its support in the last month or so and the recent weakness is probably nothing to fear. Within the context of the secular bull market in gold stocks their behavior so far this year makes perfect sense and mirrors past major buying opportunities incredibly well.
Adam Hamilton, CPA June 11, 2004 Subscribe |
|||||||
|
|
|
|
|
|
|
|
|
|
|
|
|
|
|
|||