|
|
|||||||
|
|
|
|
|
|
|
|
|
|
GoldTrends 3 Adam Hamilton August 16, 2002 2878 Words
Speculators in the general US equity markets are not the only ones who have been entertained by an uncharacteristically wild summer this year. Gold and especially gold stocks have performed just about every kind of wild gyration imaginable during recent months.
While the volatile summer has certainly been emotionally challenging for all playing the markets, it was really a blessing for speculators. For those who are able to harness and suppress the inherent human greed and fear dwelling within their own hearts, this year has proven to be very profitable across the whole gold arena.
It has been about 4 months now since I hammered out my GoldTrends 2 essay, so this week felt like a good opportunity to take another look at the gold charts. We built some new graphs with current data in order to attempt to once again command the strategic perspective in the sometimes chaotic gold and gold stock action.
As daily volatility hammers investors and speculators alike and challenges worldviews and perceptions, it is incredibly easy to become mired down in the tactical daily market noise. Just as a good military general craves a satellite-level big-picture strategic overview of any unfolding campaign in war, gold speculators and investors can benefit tremendously by stepping back, ignoring the countless tactical day-to-day distractions, and focusing intently on the strategic big picture.
Gold’s strategic fundamental picture is well known. It is believed that around 140,000 metric tonnes of gold have been mined in all of world history. Today about 30,000 of these tonnes are believed to be held by various central banks around the world. Most of the rest is in private hands, either in the form of pure investment gold like coins and bars or worn as jewelry.
Each year all the world’s mines only manage to painstakingly chisel 2,500 tonnes of fresh gold out of the bowels of the earth. This number divided by the total gold supply yields an average annual gold “inflation” rate of about 1.8%, right in line with centuries-old historical averages. As long as fiat currency supplies around the world including the dollar are generally inflating faster than the total global gold supply, each ounce of gold will ultimately grow more valuable in currency terms.
Case in point, mega-inflationist Alan Greenspan has ballooned the US MZM money supply by an absolute 12.9% in the last 12 months. This hugely inflationary environment is fantastic for gold! Relatively more dollars chasing relatively fewer ounces of gold each year yields higher gold prices. Unfortunately, since sycophantic bureaucrats who hate freedom are running central banks all over the world, they too are inflating rapidly and intentionally destroying the savings of their people. Gold thrives in such environments of socialist government-sponsored theft through inflation.
As an added bonus, gold is also running a gaping natural annual supply and demand deficit. Today worldwide gold demand is believed to exceed 4,000 tonnes. Marginal new investment demand for gold, crucial for its price, is almost certain to continue increasing as the brutal supercycle Great Bear market in US equities continues to pour out its wrath upon the markets.
As more and more investors worldwide grow weary of their relentless general equity losses and they witness the magnificent gains the gold investors are reaping, a deluge of fresh capital is almost certain to flood into the very small and lightly-capitalized gold and gold stock markets.
Fundamentally, the gold market looks like an outstanding investment and speculation opportunity in coming years any way you slice it.
Fundamentals are crucial to determining price and trend direction, but fundamental analysis is unable to provide buy and sell signals. Since we know the fundamental strategic environment for gold is quite dazzling, we can use technical analysis to flesh out the current situation for gold and gold stocks. If good fundamentals coincide with positive technical action, the probability of the gold rally continuing is very high.
Obviously, the key to gold and gold stocks performance is the price of gold. The correction in the gold price since early June has definitely tested investors’ and speculators’ mettle. By transcending the daily tactical market noise and looking at the big picture however, it is readily apparent that gold’s strategic uptrend remains intact. Gold still looks gorgeous technically!
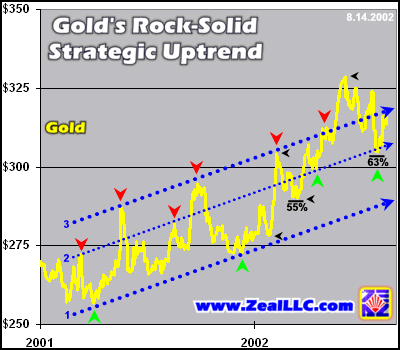
Since gold bottomed under $257 on April 2nd, 2001, its technical uptrend action has been just about perfect. The chart above is a textbook example of the early stages of a bull market, an orderly rise for over a year within a well-defined trading channel.
Trough to peak, the Ancient Metal of Kings managed an impressive 28% gain in only 17 months. Gold is truly in a bull market, as the very definition of a bull market is a 20%+ gain over a year or more of time. Compare this with the S&P 500’s grinding 9% loss over the exact same time frame! Slowly but surely gold is garnering more investor attention and seducing non-traditional gold investors into taking a serious look at the evolving gold bull.
Gold’s correction in recent months, while tactically excruciating for those investors and speculators suffering through it day-by-day, doesn’t look threatening at all on the strategic chart above. Note that gold had rocketed above its strategic trend channel in May, approaching a long-term resistance level around $325-$330. Gold was repelled from those crucial levels and soon fell back into the top-half of its long-term uptrend channel.
While it certainly looked ugly from the myopic perspective of those mired in battle, with the benefit of a God’s-eye view the pullback looks extremely bullish. The two bold dotted-blue lines above mark gold’s long-term strategic uptrend channel, the support on the bottom and resistance on top. In between these two primary channel guides lies a smaller dotted-blue line, labeled “2” above. We call these parallel lines within existing strategic trend channels “midlines.” For an excellent real-world example of how trading a midline proved extremely profitable in the ongoing NASDAQ bust, please see my earlier “Bear Market on Target” essay.
Regarding this gold midline, note that it used to be a resistance level for gold, the yellow metal was repelled upon slamming into it from below. The two red arrowheads pointing down to the midline flag these episodes last year. Extremely encouraging however, twice now in 2002 the midline has actually proven to be bottom support for gold, marked with the two green arrowheads pointing up at the midline in the graph.
One key bit of wisdom in technical analysis states that in bull markets old resistance levels gradually morph into new support levels as the bull run charges ever higher.
In the delicious gold chart above, the midline appears to have changed from a level of topside resistance to gold last year into a bulwark of bullish support for the gold price this year. My partners and I are starting to wonder if the midline will actually turn out to be the new heavy bottom support line for gold’s ongoing strategic uptrend. Only time will tell, but evidence is accumulating in favor of this hypothesis.
A second observation further cements the bullish nature of gold’s recent correction. Another technical analysis general rule is that retracements of 50% to 62% are common in healthy bull markets. The 62% number is derived from simply rounding up the ubiquitous Golden Ratio of 61.8% between numbers in a Fibonacci Series. A healthy pullback in a bull market is expected to be between half and 62% of the preceding rally. Interestingly, this occurred twice already in 2002 in the ongoing gold bull, a good sign.
Note the two black percentages in the graph above. They mark the retracement bottoms of their respective preceding rallies. Gold’s first sharp rally this year, marked with the little black arrowheads, saw a 55% retracement before it continued its long march to the heavens. The second major rally this year, marked with another set of black arrowheads, witnessed a 63% retracement. For all intents and purposes, this was essentially a garden-variety Fibonacci retracement.
The bottom line is the technical strategic picture for gold still looks fabulous. Its long-term strategic uptrend remains rock-solid, old resistance lines are evolving into new support lines, and normal healthy retracements of rallies are the rule of the day. When gold’s outstanding technical situation is overlaid on top of its stellar fundamentals, probabilities are vastly in favor of the gold bull continuing to gallop ahead and gain strength in the future.
From monitoring our incoming e-mail and private consulting activity at Zeal, as well as periodically checking in with popular gold investor hangouts like Gold-Eagle’s world-famous Gold Forum, it was very apparent that gold stock investors were pretty darned nervous during the latest gold pullback. Hopefully this next graph will help calm some fears for the next time a normal healthy gold retracement rolls around.
There are at least two things that every gold stock investor must absolutely, positively remember.
First, the only good reason to ever even consider owning a gold stock is because an investor or speculator is expecting a gold rally. As I explained in my recent “Gold Stock Investing 101” essay, the primary allure of gold stocks is their leverage to the price of gold. The single most important, and really only truly important, variable for general gold stock prices is the activity in the price of gold. When gold runs higher, gold investor sentiment and gold stocks soar. When gold languishes, gold investor sentiment and gold stocks wither.
Second, even though there is a direct and ironclad relationship between gold stock prices and the price of gold, it is strategic, not tactical. Just because gold is up 3% or down 3% in a single day does not mean that gold stocks should necessarily be up or down that same day. Tactical market noise makes gold stock movements on a daily basis much more random than one would think. When trying to draw conclusions and understand meaningful relationships between the gold price and gold stocks, one must analyze a longer period of time. A day or even a month is usually too short.
So yes, gold certainly drives gold stocks, but not necessarily on a minute-by-minute basis. The huge caveat here is not to get mired down in the details of what happens in a single trading session. Who cares what happens in one day? There are very, very few single days in market history that are actually truly important. Transcend the tactical day-to-day market noise and always focus on the strategic big picture!
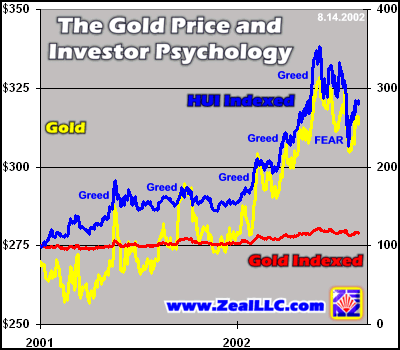
The graph above shows the gold price on the left axis. Compared to it on the right axis are two data series indexed back to the first trading day in 2001. The red line is the price of gold, indexed to 100. The blue line is the AMEX Gold BUGS Index, known by its symbol HUI, also indexed to 100.
Not surprisingly, gold stock investor sentiment, and hence gold stock price levels, are intimately tied to the price of gold over time. Whenever there is a spike in gold, greed takes over and gold stock investors and speculators buy like crazy, ramping the unhedged HUI index. Conversely, when the gold spike or rally takes a breather, gold stock levels fall as fear takes over as the popular emotion du jour.
You can watch the always-entertaining oscillation between the psychological extremes of greed and fear in gold stock investors and speculators by simply monitoring popular web chat sites like the Gold-Eagle Gold Forum periodically. When gold is running higher, the comments are exceedingly positive and folks are talking about how they are going to retire as billionaires in a few weeks and buy their own third-world countries. Conversely, when gold is falling, folks are bickering and lamenting in despair about the endless manipulation of the gold price by various groups.
While the recent retracement of gold was not out of line in percentage terms as we discussed above, in absolute dollar terms it was the biggest gold pullback of this rally yet simply because it started from a much higher level than any previous gold retracements. Similarly, the sell-off in gold stocks was the largest to date in this rally in absolute terms and it spooked the majority of gold investors and speculators.
This kind of action is fully expected in a bull market however. The lessons to be learned, unless you are day trading, are to stay focused on the big picture, not the day-to-day turbulence. Do your own due diligence, buy your own gold stocks, place prudent trailing stop-losses on your positions just in case, ignore the daily noise, and relax and watch the bull unfold. Worst case, if you are stopped-out, you are granted a great opportunity to review the scene and redeploy capital if you arrive at the conclusion that the strategic fundamentals and technicals are still sound.
Don’t sweat the day-to-day tactical distractions, focus on the crucial long-term strategic trends!
One final comment on this second graph. Note the red “Gold Indexed” line above, how flat it is from a strategic perspective on a zeroed axis. A few weeks ago I was talking with a Wall Street Journal reporter out of London who was doing an article on gold bugs. She asked me if I thought gold would go “all the way up to $400 again someday.” I laughed at her. She asked me what was so funny. I told her that $400 was a joke, nothing, that we were holding out for a multi-year strategic gold rally like the 1970s that could ultimately push us through the US$5000 per ounce range. I am sure she thought I was clinically insane after that comment, but nevertheless we had a fun chat!
Keep the flat zeroed-gold line above in mind and check out a comparison graph between the 1970s and today, like the final graph of my “Gold Defies Naysayers” essay. Believe it or not, a similar strategic long-term gold rally today climaxing in another gold bubble would take gold to $5000+ if the rally was similar in percentage magnitude to the 1970s episode! Gold went from roughly $35 in the early 1970s to an $850 single-day bubble in early 1980, an enormous 24x gain.
If gold’s ultimate low this time around proves to be in the $255 range as the charts are suggesting now, a similar 24x increase in the price of the Ancient Metal of Kings would yield an astounding gold bubble blow-off single-day top of over $6000 per ounce. Will it really happen? Who knows, but markets work in cycles and historical precedent suggests we certainly could be blessed with a massive gold rally again.
The strategic perspective must always be maintained by investors and speculators! What we have witnessed thus far in gold and gold stocks, although exciting and already very profitable, is nothing compared to what a real historical gold bull market can look like when the dust finally settles. A 28% rally in gold, what we have seen thus far, is simply a nice beginning, nothing to write home about yet!
Finally, I would like to close with a brief technical look at the unhedged HUI gold stock index.
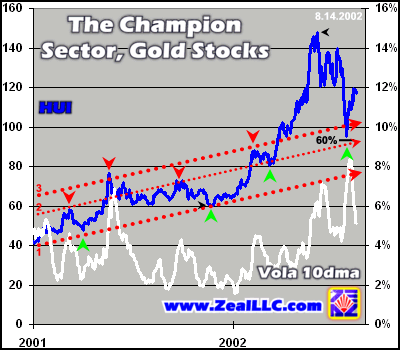
Interestingly and not much of a surprise, the gold stock technicals look much like gold itself, just exaggerated a bit to reflect the extraordinary leverage to the price of gold that quality unhedged gold mines enjoy.
The HUI index is in a definite strategic uptrend. It broke out way above its trend channel this year, and has since retraced 60% of its major rally, a normal and totally healthy occurrence in a primary bull market. Its midline, just as with gold, has evolved from hammering gold stocks as an overhead resistance level to buttressing gold stocks from below as a strong support level. Just like gold, the unhedged gold stocks look beautiful technically and there is no reason to believe our latest retracement was anything more than that, just a bullish correction.
For you volatility buffs also speculating in the ongoing bear market in general US equities, we threw in a short 10-day intraday volatility moving average as well. Unfortunately there is no VIX equivalent in the gold stock world, so the HUI vola MAs will have to suffice. It is interesting to note that the recent HUI correction, while sharp, didn’t catapult volatility up to the types of extremes we would expect to see if it was rolling over into bear market mode.
The HUI unhedged gold stock index, even after its correction, is still up a glorious 79.7% year-to-date in 2002! The S&P 500 plunged by 20.1% over the same period, destroying over a trillion dollars of scarce capital and shattering countless dreams. Even though CNBC and Wall Street are doing their best to totally ignore the stellar performance of the champion gold stock sector, the information will get out. You just can’t hide extraordinary performance for long, especially in a horrible supercycle bear market!
Gold’s fundamentals and technicals are outstanding. Gold and gold stocks are absolutely in bull markets per the textbook definition. Nothing in the charts suggests the trends are about to change for the worse. On the contrary, they continue to look better with each passing month!
The GoldTrends remain impressively bullish!
Adam Hamilton, CPA August 16, 2002 Subscribe |
|||||||
|
|
|
|
|
|
|
|
|
|
|
|
|
|
|
|||


