|
|
|||||||
|
|
|
|
|
|
|
|
|
|
|
|
|
|
|
|
|
|
|
GoldTrends 2 Adam Hamilton April 12, 2002 3719 Words
As far as televisions are concerned, I think the citizens of the first world can be divided into two classes of people.
The first class, the largest by far, simply loves TV and can’t spend more than a day or two in its absence without experiencing massive withdrawal symptoms. The second class, vastly smaller in number, views televisions as the opiate of the masses, gradually dumbing down the populaces until they are utterly incapable of thinking for themselves.
I am proud to be a card-carrying member of the second class. My favorite use for televisions is target practice at the shooting range. As such, I watch very little television on a regular basis outside of my sorry addiction to the doomed series “The X-Files”, which thankfully ends in about six weeks. I do keep a television in my office tuned to CNBC during trading hours, muted of course, so I can glance up and see the real-time tickers and breaking business news, but even the mere idea of sitting down everyday and actually focusing my attention on watching TV turns my brain into mush.
This week, however, I was very pleasantly surprised to catch the second two-hour installment of the six-hour series on PBS called “Commanding Heights: The Battle for the World Economy”. It is an incredibly well-produced documentary on the real-world struggle between central-planning socialist economic doctrines and free-market capitalist philosophies.
This second installment, to which my father graciously alerted me, was called “The Agony of Reform” and documented the tremendous failure of government-controlled centrally-planned economies in the 1980s. I sat entranced for two hours of gloriously commercial-free public television and eagerly soaked up the spectacular documentary. And now I sure know what I am doing next Wednesday night, when part three airs! If you can tolerate two whole hours of TV next week, you should consider catching it too.
Watching how the horribly-flawed and morally-repugnant doctrines of socialism imploded in the real world under their own bloated weight in the 1980s was exceedingly interesting. (A Communist is simply a Socialist with a gun in a hurry!) As I digested the excellent documentary and pondered it afterwards, I couldn’t help but think of the marvelous metal of gold.
In a true free-market environment, the bane of the existence of freedom-hating socialists everywhere, gold forms the foundational monetary cornerstone of the economy and it helps prevent governments from engaging in giant tax-and-spend schemes, socialism in a nutshell. Socialists seek to brazenly steal the fruits of the labors of the productive, take a sizeable cut for themselves like parasites, and then give the remainder to the unproductive in order to subsidize their dysfunctional unproductive behavior to foster political dependency. The whole twisted idea is the worst kind of demented lunacy, and gold can deliver it a fatal blow.
Gold is the mortal enemy of all who want to control the free markets and bend them to their own dark wills, whether they were Communist central planners in the old Soviet Union or today’s Alan Greenspan and his secretive politburo of private bankers in the US shamelessly centrally planning short-term American interest rates.
Gold, if a nation respects it and bases its currency on the Ancient Metal of Kings, kills socialism and socialist interventions in free markets dead. If a government can’t print fiat paper money and is forced to use a solid gold-backed currency, it can’t spend more than it earns, annihilating socialism as its nefarious roots are choked off. It is a beautiful thing!
The longer that I study market and economic history, the more I believe that true freedom can only thrive and grow in an economy with an honest gold or hard-asset based currency. The wonderful documentary on PBS brilliantly showed how unimaginably mighty grass-roots entrepreneurial forces are unleashed if a government simply leaves its citizens alone and makes sure their money is sound and is not highly inflationary. On the contrary side of the coin, as soon as a socialist government controls a nation’s printing presses and magically declares that formerly worthless paper is suddenly “money”, just because they say so, watch out.
Anyway, as I marveled at the brilliant second installment of “Commanding Heights” on Wednesday night, which was not even about gold at all but the mortal struggle between free markets and socialism, I decided to write on the current trends of gold and gold stocks this week.
This essay is the spiritual progeny of “GoldTrends”, an essay I wrote last July on the same topic. We envision the GoldTrend series, which will have future installments periodically as the Great Commodities Bull of the 00’s continues to unfold, as a strategic overview of the current technical situation in gold and gold stocks.
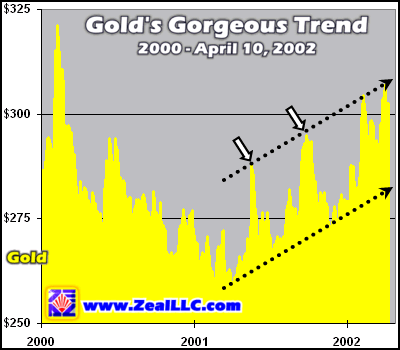
Today the primary strategic “GoldTrend” continues to be breathtaking, a picture-perfect textbook representation of the early stages of what is probably the long-awaited new bull market in gold.
Is this a beautiful chart formation or what?
In early 2001, gold’s strategic downtrend stealthily morphed into a strategic uptrend so quietly that few investors even noticed it. We are now over a year into this new uptrend and it is still gaining steam. It is super-exciting for investors as it is the first major strategic uptrend in gold in over six years, since 1996! As I continue to watch this chart slowly evolve on a daily basis, it is even gradually replacing our notorious NASDAQ 1929 graph as my new personal favorite chart.
Gold’s gorgeous new uptrend, having just celebrated its first birthday on April 2nd, is technically rock-solid. As the chart illustrates, gold has cleanly bounced between its trend pipe’s bottom support and top resistance lines several times now. This kind of consistency and longevity is a dream for technical analysts who happen to be bullish on the wondrous metal of gold.
Technical analysis alone, basically attempting to divine the scattered chicken entrails on price charts, is of questionable value when viewed as an end in itself in complete isolation from the rest of the world. We have witnessed this truth in spades recently as stock technicians continue to be mercilessly slaughtered in droves by the NASDAQ bust, their blood running red and staining the trading floors. But, when prudent technical analysis is used to enhance sound fundamental analysis, a very powerful and compelling analytical force is unleashed.
This gold chart is beautiful not simply because it is technically appealing, but because it is occurring in gold which happens to have stellar bullish fundamentals. As far more gold is being demanded around the world each year than is being chiseled out of the bowels of the earth, the crucial supply and demand fundamentals for gold are awesome. In addition to its fantastic economic supply and demand fundamentals, gold is still overwhelmingly trapped in the hellish investor-psychology realm of black fear.
As contrarian investors, we are richly rewarded with the most fun and profits by investing in arenas that 95% of today’s investors wouldn’t touch with a ten-foot pole at the moment. Gold languishes in these psychological nether realms, still much maligned and almost universally loathed by investors, even though more and more gold investors are starting to marvel at the same strategic gold uptrend that we are. All great bull markets in history start this way, with a tentative subtle yet solid uptrend in an environment with massive adverse psychological headwinds quenching already parched general investor enthusiasm.
In addition to glowing strategic accolades, gold’s current tactical trading situation is also exceedingly interesting, as the chart shows.
Note that after each of the two previous times when gold slammed into its top resistance line in the past year, marked by the white arrows above, that it quickly collapsed back down all the way through its entire trend pipe, approaching its bottom support line. Much of gold’s recent uptrending price action occurred in the bottom half of its trend pipe.
Recently, however, gold has curiously broken this past mold and has been trading exclusively in the top half of its strategic uptrend pipe. Gold has bounced off its top resistance line not once but twice in 2002 already, and so far neither time has been followed by a precipitous plunge to gold’s bottom support line as we witnessed twice in 2001. This provocative change of tactical trend behavior for gold is very encouraging and potentially quite bullish.
In 2001, both significant gold spikes to resistance were very sharp and short-lived, on temporary potentially gold-positive news developments. The first big 2001 gold spike occurred after the GATA African Gold Summit in May and the second following the September 11th fiery veto of imperial Washington’s hyper-interventionist foreign policy. Both gold spikes almost immediately faded after touching the top trend line, however, as the chart above clearly shows.
In 2002, both significant gold spikes (or the single Janus-headed big one, depending on how you prefer to slice up your chart stalagmites) so far have not rapidly crashed back down to the floor of gold’s uptrend pipe. This great new tactical behavior by gold provides some initial evidence that something potentially big has changed in the gold markets, that there is steady gold investment buying on no news rather than occasional fleeting spikes on headline events or rumors.
My partners and I are encouraged to witness this provocative new tactical behavior by the gold price thus far in 2002. While it is too early to know for sure, if definitely feels like something is up. I still suspect that the most likely candidate for the apparent large surge in gold investment demand is Japan, as I elaborated about in an essay a couple months ago called “The New Japanese Gold Rush”. Although none of us have traveled to Tokyo recently to investigate with our own eyes, we continue to see stories all over the international financial media about big surges in Japanese gold investment demand.
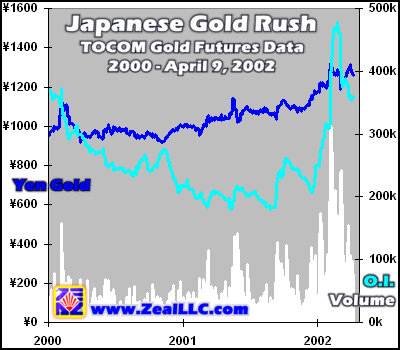
In order to attempt to find some hard data to test the Japanese gold hypothesis for explaining the recent change in gold’s tactical price behavior, we did grab the latest official Tokyo Commodity Exchange (TOCOM) gold futures trading data and updated a graph from February’s “The New Japanese Gold Rush” essay. The results were interesting.
As private Japanese investors choose to buy gold, they have to buy from retail shops which in turn buy the physical gold bullion from wholesalers. Many of the Japanese gold wholesalers use TOCOM gold futures to buy gold to fulfill their own demand. As such, eventually grassroots Japanese investment demand for gold should filter into TOCOM gold data in the form of rising futures prices, higher trading volume, and higher open interest. Has it yet?
The left axis below represents the price of gold for Japanese investors in yen per gram. The yen gold price is graphed in dark blue. The right axis outlines the TOCOM gold futures daily trading activity. The light blue line is open interest, or the total number of gold futures contracts outstanding for all maturities at TOCOM. The white columns represent daily TOCOM gold futures trading volume for all maturities. Unlike the 100-ounce COMEX gold futures contracts traded in the States, in Japan TOCOM’s gold futures contracts each represent a kilogram of gold, about 32 ounces.
Although the yen gold price has stabilized at higher levels around Y1275 per gram since the recent enormous surge in TOCOM gold trading volume and open interest in February, the frenzied gold futures trading volume has dropped significantly. The massive white volume spike above has crumbled down to below 100k contracts traded per day, far below the peak of 341k reached on February 7th. Still, since March 1st the average daily trading volume has been 99k contracts, far above the average daily gold trading since 2000 of 44k contracts.
Even though trading volume has been slowing since February, we are amazed at the continuing strength in TOCOM gold futures open interest (OI), the number of outstanding gold contracts of all maturities. While open interest did back off a bit to below 400k contracts after the February buying frenzy, it is still running 359k contracts, quite high in the context of the last couple years. Since March 1st OI has averaged 386k contracts, an incredible 51% higher than the average OI since 2000 of 256k. Current gold futures TOCOM OI, on no significant gold news, is remaining stable at levels approaching even the huge surge of gold flight-capital activity surrounding the tremendous uncertainty of the millennial date changeover of Y2k.
With continuing strong open interest in gold futures in Tokyo, the new Japanese love affair with gold certainly appears to be more than just a fleeting infatuation and could be the very bleeding edge of further increasing gold investment demand in the Land of the Rising Sun. If this hypothesis proves correct, it is very bullish for future global gold prices.
When this hard TOCOM data is viewed in the light of proliferating anecdotal reports of surging private Japanese gold investment demand and continuing justifiable fears over the solvency of Japan’s entire decaying banking system, we can make a pretty solid assumption that the Japanese are not yet finished buying gold. I still believe that there is a significant probability that the primary reason that gold continues to hover around $300 on the global markets is because Japan continues to eagerly soak up all the excess gold which the Western central banks are willing to generously dump at such historically low gold prices. Interesting times!
In summary, gold’s strategic uptrend is absolutely gorgeous and a beautiful sight to behold shortly after its first birthday. Gold remains near the top of its trend channel around $300, probably at least partially because the average Japanese investor has started to rediscover the timeless virtues of gold.
The gaping maw of gold’s strategic trend pipe is roughly defined between $280 and $310 at the moment, as is readily apparent in the first graph above. If gold falls back to the bottom of its trend to $280 in the coming weeks, have no fear. Gold trading anywhere within its glorious new uptrend, high or low, is a beautiful sight to behold and a bounce to and journey around support is no reason to fret. $280 gold is just fine within this current trend context. If gold falls under trend and trades well below $280 for a few weeks, however, then is the time to carefully rethink gold’s price activity. For now, no worries!
Conversely, don’t be concerned if gold doesn’t explode up to $325 instantly. Long and methodical bull markets unfolding over many years and then climaxing in a spectacular bubble over a few months are the most rewarding for long-term investors. Careful, plodding, relentless uptrend activity in gold is vastly healthier than highly-disruptive limit-up daily $75 gold spikes in a short-covering frenzy that collapses soon afterwards. A quiet but perpetually advancing gold market provides the greatest opportunities for long-term gains as it eliminates extreme volatility that can whipsaw investors out of their positions and cause great angst.
With my thoughts on the strategic and tactical GoldTrends in the bag for this installment, I would like to briefly discuss another graph that we created this week. Typically, we produce several times as many graphs each week as actually appear in these essays, so sometimes it is hard to decide which ones to include for commentary. As most gold investors choose to partially play the new gold bull market via gold stocks as a leveraged proxy on the gold price, I thought it was appropriate to throw in this new gold stock graph as well.
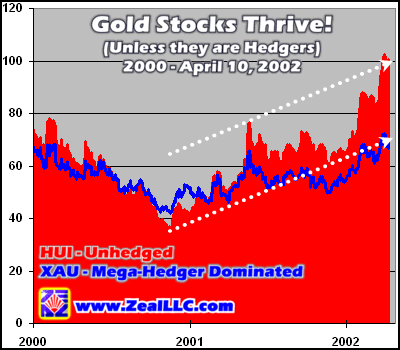
It is simply a comparison graph of the underdog American Stock Exchange Gold BUGS (Basket of Unhedged Gold Stocks) Index (symbol HUI) versus the far more popular Philadelphia Stock Exchange Gold and Silver Index (symbol XAU) since 2000. I find this graph so interesting because it really drives home the crucial gold investing point of the massive relative performance delta between unhedged gold stocks fully exposed to the new gold rally and hedged gold stocks which have sold away their shareholders’ upside exposure to the gold price to bullion bankers.
The HUI, unhedged gold stocks, is graphed in the red columns and the white trend lines apply to it. The XAU, crippled by a vast overweighting in mega-hedgers, is shown by the blue line.
Trough to peak, the popular XAU is up an impressive 72.8% from its low of 41.85 on November 17, 2000. Not a bad return if you can find it eh? Especially in a brutal supercycle post-bubble-bust bear market in general stocks that is just starting to finally show some real teeth. For a chilling comparison the perpetually-adored NASDAQ has returned -41.6% (yes, that’s a loss) since the same day of November 17, 2000. The mindless multitudes of unthinking drone zombie tech investors can take that to the bank!
While the XAU results look compelling at first glance, they are utterly annihilated by the vastly superior performance of the HUI!
The HUI, which reached its dark bottom of 35.99 on November 14, 2000 just days before the XAU, has rocketed up by a spectacular 184.5% in 17 months! I don’t care where you usually invest, this is a staggeringly stellar return for any investor!
The XAU and its less well known cousin the HUI are both gold stock indices, but the HUI has returned 111.7% more than the XAU over the exact same time frame with an identical backdrop of the early days of the new strategic uptrend in gold. Stated another way, XAU investors had an enormous opportunity cost of more than half of their potential returns simply because they chose the XAU over the HUI. What gives?
The only real fundamental difference between the two indices is that the XAU is dominated by mega-hedger gold companies and the HUI only accepts unhedged gold stocks fully exposed to the gold price. The performance of the XAU over the last 17 months has been relentlessly dragged down by the huge gold hedgers Barrick Gold (ABX) and AngloGold (AU) acting like unwelcome sea anchors. These mega-hedgers currently constitute 38% of the total weight of the XAU and had even more influence last year before the newly created super Newmont (NEM, a non-hedger) reached its full girth early this year after digesting Australia’s Normandy Mining and Canada’s Franco Nevada.
Gold hedging companies cut deals with private bankers that lock in future gold prices they will receive for their gold. If gold rallies significantly, the mega-hedgers’ shareholders lose huge amounts of profits in opportunity costs as the hedgers are contractually obligated to sell gold for a lower price than where it is trading in the spot markets. Mega-hedging companies, which I define as having sold forward more than one year’s worth of future gold production, have sold most of their upside profits in future gold rallies to third parties, effectively nefariously looting their shareholders of the gains properly due them from a rising gold price.
Savvy investors fully understand this Faustian deal with the devil that the mega-hedgers have inked with their shareholders’ own blood so they avoid these companies like the plague and instead reward nonhedgers with their scarce capital. The price activity in both the mega-hedged and unhedged gold realms tells the whole story.
For instance, the most notorious of the mega-hedgers, Barrick Gold (ABX), is up 33.7% since November 15, 2000, which does not look too bad on the surface in the midst of a miserable equity bear market. Gold Fields (GOLD) on the other hand, a world-class unhedged gold mining company of similar annual gold production to Barrick, has rocketed up by 289.3% over the same period!
Hmmmm… 34% or 289%? Decisions decisions! Now one certainly doesn’t have to be Warren Buffet to decide whether investing in mega-hedger gold companies or unhedged gold companies is the superior capital deployment decision in a rising gold price environment! The monstrous “hedging penalty” that shows up in the flaccid stock prices of the mega-hedgers is incredibly torturous and punishing for gold investors foolish enough to invest in these companies directly or indirectly.
If you are investing in gold stocks because you expect a gold rally, buying mega-hedgers, either directly or through a mutual fund, is just like shooting yourself in the foot. I still can’t even begin to fathom why any investor on earth who is bullish on gold would place his or her scarce capital at risk in mega-hedgers who have sold away their shareholders’ upside profits to future gold rallies. It makes no sense at all.
I also have no idea why supposedly savvy mutual fund managers stake large positions in these mega-hedgers when huge and highly-liquid quality unhedged alternatives like Newmont (NEM) and Gold Fields (GOLD) are available for investment. Don’t they do any research? Prudent diversification across continents and companies in the gold sector can be easily achieved by investing in world-class unhedged gold companies and avoiding the mega-hedger dogs entirely. If you own gold mutual funds and they have a material position (>5% stake) in a mega-hedger, you ought to consider moving your capital elsewhere to a better-managed gold fund.
Gold mega-hedgers are only a quasi-logical investment if you think the gold price is going way lower, but then they are still a quite goofy investment in a very real sense because, if you believe gold is headed lower, why invest in gold-related stocks at all? If an investor is bearish on gold, it is best to avoid the sector altogether, not buy the hedgers who do better in a gold bear market!
The bottom line?
Gold is in a simply gorgeous strategic uptrend that is already a year old and shows no signs of running out of steam yet, partially no doubt thanks to private Japanese investors. Gold’s beautiful uptrend is a picture-perfect start to what will probably prove to be a magnificent multi-year bull market in the long-languishing Ancient Metal of Kings.
If you are a fellow gold bull and think the gold price is heading higher, and your preferred way to speculate on this probability is to buy gold stocks, avoid the mega-hedgers like the Black Death. The legendary gains in the coming gold rallies will only be achieved in unhedged quality gold stocks fully exposed to the gold price.
Adam Hamilton, CPA April 12, 2002 Subscribe |
|||||||
|
|
|
|
|
|
|
|
|
|
|
|
|
|
|
|||