|
|
|||||||
|
|
|
|
|
|
|
|
|
|
|
|
|
|
|
|
|
|
|
SPX Topping Valuations 2 Adam Hamilton November 15, 2013 2909 Words
2013’s incredible stock-market melt-up persisted this week, with the flagship American stock indexes surging to fresh record highs. The euphoric bulls continue to claim today’s lofty stock prices are justified by reasonable valuations. But nothing could be farther from the truth. Stocks are actually very expensive these days, with high valuations seen at major bull-market toppings. This makes for super-risky markets.
Successful investing demands buying low then selling high, so the price paid for any stock is absolutely critical to its ultimate return. Paying too much, buying even a great company’s stock when it is too expensive, virtually assures poor future gains at best. And overpaying when a bull market happens to be topping will lead to severe losses, as subsequent bears cut in half even the mightiest blue-chip stocks.
So valuations, how much any stock costs in relative terms, are truly investors’ best friends. They reveal when stocks are unloved and undervalued, the ideal time to buy low. And later on they warn when stocks become adored and overvalued, the best time to sell high and realize gains. The premier valuation metric is the price-to-earnings ratio, any company’s stock price divided by its annual earnings per share.
While average P/E ratios vary considerably among sectors, the broader stock markets have an average as well. For centuries it has been fourteen times earnings, for very good reason. As I’ve explained in depth in past essays, 14x is a natural and fair level for people who save excess capital (investors) and people who need capital (companies) to come together. It is a mutually-beneficial price level for scarce capital.
Thus stock markets around the world have always oscillated around their fair value of 14x earnings in great cycles. Sometimes investors get scared and flee from stocks, battering down their prices to much lower valuations. Other times investors get greedy and pile into stocks, bidding up their prices to much higher valuations. But ultimately general-stock-market valuations always mean revert to 14x in the end.
I call the great cycles created by this dynamic Long Valuation Waves. Absolutely essential for investors to understand, each wave lasts a third of a century. Their first half is a secular bull where valuations expand (P/E ratios rise) as investor demand drives stock prices higher far faster than their underlying companies’ earnings growth. This strong buying pressure and greed can eventually double valuations to above 28x.
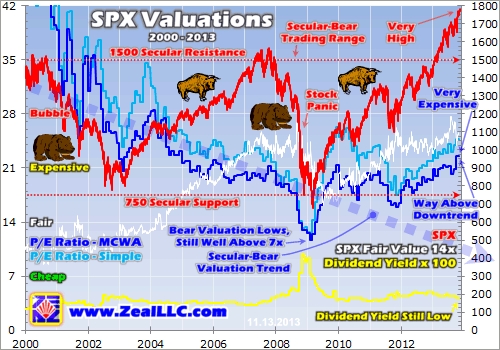
The second half of each Long Valuation Wave is the resulting secular bear, where the preceding bull’s lofty stock prices drift sideways long enough for underlying corporate earnings to catch up. This process ultimately forces general-stock valuations down to 7x earnings, half fair value. And today we remain mired deep in the secular-bear half of these valuation cycles, which began way back in March 2000.
That’s right, despite all the euphoria, greed, and hubris this year’s extraordinary stock-market levitation has spawned, we’re still in a secular bear today. Even at this week’s exciting new nominal record high in the flagship S&P 500 stock index (SPX), it is only up 16.7% in the 13.7 years since March 2000! This is a pathetic compound annual return over that span of about 1.1%. The stock markets have merely ground sideways.
The gigantic secular-bear trading range the SPX has carved over the past 14 years is readily apparent in this first chart. The vast majority of the time during that span saw this index meander between 750 support on the low side and 1500 resistance on the high side. Within this secular bear has been an alternating series of cyclical bears and bulls. The former slash stock prices in half, while the latter double them again.
At best since the end of the last secular bull in March 2000, the SPX has merely gained 1% a year as of this week’s lofty levels. And despite all the hype over 2013’s long string of record highs, they are merely nominal. When adjusted for inflation, the SPX’s March 2000 peak was over 2100 in today’s dollars. The fact that the stock markets have been stuck in a miserable secular bear for the last 14 years is unassailable.
And secular bears exist for one purpose, to drive down lofty valuations from the preceding secular bulls. During secular bears, valuations gradually drift from bubble levels near twice fair value (28x earnings) down to cheap levels near half fair value (7x). These third-of-a-century valuation waves happen over and over again in the stock markets. And the valuation downtrend in the broad-market SPX long reflected this.
Between early 2000 and late 2011, the average P/E ratio of the elite S&P 500 component stocks gradually trended lower on balance. You can see this in two conservative measures of price-to-earnings ratios rendered above in blue, which followed the large dotted-blue downtrend line. Sometimes valuations were higher, sometimes lower, but they drifted lower on balance as the stock prices ground sideways on balance.
Valuations migrated lower because underlying corporate earnings were gradually growing with the US economy while stock prices didn’t advance. With the E rising and P constant, P/E ratios contracted. This is exactly what happens in all secular bears. But in early 2012, this normal valuation downtrend started to diverge. The stock markets started powering higher far faster than profits could grow, driving up valuations.
I used two conservative broad-market P/E methodologies in this chart. The light-blue line is the plain simple average of the trailing-twelve-month P/E ratios of all 500 SPX component companies. The dark-blue line weights each company’s trailing-twelve-month P/E ratio by that company’s market capitalization, which I have long believed yields a more accurate and conservative portrayal of prevailing broad-market valuations.
Market-capitalization weighted-average P/E ratios better reflect actual valuations in the large companies where investors have the most capital at risk. For example, today Netflix trades at an insane 286.6x earnings while Apple trades at a slightly-cheap 13.3x. A simple average P/E of these companies is 150x earnings. Yet Apple is far more important to investors, with a $475b market cap compared to Netflix’s $20b.
If you weight an index of these two SPX components by their market caps, you get a far more realistic representation of their collective P/E of 24.3x. So MCWA P/E ratios offer a superior picture of what is really going on relative to capital at risk. In our valuation work, we go farther and cap all outlying P/E ratios no matter how large at 100x to minimize their impact. So our MCWA P/E data understates true valuations.
But even by this metric, valuations are very expensive today. As of the end of October, the MCWA P/E ratio of the 500 SPX component stocks was a whopping 22.6x earnings! This is well above the 21x level that has proven expensive for centuries, way above the long-term 14x fair-value level, and radically higher than the undervalued 7x level that ends secular bears. Stocks are actually very expensive today!
Valuations are even higher now than they were in late 2007 when this secular bear’s last cyclical bull was topping. And after that 5-year run doubled the SPX, it was more than cut in half in the subsequent cyclical bear. Buying stocks at expensive levels near or above 21x earnings seldom leads to significant gains. The great majority of the time it guarantees poor future returns or even big losses in the next bear.
Secular bears run for the second halves of Long Valuation Wave, about 17 years. For the first dozen years of today’s secular bear, valuations indeed gradually migrated lower as the big downtrend line above shows. If valuations remained on that track today, they would be around 11x earnings on their way down to 7x when this secular bear finally ends. That would put the SPX at around half today’s lofty levels!
But obviously valuations have diverged way above their normal secular-bear downtrend in the past couple years. The Federal Reserve has fueled a massive levitation in the US stock markets. Its long-running zero-interest-rate policy has made many other asset classes far less attractive, forcing capital into the stock markets. And its quantitative-easing debt monetizations have also injected vast new inflationary money.
So in the past couple years, stock prices have been bid higher far faster than corporate earnings could grow, ballooning valuations again. Contrarians like me argue that nothing can short circuit a secular bear, not even central-bank manipulations. So before this bear ends somewhere near 2017, stock prices are going to have to head sharply lower to drag valuations back down to the usual 7x bear-killing levels.
If you study the century-plus history of American stock-market valuations, spans of a couple years deep within secular bears where valuations enjoy a countertrend expansion are not uncommon. Cyclical bulls within secular bears can grow very large. But eventually they inevitably fail, greed grows too extreme and soon all available buyers are sucked in. Today’s cyclical bull is way overdue to roll over into a new cyclical bear.
But obviously Wall Street strongly disagrees with this contrarian perspective as always. It believes a new secular bull is underway and thus the stock markets are heading much higher in the coming years. If you listen to CNBC for a few hours these days, you will hear dozens of rationalizations about why stocks are cheap today and it’s a great time to buy. But this bullish mainstream perspective is actually deeply flawed.
If we’re indeed in a new secular bull as the bulls claim, it had to start in March 2009 after the last cyclical bear ended. But that would mean the secular bear that began in March 2000 only lasted 9 years, just a little over half secular bears’ tight average duration of 17 years. There is no precedent whatsoever in American stock-market history for secular bears ending so soon. In addition, valuations in early 2009 were way too high.
Rather than hitting 7x after that brutal once-in-a-century stock panic in late 2008, the lowest the SPX’s P/E ratio fell in early 2009 was 11.6x earnings. That was still very expensive for bear-slaying levels, with valuations still a whopping 2/3rds higher than their 7x secular-bear target! Many secular bears end at valuations even lower than 7x, such as the 6.6x in 1982 when the previous secular bear gave up its ghost.
So in Long Valuation Wave market-cycle terms, the argument that the stock markets are in a young secular bull is exceedingly weak. Nevertheless, the gargantuan 163.4% cyclical bull over the past 4.7 years has indeed been epic. Such massive gains, and such an abnormally long time (25 months) since the last correction, have left investors euphoric and excited. So Wall Street is capitalizing on this by rationalizing their greed.
It continues to declare stocks are either fairly valued or even cheap. It utilizes a variety of approaches to spin today’s absolutely expensive valuations as reasonable. They include comparing stock prices to low bond yields, and considering average P/E ratios as the high ones late in secular bulls rather than long-term means. But the primary way to rationalize today’s P/E ratios as cheap is to fabricate them with fictional earnings!
By definition, a P/E ratio is today’s stock price divided by that company’s last four quarters of reported profits. These are called “trailing-twelve-month” P/E ratios in the industry. Many on Wall Street know that the SPX components’ simple average of 24.7x (with outliers capped at 100x) is indeed very expensive historically, so they shift the focus away by using a fictional conceit known as the forward P/E ratio.
Forward P/E ratios don’t look at the past year’s earnings which are known, but the coming year’s which are estimated. The problem is these guesses are always wildly optimistic when the stock markets are high. Thus forward P/E ratios are always predicted as being low, yet once the actual profits are earned that year the real P/Es prove much higher. In practice, forward P/E ratios are a steaming pile of bullish crap.
This is easy to prove. Take any major Wall Street house’s forward P/E estimate for the broader markets, wait a year, and see how much higher that year’s proper trailing-twelve-month P/E happened to be. For example, back as 2013 dawned professional analysts figured that SPX earnings would grow by 10% in this year’s third quarter. Yet with the dust settling on Q3’s earnings season, the actual growth is just 4%!
So whenever you hear anyone mention forward P/Es, realize they are off in the realm of fantasy merely blowing smoke. Estimating future sales and earnings for even one company, let alone 500, is utterly impossible. The business environment changes so fast that even the companies themselves usually find their coming year’s forecast proved way off. And external analysts have far less company data to work with.
Today’s stock markets are very expensive in absolute terms, compared to the centuries-long average broad-market P/E ratio of 14x earnings. But they are dangerously expensive in the context of being 14 years into a 17-year secular bear. This next chart zooms in to the span of this secular bear’s latest massive cyclical bull, highlighting how far above their secular-bear downtrend valuations have surged.
When the last cyclical bull of this secular bear topped in late 2007, traders were every bit as euphoric as they are today. The SPX was carving new nominal record highs then too, breaking out above its March 2000 peak when not adjusted for inflation. The American economy, led by the housing bubble, was booming. So Wall Street aggressively argued that investors should buy stocks because they were cheap.
Yet in absolute trailing-twelve-month terms, the broad-market SPX P/E ratio was way up near 21x. In simple-average terms, it was near 23x. Naive retail investors buying into that major stock-market topping that Wall Street was marketing as a great opportunity soon got crushed as the SPX rolled over into a new cyclical bear. Their “cheap” blue-chip stocks were more than cut in half after being bought so expensive.
And today after this latest cyclical bull galloped far higher for far longer than mid-secular-bear averages, we again see very expensive absolute valuations similar to that late-2007 topping. The SPX’s conservative MCWA P/E has been around 21x all year, and recently surged near 23x. And the simple average is now up near 25x, not too far from the dangerous classic 28x bubble levels seen at the ends of secular bulls!
The only times buying at 21x or higher leads to nice gains in the coming years is late in a 17-year secular bull market when a popular mania will erupt to bid stocks much higher. But we are either 14 years into a secular bear as the contrarians believe or 5 years into a secular bull as Wall Street argues. If the former is indeed true, then the SPX’s P/E ratio should be a lot closer to 11x now which means stocks will be cut in half.
But even if the bulls are right, that somehow in March 2009 a secular bear was magically short-circuited just halfway into its normal lifespan, valuations are still way too high. Five years into a new secular bull general-stock valuations average near 14x, about 3/8ths lower than today! So even if this new-secular-bull thesis is righteous, stock prices need to fall by well over a third based on current corporate earnings power.
So any way you slice it, stocks remain very expensive today. Investors who believe Wall Street’s hype and are suckered into buying in high are going to face a world of hurt when either the next cyclical bear is born or the long-overdue major correction arrives. Today’s stock markets are the riskiest they’ve been since early 2000 and late 2007, major toppings after which the flagship S&P 500 was literally cut in half.
Nevertheless, plenty of opportunities remain for prudent contrarian investors. The SPX’s Fed-driven levitation has sucked away all interest in and most capital from alternative investments like gold. This has left these alternatives exceedingly cheap and attractive. As the expensive stock markets inevitably start selling off, alternative investments are going to regain favor and start rallying dramatically as capital finally returns.
We at Zeal can help you anticipate and capitalize on these contrarian opportunities. As chronicled in our acclaimed weekly and monthly newsletters, we buy low when others are afraid then later sell high when others are brave. This strategy has led to awesome gains during this secular bear. All 655 stock trades recommended to our subscribers since 2001 have averaged annualized realized gains of +28.6%! Put our hard-won experience, knowledge, wisdom, and ongoing research to work for you. Subscribe today and thrive!
The bottom line is the American stock markets are very expensive today in valuation terms. They are now trading at price-to-earnings levels seen at major bull-market toppings, terrible times to buy stocks. This is true whether we are in a mature secular bear as the market cycles argue or a young secular bull as Wall Street desperately hopes. Either way, today’s lofty valuations are much too high to be sustainable for long.
Stock investing is about buying low then selling high, not about buying high then hoping for a greater fool to come along later. Stocks are absolutely expensive today in hard trailing P/E terms, despite Wall Street’s attempts to rationalize this with fictional forward P/Es. The only cheap investments today are the alternatives that have been shunned during 2013’s stock-market levitation. They have great potential to soar.
Adam Hamilton, CPA November 15, 2013 Subscribe |
|||||||
|
|
|
|
|
|
|
|
|
|
|
|
|
|
|
|||