|
|
|||||||
|
|
|
|
|
|
|
|
|
|
|
|
|
|
|
|
|
|
|
Soft Commodities: Grains Scott Wright June 27, 2008 3626 Words
The great commodities bull of the 21st century has elevated individual commodities and sectors of commodities in various phases over the last eight or so years. Those commodities that are finite (hard commodities) took the lead, with energy and metals breaking out to historic highs.
Growing global demand led by Asia’s industrialization has pinched the supplies of these scarce resources. And this has caused an economic imbalance that has birthed massive secular bull markets across the entire energy and metals complexes.
With hard commodities leading the way, it was only a matter of time before the soft commodities followed suit. Soft commodities are those resources that are renewable. If it can be grown, whether plant or animal, it is considered a soft. But even though softs are renewable, it doesn’t mean they can’t experience economic imbalances.
There is a wide assortment of soft commodities ranging from cotton, to pork bellies, to wheat, and even wood pulp. But in this essay I will focus on the grains side of the trade. Grains are the bellwethers of the softs and it is these agricultural commodities that nearly 150 years ago shaped the whole market for futures trading.
Today farmers rely on futures markets to lock in prices and manage their inventories. And speculators play the futures game in an attempt to score profits. The symbiotic relationship between farmers, speculators, and the vibrant fundamentals of the grains forms one heck of an exciting market environment.
Supply and demand are of course the driving forces behind all long-term price trends. And provocatively the dynamics that have led to what is shaping up to be a growing global grains imbalance come from underlying trends that have long-been in the works. These trends are now apparent and the markets are really starting to take notice.
Over the last several decades a whole slew of factors have provided catalysts for the rise of the grains. With one of the largest being the lack of material growth in the agricultural industry. And considering the long-time behavior of grains prices, it is understandable why there has been little incentive to grow this industry.
When the price of any good or service grinds sideways for decades on end while the rest of the world is inflating away, this tends to harbor dismal growth prospects. And this is typically not an encouraging environment for capital investment. In fact if the fruits of the land are not as appealing as an offer from a commercial developer, a prudent business operator will take the money and run.
While technology improvements over the years have indeed enabled better crop yields, according to the US Department of Agriculture the US planted area for the major crops has dropped by nearly 15% since 1980. And since the US is the stalwart of global grains producers, this trend has had a major adverse effect on the global agricultural industry.
But with flat grains prices over the last several decades, you can hardly blame the farmers for capitulating. Government subsidies only go so far as rapidly rising costs mixed with a declining dollar strangle the farmers’ ability to run profitable businesses.
Even the USDA has acknowledged that “stable” food prices over an extended period of time have led to complacency in the agricultural industry. This complacency ranges from lack of investment at the individual farm level all the way to gross mismanagement of stockpiles by the world’s governments. As all this comes to a head we find an industry that is scrambling to right the ship and adjust to this global commodities bull.
The simple fact is the world’s population continues to grow, and so does the demand for staple foods. So with the primary end product of grains being food, supply needs to keep up with growing demand. And it is not! Supplies have been growing, but not sufficiently enough to meet demand growth.
And to put a twist into this supply/demand imbalance, segmented economic prosperity is also changing the dynamics of the grains trade. Economic growth in the world’s developing nations has and will cause extra strains on the grains. As more and more people add protein and other valuable nutrients to their diets, grains demand will continue to gain strength.
Not only will the demand for grains as direct food consumption grow, but so will their demand for use as animal feed. Land animals, while long thought to be delicacies in many developing nations, will become staples for a lot more households. Interestingly the demand for animal feed greatly leverages the demand growth for meat.
Cows and hogs require about seven pounds of feed to produce one pound of meat. And as the demand for animal byproducts continues to grow (i.e. eggs and dairy) even more grains will be required in order to satiate what should be sharply growing global demand for protein.
Also a big factor weighing on the grains is the increasing demand for biofuels. As energy prices continue to rise, alternative sources of energy become economically viable. And while biofuels haven’t quite found their economic balance, their production has ramped up to a much larger scale, thus greatly drawing on the already tight grains supplies.
These factors are just some of the structural issues that the agricultural industry must address. And these main ones don’t even begin to address other interim factors that weigh on this industry year-in and year-out such as climate changes, water shortages, disease, and growing speculation to name a few.
Drilling down on specific grains it is corn, wheat, and rice that account for nearly 90% of the world’s grains production. And some experts estimate these grains are responsible for nearly half the calories people consume each year. Also for the purposes of this essay I will lump in soybeans in my analysis of the grains. Though soybeans are officially classified as a legume, traders usually put them in the grains category from a global trade perspective.
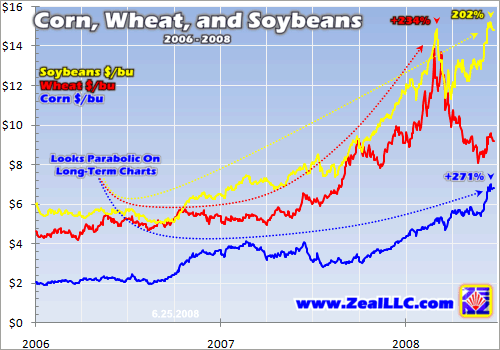
As I’m sure you’ve noticed, the prices for these grains have skyrocketed in the last couple years. From their 2006 lows corn, wheat, and rice are up 271%, 234%, and 200% respectively to their recent highs. Soybean prices are also up over 200% since this soft began its run in late 2006.
Ultimately since the main crops of the US are corn, wheat, and soybeans and since these softs also get the most exposure from US traders, this is where I will center my attention. Though rice has a large global following, the US doesn’t make a dent in its production or consumption. And as people add more protein and nutrients to their diets, wheat especially will take demand away from rice.
This first chart shows why all the excitement is around the main grains of recent as corn, wheat, and soybeans have all had spectacular runs. But this short-term chart doesn’t capture the historical meaningfulness of these breakouts. In addition to some fundamental analysis, it is important to view the long-term charts so we can see how today’s nominal highs compare historically.
As will be apparent in the long-term charts the grains have been range-bound in sideways trend channels for the better part of the last four decades. Every so often there were strong rallies that elevated prices, but they quickly fell back within trend.
But what we are seeing in the last couple years are major breakouts from these trends. Is it possible that these decades-long trends will be broken for good? Are we in a new era for the soft commodities? And what are the potential impacts continuing high grains prices will have on the markets?
Let’s look at corn first, as it has really been the focal point of the grains in recent weeks. With the US being the largest corn producer and consumer in the world, the recent major flooding within its heartland corn belt is really hurting the already tight corn market.
These weather problems mixed with a number of other factors are contributing to a corn price that is right now nearly going parabolic. So far in 2008 corn has risen by over 60% and it has already well-surpassed its all-time nominal highs.
One of the biggest contributors to corn’s rise is its use in biofuels, in particular ethanol. In the US ethanol’s feedstock primarily comes from corn. And ethanol production in the US has been skyrocketing. This is partly due to the perceived economic benefits of ethanol but primarily due to the mandates set forth by the US government.
The Energy Policy Act of 2005 and the Energy Independence and Security Act of 2007 are statutes that mandate an increase in biofuel volume to supplement gasoline consumption. This has of course caused a sizeable shift from food and feed over to ethanol. In fact the USDA reports that corn use for ethanol has more than tripled in the last five years and that the biofuel craze now consumes a quarter of all US corn production!
And things don’t get any better from here. Ethanol production volume from corn needs to nearly triple again from last year’s number by the year 2022. The USDA expects this trend to command one-third of the corn crop by 2010 and onwards from there. Provocatively ethanol production at these future mandated volumes will still be less than 10% of gasoline use in the US.
Ethanol is really tightening up the market for corn. And it is apparent that this biofuels impact has spread to greatly affect the fundamentals of the other grains as well. Eventually the US government will realize that its communist-style mandates are directly contributing to rising food prices.
This can be really damaging to not only the US economy but the global economy. If the government thinks people are upset about the cost of filling their vehicles, just wait until it experiences the wailing and gnashing of teeth when food prices go through the roof.
On a side note if the government ever decides to fix its mess, a temporary or permanent freeze on its ethanol mandates would send waves through the grains markets. Foolish Acts of Congress such as these really display the politicians’ lack of understanding of economics and free markets!
Ultimately these are just some of the factors that contribute to corn’s meteoric rise and build a case for high corn prices going forward. But in looking at the next chart, is history going to repeat itself and crash this spike back into corn’s long-grinding sideways trading pattern?
Since 1970 corn has been range-bound and has averaged a price of just under $2.50. Every so often this price would approach $4 and dip below $2, but overall it has been steady in this range. Other than a brief trip above $5 in 1996, corn has been sliding sideways for decades on end.
But with the recent spike above $7, many people are wondering if the days of cheap corn are behind us. While I do believe corn may be a bit overbought and due for a correction to balance sentiment, are the prices we see today really all that excessive from a historical context?
To answer this question we need to consider inflation’s effect on corn over time. And in looking at this chart you can see that corn is actually still cheap. Using the US Consumer Price Index we can inflate corn’s nominal price history. And with a little bit of math we get the blue line that shows corn’s price in constant 2008 dollars over the last 37+ years.
Interestingly in today’s dollars corn was above $7 for much of the 1970s and early 1980s. So measured by the past, $7 corn is not unfamiliar territory. And while corn may indeed be at its nominal highs today, it still has a long way to go before it reaches its real high near $17.
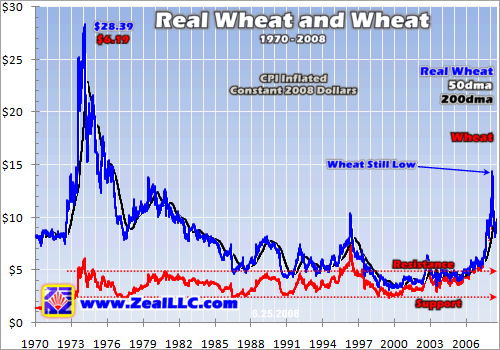
Moving on to wheat, this grain has also had quite a run in recent years. A big catalyst to wheat’s precipitous rise that took it parabolic into February was when traders realized its 2008 beginning stocks were at their lowest levels in 30 years. Beginning stocks are carryover from the previous growing season, and when the alarming numbers from 2007’s ending stocks came together, panic hit the markets.
Also hurting wheat production was adverse weather conditions over the last couple years as well as a major US crop planting shift to account for the increasing production of biofuels. In the cropland that can be interchangeable between corn and wheat, many wheat farmers shifted to planting corn based on increasing demand and a forecasted rise in price.
Like the other grains the price of wheat had been bouncing around in a sideways pattern for decades on end. With the average wheat price (Kansas City, #2 grade hard-red winter) at $3.75 since 1970, the nominal prices above $9 we are seeing today are virtually unprecedented.
While wheat would spend seasons bouncing around in this trend between about $2 and $5, these recent breakout highs have sure caught the world’s attention. My business partner Adam Hamilton wrote a fascinating commentary on wheat and inflation in the midst of its rise last autumn, and I encourage you to peruse it if you are at all interested in this popular soft commodity.
So far since its low of $2.60 in 2000, wheat has risen by over 400%. And while wheat has corrected since its February highs of around $14, it is still well above multi-decade resistance. But in adjusting the price of wheat for inflation, these nominal highs are nowhere near real highs. Using the CPI to inflate wheat’s price over time, in constant 2008 dollars its real high from the early 1970s is over $28!
Well with the price of wheat way up, record production is expected to meet record consumption in 2008. And this brings up an interesting grains characteristic, their adaptability. Because grains are renewable and have crop cycles that span just a season, farmers sometimes have the ability to make ad-hoc adjustments on a year-over-year basis. Simply put if there is a major shortage, more wheat can be planted.
But this flexibility comes with consequences. Planting area increases in wheat might decrease the planting area for say soybeans, and vice-versa. This characteristic is really apparent when you view a chart of each grain’s annual planted acreage.
In a recent forecast by the USDA you can see corn and soybean planting down and wheat up this year to account for the major shortages. But going forward the USDA expects wheat and soybean planting acreage to continue trending down while corn’s rises thanks to ethanol.
This trend actually began in the mid-1990s for wheat. And by 2006 there was 25% less acreage dedicated to wheat than just ten years prior. This is a huge decrease considering that the US is the world’s third-largest wheat producer and its top exporter. If the conservative USDA expects low stocks and high wheat prices to persist for the next decade, which it does, then there could be a lot of room to run for this grain.
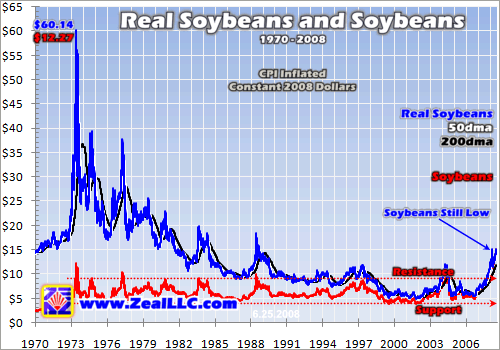
Finally we get to soybeans, which are a soft that has grown increasingly popular over the years. Interestingly early in the 20th century most farmers in the US didn’t give soybeans a second thought. But after planting conditions proved favorable and global demand continued to rise, soybeans eventually became this country’s largest exported commodity.
Today the US is the world’s top producer and exporter of soybeans, by a measure of two-fold over the next largest producing country Brazil. And measured by trading capital soybeans are by far the largest cash crop in the US, well surpassing any of the grains.
The global demand growth for vegetable oil and protein meal from soybeans is well outpacing supply growth today, which is why the price of soybeans is at a record high. And the cause for this imbalance is the same old story. Global stockpiles are at historic lows, the planted area is down, and there is growing creepage from the grains crops that produce biofuels.
As you can see in this chart soybeans have also long been range-bound in a sideways trend channel. Since 1970 soybean prices have largely languished around the $5 level with the occasional climb to the top of resistance near $9.
With the average soybean price since 1970 just over $6, the $14 we see today has gotten folks really excited about this commodity. But though today’s price levels are nominal all-time highs well above long-term resistance, there is still a long way to go before this bean gets near its real high of $60.
Ultimately the fundamentals are stacked up nicely for ongoing bull markets in the grains. Demand growth and supply growth remain tight and it will take many years for the agricultural industry to balance crops between food, feed, and biofuels, properly manage crop acreage growth, and adjust to the radical change of diet for a large part of the world’s population.
But there is one glaring factor that is likely to keep grains prices high regardless of the fundamentals already mentioned. And this is skyrocketing operating costs. The sharply increasing costs of doing business in the agricultural industry should put an end to the decades-long “stability” of grains prices.
When powerful and historically-unprecedented commodities bulls in the hards take shape, it is a certainty that there will be a trickle-down effect into the rest of the commodities. Since it takes commodities to produce commodities, operating costs will naturally rise. With costs rising faster than any subsidy can begin to cover, it is inevitable that the price of the end product will rise.
For the grains this pass-through commodities inflation starts from the beginning of their lifecycles. From seeds, fertilizer, and chemicals to grow the crops, to fuel and power to get these crops market ready, costs are skyrocketing. Using corn as an example, an estimate from the USDA has these components alone accounting for 86% of operating costs and 45% of total costs when overhead (labor, land, etc…) is thrown in.
And what is frightening is these USDA figures are from a 2007 forecast. Since this official forecast these input costs have just skyrocketed. The farmers simply cannot absorb cost increases for such inputs as oil and potash among the many others. Costs must be passed on to the consumer.
And then when you throw in transportation costs, it is easy to see how this becomes a global issue. Of course ground freight and rail costs have risen with fuel, but ocean freight rates for dry commodities have gone through the roof.
Ultimately there is a lot more that goes into the grains trade than what I highlighted today. But in understanding that there are structural conditions that scream for an end to cheap grains prices, we can now look to this sector for trading opportunities.
At Zeal we have focused on trading the commodities markets since 2000. Much of our attention through the years has been on the metals and energy markets. For the average investor that only invests and/or speculates in the stock markets, there has been a broad array of opportunities to leverage the secular bulls of metals and energy by buying the stocks and/or options of those companies that explore, develop, mine, or drill for these commodities.
Legendary gains have been won in the hards and these commodities are still likely to thrive for at least another decade as supply continues to struggle to meet demand. And it has certainly been fascinating to watch how the bullish fundamentals of the hards have cascaded into the entire commodities complex.
It was only a matter of time before the softs joined the parade, but there have been limited opportunities for stock traders to participate in these newest bull markets. Publicly traded farmers simply don’t exist and it would not be feasible to hoard physical grains. Up until recently only the futures traders and offshoot servicers of the agricultural industry have been able to play the grains game.
But new trading vehicles have surfaced in recent years that now allow stock traders to gain direct exposure to the grains. A number of ETFs and ETNs have hit the markets that either track or directly invest in futures contracts of the high-profile soft commodities. There are ETFs/ETNs that specifically invest in the grains detailed in this essay as well as those that provide broader exposure to the realm of the softs. And there are even those that provide double leverage on both the long and short side.
At Zeal we believe there are still fortunes to be won trading the softs, in particular the grains. In our newsletters we have long discussed the impending food inflation crisis. And with these new agricultural ETFs and ETNs we are able to freely invest and speculate in these markets without the risks and hassles of futures trading.
In recent months we have deployed newsletter trades to test the resolve of these hot softs markets and we continue to formulate future trading strategies with the help of excellent new exchange-traded tools. If commodities are at all intriguing to you, please subscribe to our acclaimed monthly and/or weekly newsletters so you can access cutting-edge commodities market analysis and high-potential stock recommendations.
The bottom line is the bull markets in the grains are righteous. Not only are there interim factors that are driving prices higher, but there are long-term trends that justify breakouts from the grains’ long-grinding sideways-moving prices.
With demand growth outpacing supply growth, global diet changes, a huge rise in biofuel demand, and skyrocketing operating costs among many factors, the days of cheap grains are likely over. And stock traders can now utilize ETFs and ETNs to effectively trade these markets.
Scott Wright June 27, 2008 Subscribe |
|||||||
|
|
|
|
|
|
|
|
|
|
|
|
|
|
|
|||