|
|
|||||||
|
|
|
|
|
|
|
|
|
|
HUI and Stock Bears Adam Hamilton August 10, 2007 3736 Words
The turbulent financial markets of the past few weeks have certainly been exciting, a welcome respite from the usual lackluster summer doldrums. But whenever volatility increases, especially after a long period of time lacking it, long-latent fears of investors and speculators flare brightly.
The small subset of investors and speculators trading precious-metals stocks has certainly not been immune from this growing unease. On some of the more intense selling days lately in the general stock markets, the HUI gold-stock index fell far more than the flagship S&P 500. This suggests PM-stock tradersí fears are spiraling higher even faster than those of the mainstream traders.
While there are a variety of factors driving these PM-stock fears, most relate to the core thesis of the threat of a major bear market in the general stock markets. Indeed, very strong fundamental and technical cases can be made arguing that a major bear market is long overdue. The stock markets remain richly valued for this stage in their Long Valuation Wave and they havenít had any meaningful correction since early 2003.
If a bear is approaching or already upon us, PM-stock traders fear that their sector will not escape from this hungry bearís wrath. They suspect that during such a traumatic event, everything will be sold with no distinctions made between fundamentally-promising and fundamentally-weak sectors. And if the baby will be thrown out with the bathwater, then it makes little sense to hold PM stocks through such an event.
There have already been a couple mini-scares in 2007 that buttress these fears. In late February when the SPX swooned in sympathy with a sharp selloff in the Chinese stock markets, the HUI plunged about 2.5x as far as the general stocks. And more recently in late July, the HUI mirrored and exceeded the SPX selloff by 1.5x or so. During these two episodes the HUI not only paralleled SPX selloffs, but it amplified them.
Based on these events, traders and analysts alike fear the HUI will be crushed in the next general-stock bear. And if their sample of data is limited to 2007 alone, then you canít blame them for reaching such conclusions. Ever the contrarian agitator though, I believe this thesis quickly falls apart in the light of a little historical perspective. The tyranny of the present has blinded this notionís adherents to the precedent of the past.
We humans have a natural tendency to extrapolate the present out into infinity, to dwell so intensely on the events of today that we forget yesterday. This is a fatal flaw for investors and speculators as it leads them to buy tops and sell bottoms, the exact opposite of what success demands. So students of the markets overcome this deadly bias by studying the past and using this knowledge to frame the present.
This PM-stock bull is not new by any means. It started stealthily in late 2000 when only the most hardened and incorrigible contrarians dared to deploy capital in a sector that had been ripped to shreds for decades. About seven years and 1000% HUI gains later, this bull has made them rich. I was blessed to be among this early black-sheep crowd and have been reaping the rewards ever since.
When your capital is heavily deployed in a sector, you pay darned close attention to what is going on. So continuously over the last seven years I have watched the PM-stock sector. In addition to being a student of the markets, I also wrote many hundreds of essays, newsletters, and alerts in this span of time to help our subscribers thrive and grow wealthy. And since this PM-stock bull climbed a wall of worries like all bulls, I had to address each worry as it arose and decide if it was indeed a threat. So I remember the fears of the last seven years very well.
It is funny as the greatest fear during the early years of PM-stock investing was not their valuations at the time, which were ludicrously high even by NASDAQ-2000 standards. Instead it was what would happen to PM stocks if things got really ugly in the general stock markets. As King Solomon wisely said thirty centuries ago in Ecclesiastes, there is nothing new under the sun. So please realize that fears for PM stocksí fortunes in a general-stock bear have existed more or less continuously since 2000.
Thus it is with great amusement I watch many traders and analysts today, who are obviously pretty new to the PM-stock scene, wail and gnash their teeth over their latest theories on PM stocks in a stock bear. Based on a sample size of 2007 alone, less than 1/14th of this entire PM-stock bull, they are utterly convinced a general-stock bear is going to obliterate the PM stocks. So they are selling aggressively and urging others to do the same before it is too late.
But with 13/14ths of this bull market occurring before 2007, perhaps it would be wise to look to history to see how the PM stocks behaved in an actual stock bear rather than wildly guessing. Conveniently enough, the HUI bull market started early on in the wicked general-stock bear that ran from early 2000 to early 2003. So rather than look to a couple of mini-panic weeks in 2007 alone, a trivial sample size, we can consider a couple of years during a real bear in the early 2000s, a meaningful sample size.
The charts in this essay compare the HUI with the SPX during those bear years. This allows the actual PM-stock performance during the very worst that a bear can throw at us to be analyzed. And provocatively, actual historical precedent offers a radically different perspective of what the HUI can be capable of during a bear than the apocalyptic PM-stock fearmongers pounding their tables today.
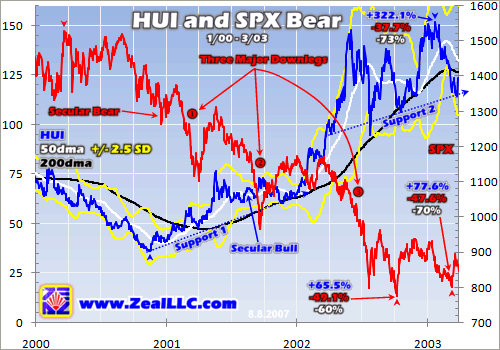
There is a popular notion today that the stock markets are faring exceptionally poorly. Nonsense. At worst on a closing basis, the SPX is down just 7.7% since its latest July highs. This chart shows a truly poor-performing market, a real bear. From March 2000 to October 2002, this flagship US stock index containing the biggest and best US companies fell a horrific 49.1%! There were many stretches during this bear that make the last few weeks look like playschool. How soon traders forget what real pain feels like!
During this bear, there were three particularly wicked downlegs which are labeled above. The fears that bloomed during these very sharp plunges were overwhelming and suffocating. Such sharp bear-market downlegs represent the very worst that a bear can throw at us. If you want to imagine the ugliest-possible general-stock environment that the PM-stock sector is likely to face, these downlegs are it.
Although there were certainly days and even weeks when the HUI swooned in parallel with the SPX decline, on balance the HUI weathered the latest stock bear rather well. In order to empirically quantify just how well, I measured SPX and HUI performance from certain key points. The red and blue arrowheads mark these spans of time. And this is the key, to consider the HUIís overall bear-market performance over meaningful spans and not just dwell on a few isolated bad days here and there.
At the end of each span, three numbers are given. The blue one shows the actual HUI performance, on a closing basis, over the span. The red one shows the SPXís performance on a closing basis. It is crucial to realize that these numbers for any given span were calculated from the exact same starting and ending days. So they are not optimized to show the HUI in a better light or the SPX in a worse light.
The third white number is the correlation r-square, which shows how closely the HUI and SPX happened to be correlated over a particular span of time. Now to get an r-square, you multiply a correlation coefficient by itself. Of course this means all r-squares are positive, as two negative numbers or two positive numbers multiplied together yield a positive product. In order to highlight the underlying correlation here, I put minus signs in front of the r-squares if their underlying correlation was negative. So these are not negative r-squares, just normal r-squares derived from negative correlations.
Using these tools, we can really empirically understand how the HUI performed during the last stock bear. Technically the bear ran from March 2000 to October 2002. Over this really nasty period, the SPX lost 49.1%, nearly half of its value! Now if todayís PM-stock fears are to be believed, the HUI should have performed in line or worse. In reality it actually rose 65.5% to the very day during the SPXís bear! So did PM stocks suffer in the last stock bear? Not so youíd notice!
While this bear technically ended in October 2002, sentimentally it really ended at its secondary low of March 2003 the week Washington invaded Iraq. Using this yardstick, the SPX bear shed 47.6%. How did the HUI fare? To the very day it was up 77.6%. Not only did it not follow the SPX down, but it had a 70% r-square based on a negative correlation. In other words, 70% of the HUIís positive daily behavior could be directly statistically explained by the SPXís negative daily behavior!
Take a second to really ponder this. Today the popular belief among PM-stock traders and analysts is the HUI is highly positively correlated with the general stock markets. So if the SPX sells off big, the HUI will have to fall with it. But the crystal-clear lesson of history is the HUI is actually very negatively correlated with the SPX during stock bears. Although heretical based on todayís dogma, really weak stock markets are actually good for the alternative-investment PM stocks over the long run!
These non-optimized HUI results are outstanding, and Iíd take them any day. But if we actually look at the most favorable span of time for the HUI within the SPX bear, it blows the earlier numbers out of the water. From November 2000 to January 2003, the HUI soared a breathtaking 322.1%! Meanwhile the SPX fell 37.7% over this exact period of time to the day. Traders who succumbed to the same stock-bear fears back then that are now making a resurgence today lost out on winning these massive gains.
While it is pretty clear that the HUI did fantastic over the entire span of the last stock bear weíve witnessed, this analysis is still incomplete. Today traders fear fear itself. They are worried about sentiment getting so bad in the general markets that everything is sold without discretion, including PM stocks. So perhaps it is myopic to consider an entire bear when it is instead short-term-but-brutal explosions of fear that threaten the HUI.
To find the most intense maelstroms of fear within any bear, look to its sharpest downlegs. They quickly ramp fear to unbearable and unsustainable extremes. The next three charts show how the HUI fared in each of the three major downlegs marked above. If you werenít actively trading during these times or in similar terminal-downleg episodes in the more distant past, then you probably have no idea of what real fear looks like in the stock markets. The wimpy little slides of the last few weeks donít even come close.
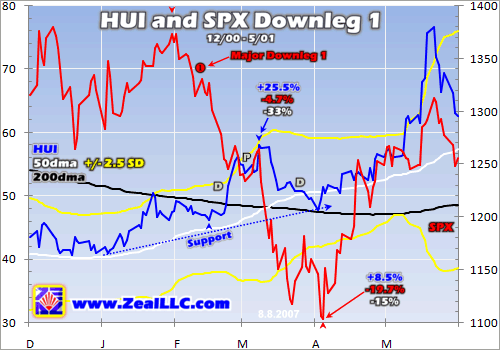
From late January 2001, less than a month after Alan Greenspan tried and failed to bail out the US stock markets, to early April, the SPX plunged 19.7%! A similar episode today would blast the SPX below 1250 by mid-September! Now that would be some real pain. This was the first real downleg of the bear and a major wake-up call for investors. And it starting just a month after an emergency mid-meeting rate cut by the Fed really highlighted the total futility of governments attempting to short-circuit bear markets.
Over this same period of time to the day, where stress and fears were staggeringly high, the HUI managed to eke out an 8.5% gain. Now 8.5% isnít massive, but it does annualize to 50%+. If you asked average PM-stock traders what would happen to the HUI today if the SPX plunged 20% in two months, I bet theyíd say the HUI would be down 30% or more. But in real history, it managed a nice gain during just such a traumatic event.
Now while the final results were very favorable for PM stocks, it wasnít all fun and games. If you carefully examine the HUI and SPX lines during this wicked downleg, it is apparent the HUI did indeed parallel the SPX lower at times. The Ps on these charts mark key episodes of this parallel highly-positively-correlated behavior. But there were also major divergences, marked by the Ds. Such contrasts are apparent in all major downlegs.
While the HUI tends to be strong overall and follow its fundamentals, namely the price of gold, there are always periods of days or weeks when it seems to move in lockstep with the general markets. Back in early 2001, like today, there was a huge temptation to cherry-pick these samples and build HUI-bearish doctrine from them. But it was and is far more profitable to consider the HUIís performance over entire downlegs, more meaningful samples, than just a few particularly bad days within one.
Interestingly cherry-picking can work in the HUIís favor too. At best within this downleg, the HUI was up 25.5% in a matter of weeks while the SPX shed 4.7%. But just as it would have been impossible in real-time to exactly catch this extreme in our trades, it is impossible today to exactly time the days the HUI is going to temporarily fall with the SPX. We are far better off riding it out, accepting the bad days when they come, and waiting for the HUI bullís secular trend to reassert itself and pull PM stocks higher.
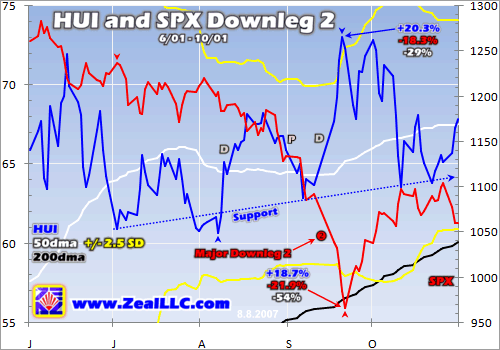
The second major downleg happened later in 2001 and it was even more severe. The SPX started really accelerating lower in early July after a higher bounce following the first downleg. From then until late September, the SPX shed 21.9%. As you can see above, the last week of this downleg was particularly scary as it was a rare freefall. A similar decline today would batter the SPX down near 1200 by early October.
Now if you want a scary general-market time, the last weeks of this downleg were it. Yet incredibly in this crucible of fear the HUI diverged from the SPX and soared higher! Gold and silver stocks ultimately follow the prices of gold and silver, not the SPX. They are alternative investments that tend to thrive when general stocks are not. Overall during the exact span of time of this wicked stock downleg, the HUI rallied strongly to an 18.7% gain!
Once again though, riding this downleg in the HUI was not for the faint of heart. From mid-August until early September, the HUI paralleled the SPX perfectly. Todayís small-sample-size commentators would have a field day writing about this and proclaiming the end of the HUI bull. But jumping out in early September just when things were looking hopeless for the SPX and HUI would have been the worst-possible decision. Instead the prudent PM-stock traders who knew the HUI should do fine on balance, so they stayed deployed, won all the profits.
There is another key point to realize here. The September shown above was when the 9/11 attacks happened. While the SPX continued lower after the stunning terrorist attacks, PM stocks soared with the metals. I highlight this because many traders and analysts believe today that a major new terrorist attack will crush the stock markets and the HUI as well. Maybe not. If the HUI can soar in the aftermath of 9/11, then perhaps alternative investments will be highly sought after following the next big terror attack too.
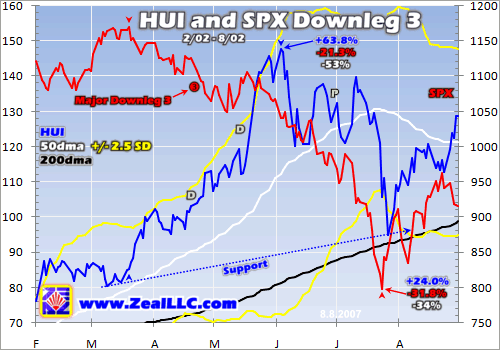
The final downleg of the last stock bear unfolded throughout the summer of 2002. June and July of that year were incredibly intense and frightening, light years beyond anything weíve seen in the past several weeks of this summer of 2007. From mid-March to late July, the SPX fell a gut-wrenching 31.8%. Yes, over a single summer the biggest and best US stocks lost nearly a third of their value! If this happened today, the SPX would be down near 1050 by Thanksgiving and stock brokers would be leaping to their deaths from skyscraper windows.
Like in all the other downlegs, there were times when the HUI diverged from the increasingly distressed SPX and times when it ran parallel with it. The most disturbing of the latter is the sharp slide of the HUI when the stock markets were plummeting in July. Although this was sure a trying time as you remember if you were trading it, despite the HUIís late-downleg affinity to the SPX the PM stocks still gained 24.0% over the exact span of time that the SPX plummeted 31.8%.
By now the general HUI pattern during the very worst episodes that the last bear could conjure up should be clear. While there were difficult episodes within downlegs when the HUI would parallel the SPX for days or even weeks, these were always temporary. Overall the HUI shook off the worst of the SPX downlegs as if they didnít even exist. On average through all three, the HUI gained 17.1% while the SPX lost 24.5%.
Even if you believe a general stock bear is approaching sooner or later as I do, youíd be hard-pressed to spin a scenario where the fear it generates will be worse than the extreme fears the great SPX downlegs of 2001 and 2002 spawned. 20% to 30% declines in the general stock markets over a matter of months are about as bad as the markets ever get in history. Even the early-1930s episode took years to unfold.
And if the HUI performed well during the last stock bear, why not give it the benefit of the doubt this time around? Sympathetic HUI selling on SPX weakness periodically happened within that bear and within each of its downlegs, just as weíve seen in 2007, yet on balance the HUI still managed outstanding positive performance. The precious metals, and their miners, are never highly positively correlated with the stock markets over long periods of time. They are classic alternative investments that traders flock to during times of general-stock weakness.
There is an old market axiom that states the five most dangerous words in investing are ďThis Time It Is DifferentĒ. Yet this is exactly what the adherents of the popular the-HUI-is-doomed-in-a-bear-market theory are asserting today. Rather than believe that it is fundamentals that drive the HUI today just like they have for the last seven years, these traders have somehow come to believe that the SPX drives the HUI. This whole concept just boggles my mind as it seems so silly in the light of stock-market history.
A popular offshoot of this theory that is also amusing is the margin-call thesis. Many PM-stock traders think that general-stock selling is going to lead to margin calls. In order to meet these margin calls, investors will sell everything they can including PM stocks. This will drag down the PM stocks along with the general stocks. This thesis is tenuous at best though.
Mainstream investors loathe PM stocks. It is still only the contrarians who own them, and contrarians have generally already learned their lessons about the dangers of speculating with borrowed money. If mainstreamers donít own PM stocks, they arenít going to be able to sell them to meet margin calls. But even if they did own them, the PM-stock sector is vanishingly small. At the end of July, the SPX had a market cap of $13,646b. The entire HUIís was only $110b, or 0.8% of the SPXís. So in relative terms selling PM stocks wouldnít even put a dent in margin debt during a serious downleg-type SPX decline.
In the HUIís favor, it is vastly easier to buy today for fundamental reasons than it was during the last SPX bear. Back then, most PM stocks were losing money and the ones that were making it traded at ridiculous multiples that would make a tech stock blush. As of the end of July, the HUIís 28.6x P/E ratio was actually lower than the NASDAQ 100ís 30.9x, so it is not a fundamental challenge to buy the HUI today. And back then, goldís rally was too young to be decisive. Today it is clear without question gold is in a secular bull.
In light of all this, the PM stocks really ought to thrive on balance even if a new SPX bear is upon us. Historical precedent weighs heavily in their favor. During times of general-market turmoil, sooner or later even mainstream investors get interested in gold and silver and the companies mining these metals. It is really a baseless stretch to declare that PMs and PM stocks are suddenly not alternative investments anymore.
At Zeal we study market history extensively to ensure we have proper perspective and arenít swayed by the vagaries of short-term sentiment swings. Thus we have been fighting the crowd, as usual, and aggressively buying elite PM stocks. Not only are they technically weak and relatively cheap, but pessimism in this sector is overwhelming and irrational. The biggest gains arise from buying when consensus is the most scared.
If you want to understand how to practically apply our cutting-edge research and mirror our trades in elite commodities stocks at technically-opportune times, then please subscribe to our acclaimed monthly newsletter today.
The bottom line is this HUI bull performed awesomely well during the last major bear in the US stock markets. Yes, there were certainly days or weeks when the HUI seemed to sell off in sympathy with the general stocks. But on balance throughout the entire bear and even throughout the most brutally wicked downlegs the bear could offer, the PM stocks rallied to excellent gains without exception.
Although many traders and analysts believe today is somehow different, Iíve seen no evidence to support such a radical departure from historical precedent. Gold and silver, still alternative investments, remain in strong secular bulls. And it is their strength that will drive the PM stocks higher, regardless of what happens in the general stock markets.
Adam Hamilton, CPA August 10, 2007 Subscribe |
|||||||
|
|
|
|
|
|
|
|
|
|
|
|
|
|
|
|||


