|
|
|||||||
|
|
|
|
|
|
|
|
|
|
Neutral HUI Technicals Adam Hamilton February 24, 2006 3147 Words
Financial markets have many innate characteristics that investors and speculators really need to understand in order to trade profitably. One of the most important is that all markets, even during secular trends, flow and ebb. Even within long-term bulls or bears prices inevitably move up and down.
While this truth seems simple and obvious in the abstract, it really causes a lot of problems in practical application. Generally near the very time that prices are due to change direction for a season, investors and speculators are so enamored with the existing tactical trends that they consider the mere possibility of a trend change heresy. Hostile reactions to tidings of such a likely interim reversal are the norm.
Today probabilities suggest that just such a short-term trend change is here or nearing in the red-hot gold-stock sector. While the overall gold-stock trend remains powerfully bullish, periodically corrections or consolidations must happen in order to rebalance sentiment and lay the foundations for the next mighty upleg.
After actively trading every single upleg since this gold-stock bullís humble beginnings in November 2000, as a student of the markets I have learned to live with these periodic corrections. They are actually quite beneficial. The interim tops ahead of these corrections grant ideal opportunities to realize profits. And the interim lows after these corrections yield awesome buying opportunities to reload on elite gold stocks.
Nevertheless, I realize few things irritate gold-stock fans more than hearing that the odds for a correction are high. Iíve written several hundred of these weekly essays as well as hundreds of newsletters and no other topics generate as much hate mail as warnings on the eves of probable corrections. While I am not particularly masochistic I still believe this information is important for all gold-stock players to consider.
The benefits of gaming corrections for speculators are obvious, another stellar opportunity to trade. But even investors ought to pay attention to these periodic ebbings. Why? While investors arenít interested in selling they do add new capital to the gold-stock bull from time to time. This capital goes much farther, in buying more shares, if it is deployed near an interim low rather than an interim high. Thus investors can benefit greatly from understanding the flowings and ebbings of their bull even if they arenít planning on selling for years.
Hence this week I would like to delve into the HUI technicals, which have shifted to neutral in February. While anything can happen at anytime in the markets, such as the HUI rocketing to 400 tomorrow, odds are it wonít. Prudent investors and speculators, while acknowledging randomness, still prefer to trade with the probabilities rather than against them. And now the odds are very much favoring a HUI correction or consolidation.
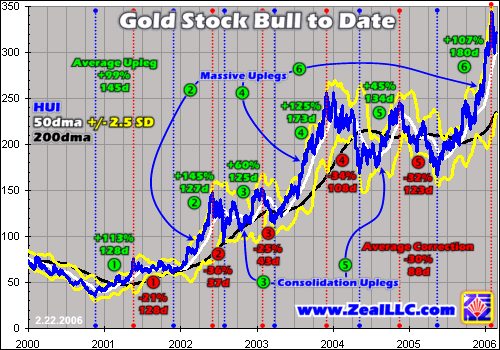
Iíd like to open with a strategic chart showing this entire awesome HUI bull to date. Up a breathtaking 858% since November 2000, the HUIís bull has already been fantastically profitable. Nevertheless, it has flowed and ebbed, with six major uplegs and five major corrections so far. To not expect a sixth major correction sooner or later is pure folly, greed-driven hubris.
Assuming that the recent February 1st HUI highs hit the high-water mark of its latest upleg, the six major HUI uplegs in this bull to date have averaged 99% gains over 145 trading days, about 7 months each. This latest upleg since May 2005 ran longer at 180 days and a bit higher at 107%. Any way you slice it, the HUIís more than doubling since May was awesome and has been fantastically lucrative. I really enjoyed this ride.
Thereís another metric that I find really fascinating though. It is the average gain in the first five major uplegs of this bull, before our latest one. It ran 98%. Since the markets are a study in probabilities, this number has been very interesting. Back on June 1st in the 6/05 Zeal Intelligence newsletter, I used this average gain to project a probable target for the HUI of 330 in this upleg, 98% higher from its May lows. At the time the HUI was trading under 190 so it seemed optimistic, but it was merely average relative to bull-to-date precedent.
Now there was no rule saying the HUI had to gain 98% in this latest upleg. Its past individual upleg gains have run from 45% on the low side to a staggering 145% on the high side. Nevertheless, as a speculator it is good to have a rough target and bull-to-date averages can provide this. The HUI exceeded this 8-month-old target by about 15 points in early February, but it still gave us an idea of what we ought to expect in average terms.
At 107% upleg-to-date gains today, our latest specimen has exceeded expectations and led to some extremely profitable realized gold-stock trades. We bought gold stocks last summer and autumn when the odds were in our favor and we ratcheted up our trailing stops to preserve our profits about six weeks ago when the HUI started looking toppy. After all, no upleg goes up forever, no matter how powerful its underlying bull is, and neither will this one.
After any upleg a correction is inevitable, the necessary and healthy ebbing to rebalance sentiment and lay the groundwork for the next major upleg. Bull to date as this chart shows, the average HUI correction has lopped 30% off this flagship index over 88 trading days. Assuming the highly-probable coming HUI correction follows bull-to-date precedent, a 30% haircut from the February 1st highs yields a rough target of 240 in the coming months.
Now will the HUI really hit 240 after this upleg? As a mere mortal who cannot see the future, I have no idea. Nevertheless, as a speculator I realize that the odds are far higher for a correction in the near future than a continuing upleg. I only want to risk my hard-earned capital when the odds are wildly in my favor. This is why I am a market speculation junkie but I loathe Vegas-style gambling. In the markets I can choose to trade only when I have an excellent chance of winning. Unlike Vegas, I can command the edge, not the house.
Before we get into the specific technical charts that lead me to believe the odds donít favor the HUI long side at the moment, there are a couple more fascinating points in this first chart. Note that uplegs 2, 4, and 6 were massive, all with individual-upleg gains of greater than 100%. But between these massive uplegs were what I call consolidation uplegs, far more modest ones. Uplegs 3 and 5 only witnessed about half the gains of the big ones.
After each previous massive upleg, the HUI ground lower for 1 to 4 months and then plunged in a sharp correction. Since our latest upleg qualifies as massive too, I suspect probabilities favor a sharp correction at some point this time around as well. Sharp corrections are actually good as they drive the HUI under its baseline 200-day moving average and yield better bargains sooner for speculators and investors to snatch up. Incidentally, the first two sharp corrections (2 and 4) after massive uplegs averaged 35% which would yield a HUI target near 225 if similar events transpire this time around.
After massive uplegs top, grind lower, and then plunge, a new upleg is typically born. These new uplegs are smaller and act like consolidations. The HUI ran higher in uplegs 3 and 5 but only high enough to test its preceding highs in uplegs 2 and 4 respectively. If this precedent holds, and it very well may not since we are transitioning into a Stage Two gold bull now, HUI upleg 7 could top out around 350 too before upleg 8 arrives and blasts us to dazzling new bull-to-date highs.
Thus, not only does bull-to-date precedent indicate that a correction is likely but it also suggests that the next HUI upleg after this correction is going to be about half the size of our latest one and stall at the early February highs. Who knows if this will really happen or not, but being aware of the mere possibility of it helps properly set expectations and mitigates potential disappointment later this year. It is vastly better to have some idea of what we may be getting into than no idea at all and walking in blind with stellar expectations.
Even in light of these probabilities though, we will still have to give upleg 7 the benefit of the doubt. Secular bull markets, after all, are much more likely to surprise to the upside. Itís for this reason that I usually donít sell gold stocks outright near interim tops. I merely ratchet up their trailing stops and let the markets take me out of the trades in their own time. The 2/06 Zeal Intelligence published before this latest HUI crest explained all of this and enabled our subscribers to maximize their realized gains.
Now if the only neutral HUI technical was average upleg gains, I wouldnít be too concerned. But as the following charts outline, other key metrics are also waxing neutral. When considered in concert, all these indicators simultaneously warning of neutrality demand attention. The HUI/Gold Ratioís recent retreat is the next technical development to consider.
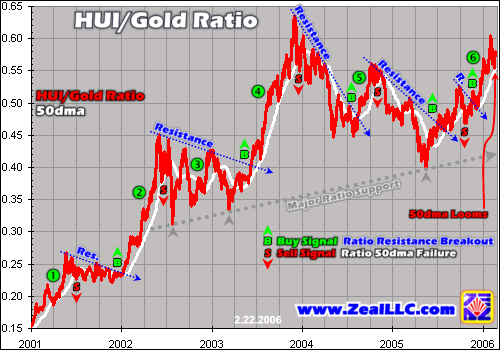
The HUI/Gold Ratio is exactly what it sounds like, the result of dividing the HUI index by the price of gold. When this ratio is rising it shows the HUI outperforming gold during an upleg. When it is falling it shows gold outperforming the HUI which usually happens during a correction. Naturally, both of these states are totally normal and expected in this bull market. The same uplegs discussed above are numbered in all these charts for easy comparison.
While this ratio doesnít provide precisely accurate buy and sell signals, it does a great job of showing the season when probabilities swing from favoring an upleg to a correction or vice versa. The last time I wrote about this ratio in mid-July a major buy signal had triggered and probabilities favored the long side. Obviously it was correct to be heavily long at the time since the HUI was only trading around 195.
But after soaring to 345 since July once again a potential sell signal looms. In this particular trading system a sell signal occurs when the ratioís 50dma fails to the downside. Previous sell signals are rendered on this chart and they almost all occurred early in a major HUI correction or consolidation. The only exception was the recent sell and subsequent buy late last year that were really anomalies the HUI whipsawed out of this indicator.
As soon as this ratio drops decisively below its 50dma it will signal a period lasting months when gold should outperform the HUI. Usually in these correction/consolidation situations the gold price is dropping too but just not as fast as the HUI, so the ratio contracts. While the HUI/Gold Ratio sell signal hasnít yet triggered as of this past Wednesday evening when these charts were finalized, it is sure flirting with its 50dma and the next sell could ignite anytime. Our subscribers have access to high-resolution versions of these charts updated weekly to monitor this important development.
Incidentally we can also glean probable HUI targets out of this chart. Note the gray major ratio support line above. Worst case in a correction the HUI will probably stay above this line, now running at 0.42 or so. Thus if gold corrects to its own 200dma, now just under $475, and the HUI falls down to its major ratio support at 0.42x this, then a potential HUI target is 200. Personally I donít think the HUI will go this low for reasons discussed below, but such an outcome is certainly possible and needs to be considered.
Eventually the gold outperformance of the HUI will run its course and the next major HUI upleg will start marching higher. Like everything else in the financial markets, periods of HUI over and underperformance relative to gold are cyclical and they flow and ebb. This next chart corroborates the neutral HUI technicals by looking at the index from a different angle, its trading volume.
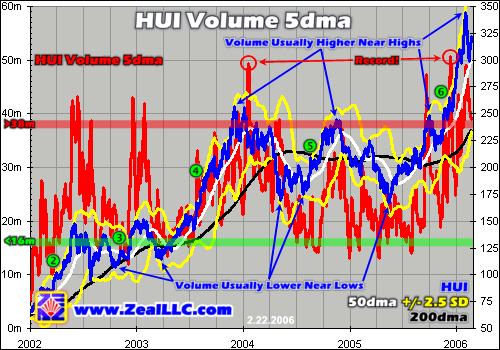
While the HUI index itself is not directly traded, its component companies are. When the individual daily volumes of its component companies are added up it creates composite volume, an accurate proxy for trading interest in the HUI as a whole. As this chart indicates, the HUI volume is generally high near interim tops when traders get excited and worked into a frenzy and low near interim bottoms when traders get discouraged and bored.
We have been smoothing out the extreme volatility in HUI composite daily volume with a 5-day moving average and then applying a HUI trading range of 16m to 38m shares. Once the 5dma of HUI volume soars over 38m shares a day, bull-to-date this index has usually been getting pretty toppy. Interestingly this relationship extends back nearly four years into 2002, it is quite well fleshed out. We also update several high-resolution HUI volume charts weekly on our website for our subscribers.
During this latest massive upleg 6, this metric shot up to all-time record highs. In addition to these stellar absolute levels, HUI volume has stayed above 38m shares on a 5dma basis for longer in the last couple months than at any other time in this entire bull to date. Volume highs, regardless of the market in which they are found, are often a sign of euphoria near tops or fear near plunges soon after these tops. Both cases are near interim highs, not the ideal time to be long.
We humans are driven by our emotions. While prudent speculators and investors strive for pure emotional neutrality, in general the majority of traders are emotional. They want to trade more when prices are surging and they are feeling wealthier. The widespread greed and excitement near interim tops is certainly easy to get caught up in. This is why volume grows during an upleg and often climaxes at or soon after major interim tops.
Conversely after a demoralizing correction traders are fed up with the game and want nothing to do with gold stocks. With traders exasperated and frustrated, trading volume withers as major interim lows are carved. It doesnít pick up again until a new upleg starts marching higher and winning converts to its potential. Volume really is a good indicator of general interest in a particular sector.
The HUI composite volume 5dma signature looks incredibly toppy today. This is the kind of activity we should expect to see around major interim tops. It suggests that probabilities now favor a correction or consolidation in the HUI moving forward rather than further acceleration of this upleg. This bias is supported by the final technical indicator I would like to discuss today, the Relative HUI or rHUI.
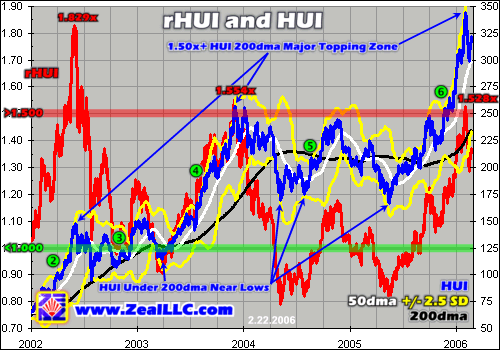
The rHUI is simply the HUI divided by its 200-day moving average. Relativity trading theory is based on the fact that bull markets soar above their baseline 200dmas in uplegs and then correct back down to or consolidate sideways to them again in corrections. Thus the time to buy is when a price is relatively low near its 200dma and the time to go neutral and ratchet up trailing stops is when a price is stretched relatively high above its 200dma.
Note above that during the previous massive uplegs 2 and 4 the HUI topped not long after the index soared more than 1.50x above its core 200dma. This suggests that the HUI is just growing far too overbought by the time it stretches 50% higher than its 200dma so a correction is highly probable to rebalance sentiment. Our latest massive upleg 6 finally crossed over this metric when it surged to 1.524x the HUIís 200dma on January 31st.
Relativity has served us really well in a variety of markets in recent years so I tend to take signals of this trading system I developed seriously. The HUI finally surging 50% beyond its 200dma late last month was the primary reason I went neutral in the 2/06 Zeal Intelligence newsletter published on the morning of February 1st. I laid out the technical scene, ratcheted up our trailing precious-metals-stock stops, and tried to prepare our subscribers to accept that probabilities now favored a HUI correction.
Per Relativity theory the HUI ought to stabilize near its 200dma after this correction, which is currently running about 235. This 200dma is where I believe we have the highest probability of seeing the HUI correction/consolidation end before a bold new upleg launches from its predecessorís ashes once again. Of course the 200dma will gradually rise in the months ahead slowly raising this probable bottoming zone.
While I realize these neutral probability tidings are certainly no fun and irritate gold-stock fans, I think it is wise to at least consider them. The markets will do whatever they want regardless of what you or I desire, so rather than fighting their inevitable flowings and ebbings I believe it is best to just accept them. Fighting the markets is futile and it just leads to big losses of capital and shattered emotional peace. Instead we should ride the markets like waves and accept that the waves wonít always be rolling in the direction we want to surf.
Actually a gold-stock correction is really not a big deal within the broader general commodities bull. While we wait for the next high-probability-for-success gold-stock buying opportunity, we are deploying into other high-potential commodities sectors in our newsletters. These new campaigns include elite oil, gas, uranium, and base-metals stocks with these trades having the potential to achieve gains on par with or superior to gold stocks.
In addition gold-stock corrections and consolidations are immensely valuable as they provide the best buying opportunities in an ongoing bull. We are painstakingly researching hundreds of gold stocks looking for the best of the best to buy and recommend the next time probabilities for success seem wildly in our favor. Please subscribe today to our acclaimed monthly newsletter and ride this awesome commodities bull with us!
The bottom line is the HUI, no matter how beloved it is in contrarian circles, has not and will not rise in a straight line. It will surge higher in flowing uplegs and yield dazzling profits and then it will just as resolutely plunge in ebbing corrections to rebalance sentiment. It is irrational to expect anything else from a secular trend.
The HUI has had a great run since May but its technicals have turned decidedly neutral. This is certainly not to say that it couldnít buck precedent and shoot above 400 now anyway, but odds are against it. And trading with the probabilities yields far greater chances for long-term success than fighting against them.
Adam Hamilton, CPA February 24, 2006 Subscribe |
|||||||
|
|
|
|
|
|
|
|
|
|
|
|
|
|
|
|||


