|
|
|||||||
|
|
|
|
|
|
|
|
|
|
|
|
|
|
|
|
|
|
|
Gas Stock Divergence Adam Hamilton July 14, 2006 3180 Words
Since the spectacular interim tops in the precious and base metals back in early May, investors and speculators have been anxiously trying to divine just how long the metals ought to correct after the mightiest uplegs of their bull markets. How deep is deep enough and how long is long enough for a major correction?
Corrections are tricky beasts by design, they usually have all kinds of unpredictable twists and turns that seduce traders into underestimating their danger. Since the only reason corrections exist is to rebalance sentiment away from the greed rampant at the preceding tops, the most effective corrections are the ones that create the most false hope to keep the most traders the most exposed to major losses.
How bad can corrections get? Pretty darned ugly! Today natural gas is the poster child for the amazing degree of raw brutality that is possible in a major correction in an ongoing secular commodities bull. Natural gas has been so relentlessly beaten up this year that even long-time gas bulls are going neutral or bearish.
After being driven stratospheric by hurricane-spawned fears of supply disruptions last year, natural gas topped at $15.41 on December 13th. But as of this week it had been pummeled all the way down to $5.15. This represents a staggering loss of 67%, in a single wicked correction, over nearly seven months! By comparison gold’s recent 22% correction over one month looks trivial.
Not surprisingly this enormous correction in gas has led to utterly devastated sentiment. This gas correction has certainly done its job by eradicating greed and bringing forth widespread doom and gloom. I have been watching gas and looking for a potential bottom for months, but a recent event really drove home just how dismal gas sentiment has become.
I am a huge fan of T. Boone Pickens, the legendary oil baron turned elite hedge-fund manager. Last year alone, calendar 2005, he personally earned somewhere around $1.4b, yes billion with a B, running his energy hedge fund! He probably knows more about the energy markets than anyone else on the planet. Whenever I get a chance to see Mr. Pickens interviewed on CNBC, I drop whatever I am doing and drink in his great wisdom. He is an outspoken bull’s bull for crude oil and believes prices will trend higher for years.
Sometime in the last few weeks, I can’t remember the exact day, Mr. Pickens was being interviewed again on CNBC so I eagerly listened. After the usual oil discussion where the CNBC folks always push him for a price prediction, the interview moved on to natural gas. When asked about gas prices, Mr. Pickens replied that he thought they would probably remain rangebound between $5 and $6 for at least the rest of this year.
I was flabbergasted and nearly fell out of my chair! Here was the most respected man in the energy sector, really the high priest of the energy bulls, and he was neutral on natural gas in the second half of 2006! When things in the gas sector get so dismal and bleak that even the notoriously bullish Boone Pickens expresses short-term neutrality, you know negative sentiment has to be about as extreme as it can get. Hearing my energy hero neutral on gas after a 67% correction was astonishing.
While Mr. Pickens is usually right and I hate to bet against him, his comments illustrate just how unloved gas has become since its December highs. When a price plunges 67% in a single correction driving despair and apathy, and even high-profile bulls wax neutral, sentiment probably cannot get much worse.
As a contrarian speculator, I live for times when everyone hates a particular sector and thinks it is destined for nothing but misery. Paradoxically when bulls are nowhere to be found anywhere, that is the best time to be bullish. The greatest gains are won by the traders who buy at very uncomfortable times out of phase with the majority. And you have to admit being long gas right now sure doesn’t feel particularly exciting!
So this week I would like to discuss gas and gas stocks. The former seems radically oversold and due for a major upleg since it is universally loathed. The stocks of the companies that produce this gas are likely to benefit tremendously if gas indeed starts rising. And these gas stocks have been exhibiting fascinating divergences this year that may prove very profitable.
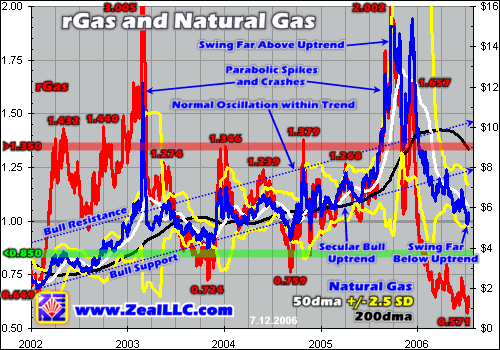
Our first chart illustrates the secular gas bull. Gas and its technicals are slaved to the right axis while Relative Gas, gas divided by its 200-day moving average, is charted on the left. I believe this chart reveals unbelievably oversold gas prices that are not likely to persist for long. The markets abhor extremes, either greed or fear, and the fear permeating gas today is overpowering and universal.
Even at today’s battered prices, natural gas’s bull market has still been very impressive. In early 2002 gas briefly closed under $2, so as of the latest interim lows of this week it was still up 160% in four-and-a-half years. For comparison the S&P 500 was only up 15% over the same time frame. In spite of today’s gas weakness, it has still been in a tremendously profitable secular bull for many years now.
For the most part, gas’s bull has gradually meandered higher within a rock-solid uptrend channel. There were times when it traded near support and times when it traded near resistance, but generally it oscillated nicely within its secular uptrend like a great pendulum. But like any pendulum to which abnormal forces are applied, sometimes short-term gas supply and demand pressures built up to such a great degree that they drove gas out of its normal uptrend.
In early 2003 gas blasted parabolic on supply scares and then collapsed just as quickly as it had soared. The interesting thing about these big extra-trend movements is they illustrate the markets’ natural tendency to seek equilibrium. Since gas had soared so high, over the next several quarters it ground lower in its longest correction of its bull market. But eventually it did find a bottom in late 2003, just under support, and its bull continued marching higher.
If a pendulum swings to the right with normal force, it will then swing back to the left with that same force. But if something forces the pendulum way farther to the right than normal, then its back swing will also be more extreme than normal. It will move much farther to the left than it typically does. Its oscillations are symmetrical. An extreme on one side of the pendulum swing creates energy that must be dissipated by a similar degree of swing to the other side.
It is not physics that drive analogous movements in the markets, but sentiment. When a price becomes radically overbought like gas above, greed among speculators grows extreme. This greed is ultimately dissipated as the price falls in a correction. After a correction goes long enough and deep enough, it eradicates all the greed from the preceding top and creates new depths of fear that are somewhat symmetrical with the earlier greed.
So when the hurricanes late last summer helped drive gas parabolic, the rapid price gains drove stratospheric levels of greed in gas speculators. As an example, I remember clearly that right as gas was challenging $14 lots of analysts were calling for $20 gas very soon. Everyone was bullish near the apex of last year’s mighty parabola, as is always the case near major interim tops. But near reversals the majority is always wrong.
Gas had swung far, far above its uptrend to radically overbought levels. While speculative fervor was able to support these prices for a short period of time, the underlying supply and demand fundamentals of gas could not even come close to supporting such levels over the long term. So as soon as speculative demand dried up, gas collapsed. With the exception of a couple anemic rallies, it has fallen almost continuously since.
Unsustainable parabolas do not only create extreme sentiment that must be rebalanced, but they distort technicals. Note above for most of the gas bull that its black 200dma line paralleled its uptrend channel, as is usually the case. But after the 2003 parabola gas’s 200dma was dragged higher in a steeper upslope than its uptrend. As this anomaly subsequently worked itself through, gas’s 200dma went flat and then negative until it once again returned to paralleling gas’s uptrend in mid-2004.
Today we are seeing the same phenomenon, albeit at a larger scale since gas’s 2005 parabola was far larger than 2003’s. Stratospheric gas prices rapidly dragged its 200dma higher until its slope was vastly steeper than gas’s secular uptrend by last December. Once gas punctured this artificially inflated 200dma early this year though and continued correcting, the 200dma flattened out. Today it is falling rapidly, running negative, and will probably eventually return to paralleling gas’s secular uptrend.
For investors and speculators using 200dma-based relative trading tools, this current anomaly in gas’s 200dma is crucial to consider. During most of gas’s bull market, with the exception of today and the period after the 2003 parabola, gas tended to carve major interim lows and bounce not too far under its 200dma. In general traders could have done well by going long when gas slid under its 200dma.
But after a 200dma is dragged way higher than normal due to a much larger than normal upleg, the 200dma is distorted out of line to the upside and fails to act as major support. Gas sliced through its inflated 200dma like a hot knife through butter near the dawn of 2006. Throwing long again early in a correction after a massive upleg just because a price hits its inflated 200dma is almost always a poor strategy.
200dma trading tools work best in orderly, trending markets and worst in highly volatile markets. Metals traders need to be aware of this tendency since the metals’ 200dmas were also dragged sharply higher recently by their latest mighty uplegs. 200dmas usually fail as support in this scenario.
The end result of all this in gas, of the sentiment pendulum swinging back towards fear and gas falling far under its usual uptrend channel, will probably prove to be an awesome buying opportunity. Gas is now trading at its lowest relative levels of its bull, 0.571x its 200dma. And if we assume that its normal 200dma trajectory should be near its lower support line as it has been for much of this bull to date, gas is still incredibly beaten down technically.
If its 200dma was at $8 today, lower support, rGas would read an abysmal 0.644x! This is not only far lower than the fantastic gas buying opportunities of late 2003 and late 2004, but it is also slightly lower than the 0.649x rGas reading in early 2002 before gas’s entire bull market began! When considered this way, gas is now the cheapest technically that it has been since even before its bull launched in early 2002. So gas looks like a great buy today in pure technical terms.
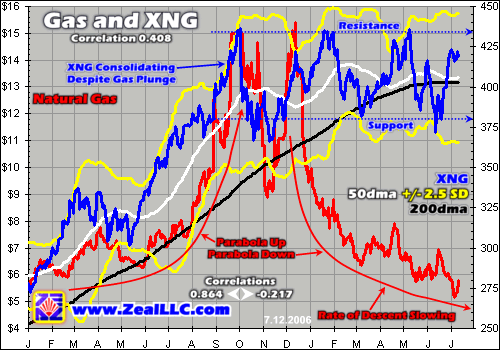
For the vast majority of investors and speculators who don’t have active futures accounts, the best way to leverage any new gas upleg is by owning the stocks of elite gas producers. The most widely followed index of gas stocks today is the XNG. Interestingly the XNG has diverged from natural gas tremendously so far in 2006, a fascinating development with all kinds of implications for traders.
Last year up until the initial peak in gas’s 2005 parabola in late September and early October, the XNG tended to follow the fortunes of gas prices fairly well. Prior to that point it was running a 0.864 correlation with gas prices on a daily closing basis. But since last October, amazingly enough, the XNG has actually been running a negative correlation with gas, -0.217! Gas stocks have consolidated despite the plunge in gas.
This phenomenon can be interpreted several different ways. Some would claim that since gas stocks have traded sideways near highs while gas plunged, they are in for a sharp fall if gas-stock investors start believing that $5 to $6 gas is here to stay. I would not dispute this thesis. If gas will indeed establish a new multi-year equilibrium under $6, gas stocks are not a good buy today.
But if gas is really oversold today and likely to rebound back up into its uptrend channel between $8 and $10 in the coming months, then gas stocks are probably bargains today. Despite the ugly Q1 and the even worse Q2, gas stocks are generally trading in the 10x to 20x earnings range. While this is more expensive than typical oil-stock valuations, it is still cheap by both general-stock-market and commodities-stock standards. Gas pushing $8 to $10 later this year would do wonders for gas profits and stock prices.
While arguments can be advanced to support both of these theses, I think the reason gas stocks have consolidated is totally different. Before I get into that, there is one more brief observation on gas I would like to make relative to this chart. Major corrections after mighty uplegs tend to be symmetrical with their preceding uplegs. In gas’s case, it ran in a parabola up and a parabola down.
The two red parabolas drawn in the chart above, interestingly, are identical. The first one is just copied and rotated 90 degrees to the right to show the parabolic descent after the surge. The reason this same parabola fits both the ascent and descent so well is because of the inherent symmetry often found in uplegs and corrections. Once again this is a key lesson for metals traders. After the biggest and sharpest metals uplegs of this bull, it is probably prudent to expect large somewhat-symmetrical corrections.
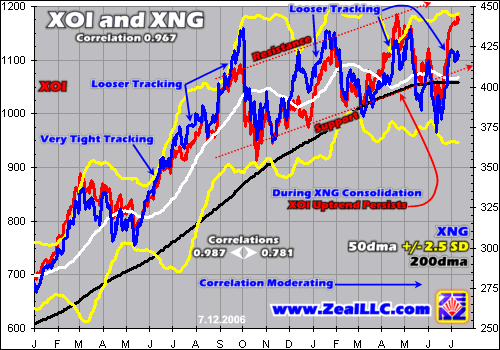
Back to the gas-stock divergence, I think gas stocks have diverged because oil stocks have been strong. Gas stocks tend to follow the oil stocks far more closely than they follow gas. So investors and speculators have probably not been keeping gas-stock prices in a high consolidation range because they are gaming higher gas prices later this year, but because they are buying and selling gas stocks at the same time they buy and sell oil stocks. The XNG is typically tightly slaved to the XOI oil-stock index regardless of the underlying gas prices.
While the overall gas/XNG correlation only ran 0.408 since early 2005, essentially uncorrelated from a trading perspective, the XOI/XNG correlation over the same period of time ran an amazing 0.967. Thus, since early 2005 only 17% of the XNG’s daily price movements were statistically explainable and predictable by gas but 94% were closely related to the XOI. For the most part as go the oil stocks, so go the gas stocks.
I say for the most part because a gas-stock divergence is developing in this usually tight relationship as well. Before the XNG peak in early October driven by the gas parabola, the XOI and XNG were running an incredible correlation of 0.987. This yielded a stellar r-square of 97.4%, practically off the charts. For most of 2005 the XNG followed the XOI in such a tight lockstep that their daily price movements were all but indistinguishable.
But since the October XNG top, the XOI/XNG correlation has dropped considerably to 0.781. So instead of 97%+ of the XNG’s daily price action being related to the XOI since October, now only 61% is related at the statistical level. This is really an enormous change that is even apparent visually. Prior to last October the tracking between these two energy-stock indexes was very tight, but it has gotten looser since as the XOI/XNG correlation has been moderating.
While the XNG has been consolidating sideways, the XOI has been powering higher since late last year in a major upleg. The XOI’s latest upleg is rendered above for comparison against the XNG’s high sideways consolidation. For some reason, gas stocks seem to be gaining a measure of independence from oil stocks and they are now trading somewhere in between the influence of oil stocks and gas. They have not been as strong as oil stocks nor as weak as gas, but are generally tracking the middle ground.
Due to the gas stocks’ new dual divergences, away from being dominated by the XOI and towards following gas a little more closely, I suspect we are looking at a fantastic opportunity to go long gas stocks this summer.
If gas is indeed ridiculously oversold and it moves back up into its secular uptrend channel, now between $8 and $10, it is going to definitely spark investor and speculator interest in great gas stocks. In this scenario the XNG and other gas stocks should be bid up to excellent gains, even above and beyond those of the XOI since gas is likely to move far higher this year than oil. While gas could easily rise 50% to $8 and stay there, odds are oil is not going up 50% to stay even if there is a geopolitical crisis.
While the consolidating and reasonably inexpensive gas stocks could enjoy lots of upside if gas enters its next upleg later this year, the gas stocks’ correlation with the oil stocks should protect them from much downside risk. Oil is expected to remain strong and gradually move higher this year, and it could spike with a crisis. Since the oil stocks follow oil, the XOI should continue trending higher which will act to support gas stocks. Thus we may be facing a rare win/win situation in gas stocks in the remainder of 2006.
We like the odds so much that we just launched a new gas-stock campaign in our latest issue of our monthly Zeal Intelligence newsletter. In it I discussed gas’s fundamentals, how hurricanes or a lack thereof are likely to affect gas, and even the recent start of a potentially highly profitable wave of mergers in the gas industry. I also recommended three smaller gas companies likely to soar as gas recovers, as well as a gas major ideally suited for long-term investors today. Please subscribe today to seize this opportunity!
The bottom line is natural gas has just been decimated since December. One of the deepest corrections I have ever seen within a secular bull has created a sentiment wasteland. Gas is now universally loathed by the majority and even hardcore energy bulls have lost their interest in it temporarily. Blood is definitely flowing in the gas streets today, the ideal time to get long when most others think it is pointless and hopeless.
At the same time, elite gas stocks are diverging from their usual behavior, becoming a little less responsive to oil stocks and a little more responsive to gas. This newfound freedom could lead to excellent gains if gas recovers as it ought to and drives interest in deploying capital into gas stocks. Therefore gas stocks look like a high-probability-for-success speculation today.
Adam Hamilton, CPA July 14, 2006 Subscribe |
|||||||
|
|
|
|
|
|
|
|
|
|
|
|
|
|
|
|||