|
|
|||||||
|
|
|
|
|
|
|
|
|
|
|
|
|
|
|
|
|
|
|
Tactical Silver Trends 2 Adam Hamilton January 7, 2005 2997 Words
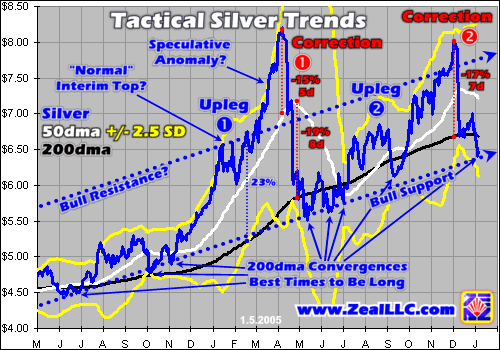
The past month has not been a happy time for silver longs, and the New Year has yet to bring any respite. After reaching its latest interim top of $8.01 on December 1st, the always-volatile speculative metal first plummeted to $6.68 in a matter of days before relentlessly grinding down to $6.41 earlier this week.
Such brutally sharp declines, while par for the course in silver, never fail to eviscerate leveraged longs. In the last few weeks I have received several e-mails from leveraged speculators lamenting about the unfortunate travails silver’s plunge put them through. Silver can multiply wealth faster than winning a lottery when it is soaring, but when it plummets it becomes a black hole for leveraged capital, virtually inescapable.
Silver has always been a challenging market to trade. Compared to gold, silver is an incredibly small market. Small markets are vastly more volatile than larger markets and popular sentiment waves lead to greatly magnified price effects. Small markets are also relatively thinly traded, so it doesn’t take a lot of speculators in the grand scheme of things to move prices dramatically. The combination of small fast-moving markets with futures leverage is a merciless double-edged sword.
But, if you are psychologically prepared and prudently protect your speculative capital, hyper-volatile markets like silver are nothing to fear. In fact, the opportunities they offer are nothing short of tremendous. If you know what to expect, if you go into silver just knowing that it will be wickedly volatile, then you can remain emotionally neutral and seize the periodic dazzling opportunities that present themselves.
While silver-investor sentiment is so rotten right now that it would make a funeral feel like Mardi Gras by comparison, I suspect silver is presenting us with another dazzling long opportunity today. As always though, it takes a lot of guts and taxes one’s contrarian psyche to be looking to throw long in the midst of the bloody carnage of our fallen fellow speculators ripped to shreds last month.
But as Baron von Rothschild wisely said the best time to buy is when there is blood in the streets. This week I would like to once again explore the current bloody tactical technical scene in silver. When the recent technical developments are combined with the amazingly dire sentiment on the white metal, odds are we are looking at one of the greatest buying opportunities in this bull to date.
Before we delve into the charts, it is important to understand why speculators have to be students of the markets. By studying silver’s past behavior, speculators can gain crucial insights into both what the metal is capable of and when probabilities are high for a move in a particular direction. Diligent students of the markets rarely if ever get flustered or upset because they know what a particular market could do before they even make a trade.
If you have been following the price action of the silver bull in the last couple years, the silver correction of the past month shouldn’t have bothered you one bit psychologically. As our first chart shows, there was nothing even remotely anomalous or unusual about the negative silver action since early December. We have seen this all before, less than a year ago in fact, and silver is just playing off of its usual volatile script. Nothing new under the sun, as the legendary King Solomon wrote in Ecclesiastes!
The key to understanding the silver action of the past month, and assessing whether or not it poses a threat or opportunity to speculators going forward, lies in seeing the correction within its proper technical context. The latest silver correction’s speed, magnitude, and relative range appear all but identical to the last major silver correction in April 2004.
Early last month, silver plummeted 17% in only 7 trading days, ripping the hearts out of leveraged longs and leading to the horrifically ugly silver sentiment we see dominating the market today. Now in any other major market such a sharp and brutally fast move would seem like Armageddon. Can you imagine the wailing and gnashing of teeth if gold fell 17% in 7 days, or even worse the S&P 500? That would be quite the scene!
But for silver, such massive and rapid moves are typical and speculators ought to learn to expect them. A quarter century ago Professor Roy Jastram wrote an outstanding book on silver called “Silver: The Restless Metal”, a perfect title. If silver has one defining characteristic, it is its extreme volatility and restlessness. Silver has always been a volatile and restless metal and it probably always will be, so speculators deciding to play in the silver arena need to steel themselves psychologically and prepare for extreme moves.
For silver, a 17% drop in 7 trading days isn’t even noteworthy! Back in April, during the last major silver correction, silver plunged 15% in 5 days. After enjoying a few serene days in the eye of the storm, it promptly plummeted another 19% in only 8 more trading days. All three of these wickedly fast corrections are marked above for easy visual comparison. Just as the double plunge in April didn’t threaten the viability of silver’s long-term bull, neither will this December specimen.
Once we can get past the initial shock at the 17% 7-day plunge last month and realize it is just par for the course for this particular highly-speculative restless metal, all the fear that grips folks who don’t diligently study the markets instantly evaporates. After all, why get worked up over a move that is little more than garden-variety average? This realization paves the way for other equally important technical observations.
Bull to date, silver has now powered higher in two major uplegs and plummeted lower in two major corrections. But over this entire multi-year timespan, silver has never materially violated its primary long-term linear support. As you can see in this chart, the bull-market support for silver is just under where silver fell to earlier this week. So not only was silver’s sharp correction typical, but its apparent bounce point is starting exactly where it ought to be as well.
In addition to being near its primary long-term support, silver has also converged with its key 200-day moving average. Bull to date there are simply no better technical times to throw long than when silver is near or slightly below its 200dma. Bull markets, including silver’s, simply always periodically flow higher and ebb lower, diverging and converging with their 200dmas over time. Once again this is absolutely nothing new in silver and we all ought to expect it.
I have written extensively about these 200dma divergences and convergences and their extraordinary importance for actively trading primary trends. In silver’s case, I wrote an essay on April 30th after its brutal double-drop correction above and correctly concluded at the time, “With extreme volatility just par for this course, odds are that April’s price collapse was just a bull-market correction leading to a fantastic buying opportunity to add new long positions in silver. Get deployed!”
About four months later silver had another mini-correction in early September. Once again sentiment grew dark and ill so I felt compelled to write. On September 10th, the day silver bottomed, my original “Tactical Silver Trends” essay concluded, “If you join me in believing that this young silver bull market remains in force for fundamental reasons as global demand continues to exceed mined supply, then there is no better time to buy than when silver trades near its lower support zones, like today. Even after its ugly slump this week, silver’s technicals look fine and remain quite bullish.”
Thankfully these earlier prognostications proved to be right on the money. It is just an ironclad mathematical law of the markets that trending primary bull markets, like silver’s, are best bought for great profits when they periodically correct and converge with their 200dmas. And as our latest charts reveal this week, from all appearances silver looks to be staging for another one of those incredibly compelling major buy opportunities today.
Thus, from my perspective as an active silver speculator and a student of the markets, nothing atypical or concerning has transpired. Silver rallied strongly, then it corrected sharply in line with precedent, and now it is back down near major support just begging contrarians to buy it before the majority of investors figure this all out. Rather than getting upset and succumbing to the terribly negative sentiment on the forums, the key to shrugging this correction off is understanding it within its true technical context.
Our second chart below digs deeper into silver’s current position relative to its 200dma, but before that there is one other crucial issue on our first chart that needs to be addressed. At the end of its first major upleg silver topped at $8.20 on April 6th. But at the end of its second upleg silver topped at $8.01 on December 1st. These descending interim tops are causing a lot of angst even among seasoned technicians.
If silver cannot even exceed its original interim top, does that mean its bull market is over? I have received quite a few e-mails agonizing over this technical development, and wondering how it ought to be interpreted. The short answer is it is not silver’s price that drives its long-term bull, but its supply and demand fundamentals. As long as global silver demand exceeds mined silver supply, its long-term uptrend will continue regardless of temporary price extremes that don’t fit into nice tidy patterns. And silver demand has exceeded mined supply for decades now.
Technically, I believe the anomaly was not the lower interim high of December, but the parabolic spike of Q1 2004. If you look carefully at the chart above, silver looked like it was topping in January 2004. It had a parabolic ascent, broke way above old resistance, and struggled around $6.50 for over a month, clear topping signs. At the time I thought silver was due for a temporary correction, but I held onto our long positions and recommended the same since bull market surprises are usually to the upside. We diligently use trailing stops to allow us to stay long for as long as possible while still providing ample protection from a correction.
Then, suddenly in February, silver just erupted and streaked towards the heavens. It rocketed up in an ever-accelerating slope, a parabola, blasting from $6.50 to well over $8.00 in a little over a month. The speculative fervor surrounding this particular spike was incredible. Such a buying frenzy, even though small by silver’s immense historical standards, still demanded caution. When silver topped at $8.20 on April 6th analysts and investors were eagerly looking for $10 by May. The greed was phenomenal.
Like most manias, large or small, it is not obvious exactly why this little silver frenzy ignited. But it had all the hallmarks of a mini-mania and called for extreme caution. If you lop off that huge March 2004 spike on the chart above as a speculative anomaly, you are left with a nice tight bull-market uptrend. As a matter of fact, if silver had fallen back from $6.50 in February as it should have without the speculative anomaly, it would have fallen about 23% to its 200dma. This is right in line with the 17% correction we saw in December.
And if the speculative anomaly of March 2004 is ignored, silver’s first major interim top would have been near $6.50 in February while its second exceeded $8.00 in December. Of course this pattern, if it had happened, would have led to wonderful warm and fuzzy feelings in silver technicians worldwide. But when the speculative anomaly is taken too seriously, indeed silver has carved descending tops. I am not at all worried about this though since I suspect the speculative anomaly caused the first top to be “too high” relative to trend, laying the foundation for today’s great technical unease.
Now the obvious corollary to buying on 200dma convergences is selling on extreme 200dma divergences. The farther silver stretches away from its anchoring 200dma, the higher the probability that a correction is imminent. Three days before the April top in our 4/04 Zeal Intelligence newsletter I wrote to our subscribers…
“Stretched 42% above its 200dma bull-market support, a major correction is due in silver. It makes no sense to buy silver stocks or physical silver today. A typical bull-market pullback would drag the metal back down near its 200dma, and I am sure that silver stocks would be hit hard in a silver retreat back down under $6.”
Speculation is certainly not rocket science friends, it is just using the typical behavior of silver, and of bull markets, to help us define high-probability-for-success moments to trade. If you want to go long, odds are you will reap the highest rewards by patiently waiting until silver converges with its 200dma like today. If you want to throw short, your odds of success increase the greater the distance that silver diverges above its 200dma. Relative 200dma trading is simple and effective.
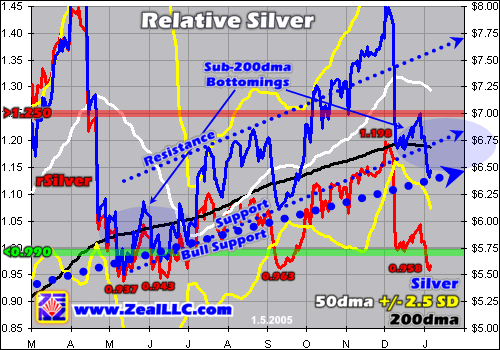
Our final chart zooms in to just the period of silver’s second major upleg and correction, since May. In addition to silver prices, it also shows Relative Silver in red, or the silver price divided by its 200dma. This expresses silver as a constant multiple of its 200dma over time enabling us to easily compare relative extremes. I have explained this Relativity theory in depth in past essays if it is new to you.
Relative Silver (rSilver) also shows the white metal to be a strong buy today, solidly corroborating the conventional technical analysis above.
We have been watching an rSilver range of interest from 0.99 to 1.25. When rSilver is near or under 0.99 it is a high-probability-for-success moment to go long, and when it is near or over 1.25 it is a high-probability-for-success moment to throw short or at least go neutral. Even in just the past 8 months or so silver has been remarkably consistent in rallying strongly once it falls just under its key 200dma. The sub-200dma bottoming zones are rendered above as transparent blue ovals.
In relative terms, silver fell to 0.937x its 200dma in May, 0.943x in June, 0.963x in September, and now 0.958x today in January. As you can see with the red line rendered above, silver tended to rally rather sharply once it fell 4% to 6% under its key 200-day moving average. As long as silver’s bull market remains intact as it should be for core fundamental supply and demand reasons, then today’s 0.958 rSilver reading ought to prove just as bullish and profitable as its predecessors’ strong buy signals.
Now on the topside rSilver’s 1.198 apex in early December near its second major interim top didn’t even approach the massive 1.448 that silver witnessed in early April at its first major interim top. I realize this also bothers some folks, but once again I suspect the reason is the speculative anomaly of March 2004. Without that strange surge in speculative fervor at what probably would have been an interim top, April’s extreme rSilver reading wouldn’t have been anywhere near as high.
And major topping levels are nowhere near as inherently predictable as major bottoming levels anyway. While 200dma convergences are very obvious, like today’s, 200dma divergences at the end of uplegs can run all over the map in extent. As such, it is best to buy low near major 200dma convergences and just run trailing stops so you don’t have to worry about selling. The stops will enable you to ride bullish uplegs as long as possible but still sell you out sans emotional angst when the inevitable subsequent corrections finally arrive.
The bottom line is silver looks fantastic today technically. While its sharp December correction nuked sentiment and slaughtered some leveraged longs, the restless white metal really didn’t do anything out of the ordinary technically. Silver is behaving just as it ought to and there is nothing to fear.
As usual, we are starting to scale in our own trades for this next expected major silver upleg, the third of this bull market to date. In the shiny new January issue of our acclaimed Zeal Intelligence newsletter just published, I discussed and recommended two new silver-stock trades. Both companies have excellent prospects in the next silver upleg, and one in particular is a small junior with staggering 10x+ gains potential if this silver bull continues to march higher in the years ahead.
Both of these stocks are being mercilessly hammered now, blood is flowing in the streets, so you might not have another equally stellar opportunity to consider adding them to your portfolio. Please subscribe today before silver rallies and this amazing long opportunity evaporates. I am also planning on layering in more silver-stock positions in the months ahead as silver confirms this third-major-upleg thesis.
Brand new e-mail PDF-edition subscribers will receive a complimentary copy of this just-published January newsletter. In addition, in our exclusive subscriber-only charts section of our website we have a huge rSilver chart similar to the one above that we update at least weekly for our subscribers. You can watch this silver bull unfold as a fellow student of the markets and keep considering silver’s moves within their proper technical context in order to remain emotionally neutral.
As Rothschild famously said, the best time to buy is when blood is flowing in the streets. If you listen to the eviscerated leveraged silver longs and the dreadfully negative Internet forums, you would think there is more blood in the silver markets right now than in the Revelation account of Armageddon.
While December’s correction was sharp and harsh, it was merely garden-variety typical for silver. If silver remains in a long-term bull market for fundamental supply-and-demand reasons, then there is no better time to throw long than when it falls to or under its 200dma, like today. Carpe diem silver speculators!
Adam Hamilton, CPA January 7, 2005 Subscribe |
|||||||
|
|
|
|
|
|
|
|
|
|
|
|
|
|
|
|||