|
|
|||||||
|
|
|
|
|
|
|
|
|
|
|
|
|
|
|
|
|
|
|
Synthetic HUI Options 2 Adam Hamilton August 13, 2004 3955 Words
In last month’s “Synthetic HUI Options” I argued that today’s formal HUI options market is so woefully underdeveloped that superior substitutes are necessary for precious-metals speculators interested in trading HUI options.
The thesis I advanced advocated using options on the largest individual component stocks of the HUI unhedged gold-stock index as synthetic HUI options. Today’s largest HUI component stock, Newmont Mining, took the top honor of trading the most like the HUI it dominates. I concluded that trading options on NEM stock was effectively the same thing as trading HUI synthetics with a 90%ish effectiveness.
My first essay only considered the precision with which NEM tracked the HUI over the most recent gold-stock upleg and correction, together running from March 2003 to May 2004. Interestingly, however, the HUI in its fantastic young bull to date has already witnessed no less than four major uplegs and four major corrections. So, at best the original analysis only covered about a quarter of our gold-stock bull to date.
To truly understand HUI synthetics, we really need to consider this entire bull market and not just its most recent upleg and correction. Over the life of any bull market different forces drive it and different component companies assume the lead at various times in pulling a sector index like the HUI higher. After we examine the viability of HUI synthetic options over this entire bull to date, we will have a much better idea on how well this theory really worked in the past and whether or not it ought to continue working in the future.
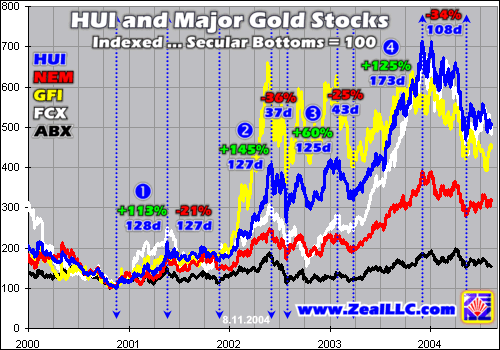
The three largest component companies of the HUI are currently Newmont Mining (NEM), Gold Fields (GFI), and Freeport McMoran Copper & Gold (FCX). NEM accounts for 16.1% of the index by market capitalization, GFI 15.9%, and FCX 10.3%. Together these three behemoths utterly dominate this small 15-company index by collectively commanding 42.3% of its entire market share! In my original essay I discussed each of these three elite gold miners.
In addition to being the largest HUI component wielding the most influence on the index, NEM already has a thriving and highly-liquid options market. As a pure American gold play, NEM also avoids the primary weaknesses of its next two largest competitors. NEM is not adversely affected by the US dollar weakness to the extreme degree of GFI which is based out of South Africa. NEM also does not derive more than half of its revenue from non-gold operations like FCX.
While NEM won the competition as the most HUI-like stock, I still wanted to compare how all of these HUI Big Three companies performed over this entire gold bull to date. The HUI, NEM, GFI, and FCX are all graphed below. In order to make these data series perfectly comparable, we indexed them setting their base values equal to 100 at their respective late 2000 secular bear lows. At 100 they are equal to their lows, at 200 they have appreciated 100% from their lows, at 300 they have tripled from those lows, etc.
These graphs are also divided up into sections denoting the four major uplegs and the four major corrections that the HUI has witnessed in its bull to date. Major uplegs are numbered, and the percentage gain or loss of the HUI during each major short-term trend is annotated on the graph. The numbers under the percentage figures record the number of trading days that each individual upleg or correction took to fully run its course.
Finally, since I still receive questions about hedging gold mines versus non-hedging gold mines, we included the world’s largest hedger Barrick Gold (ABX) in this graph as well. ABX is not included in the HUI because it does hedge, or lock in future selling prices for its gold today. Since hedgers sell away their upside profits to speculators, their performance lags that of unhedged companies dramatically during a gold bull.
This indexed graph really highlights the massive and nearly catastrophic costs of hedging to the shareholders of hedging companies during major bull markets in gold. Owning a company that sells away its upside during a gold bull is foolish at best and negligent at worst. Professional fund managers owning large hedgers are really shooting themselves in the feet and hurting their clients by holding hedgers when gold prices are rising.
The bottom-feeding black ABX line shows the great folly inherent in locking in future gold prices during a bull market. At best Barrick has merely doubled over the past several years compared to massive gains running from 4x to 7x for the three major miners dominating the HUI. While this essay is not about hedging, this indexed gold-bull-to-date graph really drives home the enormous opportunity costs borne by shareholders in hedging companies.
Back to the HUI synthetics, it is really intriguing how the big three have shifted leadership positions like horses in a horse race at various times in the HUI’s bull market. In the first major upleg, the 113% move off rock-bottom lows noted above, it was actually FCX the copper company that dominated. It more than doubled with a 152% gain by early 2001 while NEM and GFI lagged behind at +86% and +107% respectively.
In the HUI’s second major upleg, South African giant Gold Fields blew everything else out of the water by skyrocketing above 6.5x its secular bear lows of late 2000. While GFI used to be one of my personal favorites and long-term recommendations, I quit recommending SA golds in the summer of 2002. After realizing 158% gains in Gold Fields and 372% in the smaller Durban Roodepoort Deep, in the July 2002 issue of our Zeal Intelligence newsletter I sadly suspended SA recommendations on geopolitical concerns.
The South African ruling African National Congress government, which is openly Marxist and has long officially partnered with the South African Communist Party in the Tripartite Alliance, is becoming more and more aggressive and surly regarding capitalism. Two years ago it announced that it would be forcing South African mining operations to ensure that large percentages of ownership are eventually transferred to black owners through “empowerment targets”, essentially racial quotas.
A leaked internal ANC government document in July 2002 suggested that mines should be forced to surrender 30% of their assets to black investors or face outright nationalization. This terrifying document also said that 51%+ of new mining ventures should be owned by blacks within a decade. Naturally this created a firestorm of controversy internationally and the Marxists quickly backed down publicly, but they are still pursuing these twisted agendas advocating stealing from capitalists and giving to others as bribes for votes.
Most capitalists start out poor as well and work long and hard to build their fortunes, so these investors have no desire whatsoever to see criminal governments like South Africa’s steal from the productive to subsidize the lazy. The ANC’s increasingly belligerent attitudes towards capitalists have done immense damage to the once universally admired South African mining sector. GFI, South Africa’s flagship mining operation, has yet to fully recover from the massive geopolitical damage done by the institutionalized pro-black racism permeating the ruling ANC government.
In addition to the madness of Marxism and the always percolating threat of confiscation of mines in South Africa today, the SA mines have also been badly hurt by the ongoing US dollar bear. As the dollar has slumped, the competing rand has soared. The SA mines essentially sell their gold for dollars, but pay their costs in rand. Thus their revenues are not rising dramatically but their costs in local-currency terms are much higher squeezing their profits.
Because of its sad misfortune of suffering under a Marxist government along with the ongoing dollar/rand currency concerns, GFI is not an ideal candidate for the HUI synthetics today. Its performance during the second major HUI upleg was phenomenal, but it has ground sideways to lower ever since. GFI remains a fantastic company and I am personally looking forward to getting back into SA mines once the ruling Marxist criminals of the ANC are run out of the country and the US dollar bear runs its course.
Freeport McMoran’s performance relative to the HUI has flowed and ebbed as well. In the first and fourth major uplegs above it dominated the other Big Three HUI stocks. Its most stunning rally in 2003 was driven by a massive rally in copper. Over half of FCX’s revenue is derived from copper mining operations, and much of its gold production is a byproduct of extracting copper.
While FCX is certainly a great mining company, it trades far more like a copper miner than a gold miner, as it should with the majority of its sales from copper. If copper prices were to halve in the next year but gold prices doubled, for example, I am almost certain that FCX would fall and start acting as an anchor on the HUI’s performance. I am one of the HUI purists that believe that a primary copper miner has no place in an index designed to track the fortunes of unhedged primary gold and silver miners.
So while FCX soared during last year’s major HUI upleg as copper prices fortuitously rocketed higher along with rising gold prices, it doesn’t make much sense to use FCX options for HUI synthetics. Speculators looking to trade HUI options or close substitutes are looking for leverage to the bull markets in gold and silver, not the broader general commodities bull. Since copper is not a precious metal that has been long sought by private investors, its supply and demand dynamics are vastly different than those of gold or silver.
With GFI’s Marxist local government and forex problems and FCX’s trading dominated by copper movements, this once again leaves Newmont Mining. Even though GFI and FCX have outperformed NEM during various uplegs in this bull market to date, NEM still remains the most HUI-like in its overall trading profile.
NEM has risen continuously in every major HUI upleg to date. It has not surged prematurely and then ground sideways for years like GFI nor has it ground sideways for years and then surged like FCX. NEM isn’t the flashiest company, but it is the bluest of the blue-chip unhedged gold miners. Like the old parable of the tortoise and the hare, NEM just keeps chugging along and relentlessly marching higher upleg after upleg.
And since it doesn’t have geopolitical or currency problems and depends on no other underlying commodity than gold, I believe that NEM has the best chance of finishing this long-term race on top. Out of all three of the large HUI component companies that dominate the index, NEM is the purest gold miner with the fewest non-gold-related risks and complications. It is certainly not a perfect HUI substitute, but it is definitely the closest HUI substitute with a thriving options market today.
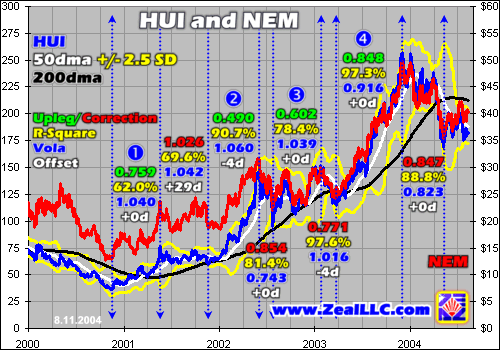
If you look at the first graph above NEM lagged both GFI and FCX in bull-to-date performance terms. As this next non-indexed conventional chart of just NEM and the HUI reveals however, the indexed chart above doesn’t tell the whole NEM story. NEM only traded as high as 4x its bear-market bottom price in late 2003 primarily because it never went as low as GFI and FCX. The lower a particular stock trades at its bottom, the larger its raw percentage gains become over time due to the underlying math of launching a new bull run off of low numbers.
Our second chart is zeroed and non-indexed and reveals that NEM has tracked the entire HUI bull market to date exceptionally well. The same four major uplegs and four major corrections shown above are drawn in here too. Each of these important tactical episodes has four numbers attached that outline NEM’s performance relative to that of the HUI’s. All of these numbers look confusing, but they are really simple and help us determine just how likely NEM options are to act as valid HUI synthetic options in the future.
Please take a look at the actual NEM and HUI bull-to-date lines in this graph from a pure visual perspective first, comparing the geometry of the uplegs and corrections in NEM and the HUI. The ups and downs in NEM really do track those of the HUI rather well in its bull to date. After you have digested this graph visually, I will explain what all these numbers are telling us regarding using NEM options as HUI synthetics.
The first most important requirement of using NEM options as a substitute for HUI options is that NEM closely tracks the HUI’s price movements. As this graph reveals, in the HUI’s entire bull to date the NEM price has followed the HUI’s major movements, entire uplegs and corrections, nearly perfectly. And it has even conveniently mirrored the vast majority of the HUI’s short-term multi-week gyrations!
Almost without exception when the HUI is up NEM is up and vice versa. This is very important because HUI speculators using NEM options will be betting on major moves in the HUI via NEM calls and puts. Since the NEM price has so closely tracked that of the HUI’s visually over the past four years or so, odds are it will continue to closely track the HUI’s price in the future. So speculators can buy NEM calls when the HUI is due for an upleg and NEM puts when it is due for a correction.
This eyeball visual comparison is certainly important and greatly buttresses the NEM options as HUI synthetics theory, but we really can’t know exactly how close NEM has tracked the HUI without statistical analysis. In every major upleg and correction above, four numbers are noted which statistically quantify the degree to which NEM actually mirrors the behavior of the HUI. Each affects the pricing of NEM options and hence their degree of usefulness as profitably tradable HUI proxies.
The first number during each major upleg or correction, drawn in green or red above, outlines NEM’s relative gain or loss as compared to the HUI’s. For example, in the first major upleg labeled 1, NEM moved 0.759x as far as the HUI itself did. During this upleg the HUI ran up 113% in early 2001, so the 0.759 NEM reading translates into an 86% gain for NEM. In the first correction, the red 1.026 reading means that NEM fell 1.026x as far as the HUI in the second half of 2001.
These total overall swings of NEM are very important for NEM options pricing. In order for us speculators to buy NEM options, someone else has to be willing to sell them to us. These options writers assume potentially unlimited risk so they are very careful with pricing their options. The farther an underlying security tends to move, the greater their perceived risk. Options will be far more expensive for a stock that has a 100% trading range over the past year as compared to one that has only oscillated 10%.
In NEM’s case, it tends to move less than the HUI. This tendency makes perfect sense since NEM is the ultimate unhedged blue-chip gold and far less risky than all of the smaller companies in the HUI. It is not as speculative as the smaller components and doesn’t move as far. Actually this is good for options pricing though, as the larger that NEM’s average upleg and correction movements are, the more expensive its options will be.
During all four major uplegs, NEM averaged gains of 0.675x those of the HUI, about 2/3rd. This number isn’t particularly bad although it is a little lower than I would like to see it. In comparison in upleg 4 discussed in the original “Synthetic HUI Options” NEM ran 0.848x as far as the HUI, much better. For options traders this means that we won’t get as much raw leverage via NEM options as we would via the HUI, but on the bright side the NEM options should be significantly cheaper than true HUI options would be.
During the four major corrections, NEM averaged losses of 0.875x those of the HUI. Thus, NEM HUI synthetics offer more bang for the buck as puts during corrections than as calls during uplegs. Actually this is great news though, as one of the major drawing points of HUI synthetic options is the ability of gold-stock speculators to use them to profit even through the periodic HUI corrections. Speculators can own leveraged gold stocks outright during uplegs but sell them and buy NEM puts to continue earning money when a correction is due.
The average major NEM move over all eight major uplegs and corrections ran 0.775x that of the HUI. Thus, in terms of big swings NEM options have been running almost 78% effectiveness as synthetic HUI options in this entire bull to date. This really isn’t too bad in absolute terms and is actually outstanding when you consider that there are really not any viable and highly-liquid alternatives to the NEM options for riding major gold-stock uplegs and corrections today.
The second number, drawn in yellow, is the R-Square value for each major move. R-Square of course is the NEM and HUI correlation coefficient squared that statistically explains how much the movement in the HUI explained the movement in NEM and vice versa during a given major upleg or correction. Naturally the higher the better for options traders in HUI synthetic terms.
During all four major uplegs, the average R-Square ran 82.1%. During the four major corrections it ran 84.4%. Over the entire bull to date, the average major-move R-Square weighed in at 83.2%. These numbers aren’t stellar, but they are still quite high and indicate a very strong statistical relationship between NEM and the HUI. With 83% or so of NEM’s daily price movements directly explainable by the HUI’s, it makes a fine HUI substitute over the entire bull to date.
I also find it very interesting that the R-Square numbers seem to be generally rising over time, with the correlation of NEM and the HUI growing stronger during recent major moves. If this trend continues it is a good omen suggesting that NEM and the HUI will continue to trade in lockstep in future uplegs and corrections.
The third number above, drawn in blue, represents the degree to which NEM’s average absolute interday volatility compares to the HUI’s. In the first upleg, the 1.040 reading indicates that NEM was 1.04x as volatile as the HUI on average on a day-to-day basis during this particular upleg. The closer this number gets to 1.00 the better since volatility is a very important ingredient for options pricing.
Options writers selling options to speculators face increasing risks with increasing volatility. The more volatile an underlying security, the higher the probability that they will face exercise on their written options. Everything else being equal, the higher the volatility profile of a stock the more expensive its options generally cost. For example, if NEM was twice as volatile as the HUI on average, its options would be much more expensive than true HUI options. If this was the case it would sink the whole synthetic HUI options thesis since NEM options would be too expensive relative to their potential returns.
Thankfully though, NEM volatility follows that of the HUI’s amazingly closely! It averaged 1.014x that of the HUI’s during uplegs, 0.906x the HUI’s during corrections, and 0.960x overall. This is great news for speculators that means that NEM options should be priced very similarly to what actual HUI options would be. With NEM’s bull-to-date volatility profile running at 96% or so of the HUI’s itself NEM and the HUI are practically identical in volatility terms.
The final number, drawn in white, is the offset. It records the number of days between an interim HUI top or bottom and the corresponding interim NEM top or bottom. If the HUI tops today, for example, and NEM tops three days from now, it would be an offset of +3 days. If NEM topped 4 days ago while the HUI tops today, the offset would be -4 days. Obviously we want major NEM interim tops and bottoms as close as possible to actual HUI turning points for trading purposes.
During uplegs, the average NEM offset was -1 day, just about perfect. And three of these offsets were actually on day zero which means that NEM topped on the very same day that the HUI did. During corrections this average offset swelled to +6 days but this was totally due to one anomaly in late 2001 when NEM carved a slightly lower low 29 days after the HUI bottomed. If this rare situation is ignored, the average offset is nearly perfect on corrections as well.
Overall the average offset for major interim tops and bottoms was only +3 days or so, and if that weird 29-day situation is left out it falls down to merely -1 day. Thus, HUI speculators buying NEM options can be fairly certain that major turning points in the HUI itself will be accurately reflected in NEM within only a few days on the outside. This makes it far easier to coordinate NEM options trades with major uplegs and corrections in the HUI.
In summary, even in this entire HUI bull to date NEM options appear to be excellent synthetic HUI options. NEM’s eight major swings since late 2000 have averaged about 78% of the distance of the HUI’s, largely due to its considerably lower risk as the ultimate unhedged blue-chip gold. The R-Square correlation of these moves was 83% on average, which is quite high over nearly four years.
From the volatility-profile perspective absolutely crucial to options pricing, NEM has run at 96% of the HUI’s average absolute interday volatility for its entire bull to date. This means that the pricing on the highly liquid NEM options should be nearly identical to what true exchange-traded HUI options ought to be. And to top this all off, NEM tends to top and bottom within a few days of the HUI so the synchronization of major uplegs and corrections is outstanding.
Thus, even when we expand our synthetic HUI options inquiry to include the entire bull market in gold stocks to date, NEM continues to shine as the best available current proxy for HUI options. Speculators wanting to leverage major uplegs and corrections in the HUI should consider deploying NEM calls and puts as appropriate.
In both our Zeal Intelligence monthly newsletter and Zeal Speculator e-mail alert/update service I have been layering in NEM options as HUI synthetics all summer. The idea behind these trades for our subscribers is that the fourth major correction in the HUI ended in early May and hence the fifth major upleg is already gathering steam. And I have high expectations for this next upleg since the first four averaged +111% each!
Now since NEM has tended to track these major uplegs at 78% efficiency bull to date, NEM stock itself could witness a gain in the 85%+ range. If this indeed comes to pass and transpires before expiration on the majority of our NEM options contracts, multiple gains of hundreds of percent will be achieved.
If you are interested in seeing which particular options contracts I am layering in and knowing when I buy or sell more NEM options as HUI synthetics in the future, please consider subscribing today and supporting our research work at Zeal.
The bottom line is even over this entire bull market in the HUI to date, Newmont stock has done a fine job of tracking this flagship gold-stock index. Thus, the highly-liquid and extremely-easy-to-trade NEM options chains effectively form the best synthetic HUI options available today.
Adam Hamilton, CPA August 13, 2004 Subscribe |
|||||||
|
|
|
|
|
|
|
|
|
|
|
|
|
|
|
|||