|
|
|||||||
|
|
|
|
|
|
|
|
|
|
|
|
|
|
|
|
|
|
|
Trading the Relative VIX Adam Hamilton April 18, 2003 3147 Words
The always fascinating US stock markets continued to puzzle and perplex this week, rendering pretty much every investor and speculator uncomfortable. It doesn’t matter whether you are playing long, short, or out at the moment, odds are the stock markets’ recent action isn’t making you very happy.
For those bulls playing long, their general sense of unease is growing daily. Washington apparently successfully annexed Iraq without any worst-case scenarios erupting, thanks to the phenomenal work of our awesome professional American warriors, yet the major indices still steadfastly refuse to rally to new interim highs.
For months and months now the bulls have thought that the war uncertainty was holding back the stock markets, and now that this Iraq cloud is rapidly lifting, they are not happy with the lackluster trading action. On Tuesday the elite NASDAQ 100 bellwethers Microsoft and Intel both beat earnings expectations yet the S&P 500 and Dow 30 fell the next day, adding to the growing bullish worries that something is very wrong in these markets.
For my fellow bears joining me on the short side, the essentially sideways trading action since the latest November interim market highs has been excruciating. Yes, the powerful Great Bear downtrend still dominates and each subsequent mini-bear rally leads to lower highs, but the markets have proven stubbornly resilient, especially since the euphoric war rally. It seems like a long way down to the October lows from here.
A bearish speculator friend of mine who has also been anxiously watching his deployed shorts hemorrhage summed it up nicely in an e-mail to me this morning. He said, “For some reason, I am instantly reminded of the medieval ‘rack’ torture--where the hapless victim is bound hand and foot, then slowly and very painfully stretched to the point of structural failure. Ugh!” The bears are at least as nervous as the bulls these days, and maybe even more so.
If both the bulls and bears are struggling, one would think that being out for now waiting on the sidelines would be the place to be. Interestingly though, the professional speculators I know sitting in cash and waiting for some cues to throw either long or short are not too happy themselves right now.
The sidelined players share my gut feeling that we are nearing a major inflection point when the markets break out in a big way to the upside or downside. The big question, as always, is which way will the break go? The unnaturally calm volatility so far in April just doesn’t feel right and odds are the markets will not trade sideways for too much longer.
I don’t remember many times when all three camps, the longs, the shorts, and the outs, all felt uncomfortable and nervous at the same moment. I suspect that lots of players share my feeling that a big move is coming, and powerful arguments in favor of an accelerating rally (either of the bear-market type or an entirely new bull) and in favor of a waterfall decline both coexist and thrive today.
As I zealously try to sort out this puzzling scene myself, my focus keeps returning to volatility. After countless hours spent researching and writing about volatility in the past years, I continue to marvel at just how important volatility truly is in the grand scheme of things.
With both the VIX and the VXN implied volatility indices dropping to new interim lows this week, we decided to look again at implied volatility to search for more clues about what lies ahead over the visible horizon. After painstakingly analyzing about two-dozen different charts of these two indices, two VIX charts ended up making the cut for this essay.
One you are very familiar with and one is quite new and unique. Our first graph this week simply shows the usual-suspect absolute VIX, which has some known measurement issues since its baseline constantly changes. Our second graph attempts to address these known VIX issues by converting the absolute VIX into a Relative VIX. The conclusions drawn from this mathematical exercise were quite interesting and may prove very valuable for speculators.
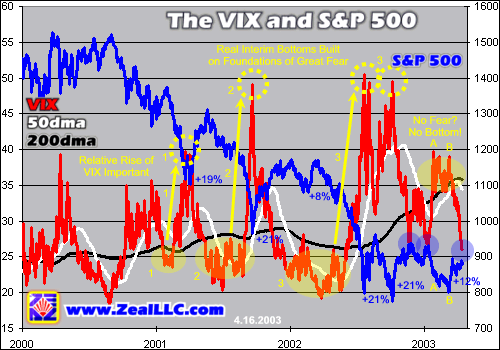
This first baseline absolute VIX graph is modified from my “War Rally Euphoria” essay of a few weeks ago. It provides the necessary foundation off of which we can launch to delve into the new Relative VIX arena.
The VIX’s popular renown as one of the ultimate gauges of general fear in the US stock markets is certainly well deserved. Major VIX spikes, betraying widespread fear gripping investors and speculators, inevitably mark major tradable interim bottoms in the S&P 500. Interestingly, this fantastic VIX property holds true in both long-term secular bull and bear markets, as the long-term VIX and S&P 500 graph in “VIX Bounces S&P 500” illustrated.
While it flags interim market bottoms with great precision, the VIX is much more ambiguous in clearly marking major interim tops. A low VIX in the 20s certainly signals the lack of fear, or state of general complacency, which is a necessary precursor to any major downleg, but it doesn’t seem to mark tops accurately enough for active speculators.
Because of this weakness, we replaced the VIX with the 21-day moving average of the Put/Call Ratio as our primary shorting signal in our grand index-speculation plan for 2003. Interestingly, this PCR 21dma is currently signaling for speculators to short aggressively which strongly suggests that our next big index move will be down. There is a graph of the PCR 21dma and S&P 500 in “War Rally Euphoria” if you wish to check it out for yourself.
Back to the VIX, while no doubt extremely valuable, it still presents some serious challenges to active speculators. For example, what absolute VIX level should speculators today consider as really low, indicating extreme complacency and the time to short, or really high, indicating extreme fear and the time to throw long?
In the mid-1990s a VIX level of 10 was low. As the US equity bubble ballooned beginning in 1996, a VIX reading around 20 was low. This 20ish low level has also held up fairly well since the bubble burst and the Great Bear began in 2000, which is evident on the graph above. But, in a recent development that confounded many speculators, the VIX refused to fall under 26 in late November 2002 when the latest major US stock-market highs were carved. What VIX reading is “low” today?
Really high VIX levels are also the subject of much debate. As the graph above shows, a VIX 50ish level has been high in this bear market to date. VIX 50ish spikes were also witnessed during the frightening Long-Term Capital Management disaster of 1998, farther cementing VIX 50 in the minds of many speculators, including me, as the definitive level of great fear.
But, once again, strange recent VIX action is threatening this worldview. At point “A” in the graph above, marking a plunging S&P 500 in late January, a VIX level of 40 failed to mark a major low. This was obviously not a major low in hindsight because the markets continued to fall even farther into point “B”, the most recent mid-March low before the sharp war rally launched.
If you contrast this with the first major V-bounce of this Great Bear which happened in April 2001 (marked as VIX spike “1” above), it presents some problems. In April 2001 a VIX level of 40 marked a major bottom, but in January 2003 the exact same VIX 40 level didn’t witness anywhere near enough fear to mark a major bottom since a lower low followed within six weeks or so. So is VIX 40 low or high now, a time to throw long or a time to stay short?
I think that some of the confusion regarding just what levels of the VIX should be considered as excellent tradable signals today revolves around the inherent weaknesses of the absolute VIX. As I discussed in “The Bust and the VIX”, general volatility tends to rise throughout major bear-market busts following supercycle bubbles. As volatility rises, the baseline from which measurements are taken changes. Our fear yardstick is moving on us!
In the graph above, the 200-day and 50-day moving averages of the VIX clearly illustrate this point. Since the bubble top in 2000, both the VIX’s 200dma and 50dma have been carving notable uptrends. If these moving averages tended to stay flat over the long-term, it would be much easier to use the absolute VIX to time the major stock-market swings.
The VIX is most useful when it measures extremes, either very high volatility marking enormous fear or very low volatility signaling widespread greed. Over time, the equity markets oscillate based on the ever-shifting emotions of greed and fear, perpetually bouncing from popular greed to popular fear and back. These short-term emotional sentiment waves are what drive the major bear rallies and downlegs shown above in the S&P 500.
If we speculators could visualize the VIX as sentiment waves endlessly oscillating around some relative baseline, it could make the index easier to interpret. Looking at the graph above, the most obvious candidate for a baseline is the index’s own 200-day moving average.
The black 200dma does rise over time with rising general volatility, so it is a baseline that accurately reflects the underlying major trend of the VIX. In addition, since a 200dma covers about 80% of a single year’s worth of trading, the VIX’s 200dma moves slowly enough to avoid being buffeted too much by the short-term VIX extremes. In general, 200dmas tend to accurately reflect and parallel long-term technical trend channels, as I have discussed in recent essays on the gold bull market.
Even from a purely eye-balled perspective, using the VIX’s 200dma as an arbitrary baseline is quite interesting. On the graph above note how the three major VIX spikes all soared high above their 200dmas in order to accurately signal a stock-market V-bounce and throw a powerful time-to-get-long notice to speculators. Contrast this with the recent VIX 40 levels in early 2003, point “A” above, where the VIX failed to move significantly above its 200dma and didn’t throw a clean signal.
Not surprisingly, this also works on the downside too. Note above how the latest VIX readings this week have plunged far, far below the index’s 200dma. If a low VIX truly measures extreme complacency, today’s relative VIX reading is remarkably low and adds support to the bearish thesis that the next major US equity-index move will be sharply down.
Perhaps not only the absolute VIX level is important for flagging major tradable signals, but also the relative VIX level in relation to a baseline like its 200dma also matters. This idea makes intuitive sense as well, as great fear and volatility should, in order to be considered great, significantly exceed the general prevailing fear and volatility background noise leading up to the particular great-fear episode.
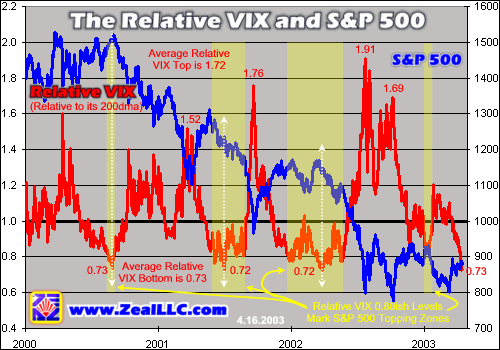
Thanks to the miracle of the modern spreadsheet, we can explore this theory farther in a much more precise way than merely eye-balling the absolute VIX relative to its 200dma on a conventional graph. Our next graph converts the raw absolute VIX and its 200dma into what I call a “Relative VIX”. The Relative VIX shows the daily VIX readings in relation to its current 200dma on any given day. By distilling this down mathematically and graphing it, it becomes far easier to analyze this Relative VIX theory.
Reading this new graph is easy. A Relative VIX level of 1.0 means that the VIX is trading exactly at its 200dma. A Relative VIX level of 0.5 means that the VIX is trading at 50% of its 200dma. And, you guessed it, a Relative VIX level of 2.0 means that the VIX is trading at double the level of its current 200dma. Just remember that this Relative VIX simply defines the VIX in relation to its 200dma at any given moment in time and you will have no problem understanding this concept.
Intriguingly, perhaps this Relative VIX theory can help alleviate the significant problems that the absolute VIX causes for speculators trying to read it despite its rising volatility baseline.
As we arbitrarily deploy the VIX’s 200dma as its volatility baseline, a whole new avenue of research and analysis opens up for speculators. This conceptual filter enables us to view the VIX within its current tactical context without distortion rather than struggling to understand what the absolute VIX is trying to tell us.
Since the VIX has currently plunged to such low absolute and relative levels today, we’ll begin our analysis looking at Relative VIX bottoms. In the chart above, the VIX has tended to bottom at levels of 72%-73% of its 200dma. Interestingly, each of the three times in this Great Bear that a Relative VIX of 0.73 occurred it marked a spectacular moment to throw short in anticipation of a coming waterfall decline.
Provocatively, on both Tuesday and Wednesday of this week the Relative VIX again closed at 0.73, a major low Relative VIX level in the past heralding an upcoming sharp V-bounce to new lows, for the first time since March 2002! While the future is unknown and anything can happen, you have to admit that this fourth 0.73 Relative VIX reading in as many years dramatically increases the probability that the next major stock-market move will be sharply lower. Maybe the bulls should be far more nervous than the bears today!
It is also interesting that any Relative VIX levels around 0.80ish seem to mark the latter stage of major interim topping zones in the US equity indices. These zones occurring in the past are shaded in yellow above. Of course with today’s Relative VIX hovering at its 0.73 long-term lows yet again, odds are that this current post-war-rally S&P 500 trading action will also be proven in retrospect in the months ahead to be a topping zone.
Looking at the Relative VIX tops also yields some fascinating insights. First, note that the average Relative VIX top marking major V-bounce interim lows in US equities is 1.72, meaning that the VIX averaged about 172% of its 200dma level when it signaled unsustainable extremes of fear and panic. We do need to be cautious about this average topping level, however, as it encompasses a broad range of Relative VIX tops ranging from 1.52 to 1.91.
These numbers are interesting because they help give speculators a potential absolute VIX topping range based on today’s VIX 200dma, which is currently running around 36. If we take the average Relative VIX top of 1.72, it yields a potential absolute VIX spike target today of around 62 or so. If we take the Relative VIX topping range of 1.52 to 1.91, we arrive at potential absolute VIX spikes between 55 and 69 as a potential VIX topping range at the next stock-market V-bounce lows.
Now I have long scoffed at the idea of another VIX 150 super-spike due to anti-free-market nonsense like program-trading limits and the arbitrary closing of exchanges on big down days. I have always felt that if investors can’t take the heat of a big down day, they shouldn’t play the game. Trading restrictions designed to slow big down days are foolish and they muck up necessary free-market adjustment processes, dramatically worsening the total pain in the end for investors.
In addition, another VIX 150 super-spike is extraordinarily unlikely since market crashes in history always happen within weeks of major bubble tops and never from deep within the dark bowels of a long bear market. When the fact that late-bear market crashes just don’t happen is coupled with the fact that meddling bureaucrats now arbitrarily halt trading whenever a down day threatens to actually get exciting, the 20%+ single-day crash necessary to spawn another legendary VIX 150 super-spike may never happen again.
While VIX 150 still seems like madness to me, I would not be at all surprised to see an absolute VIX spike above 50, to 55 or 60 or maybe even 70, to mark the next major interim V-bounce stock-market low. Since background baseline volatility is continuing to rise throughout this Great Bear market just like it should, it makes sense that the absolute VIX spikes could conceivably also grow in magnitude.
At the very least, this Relative VIX work suggesting the possibility of absolute VIX spikes in the 55-70 range based on the index’s current high 200dma are worth considering for speculators. Perhaps a VIX 50 bailout point for the shorts will be a little bit too early this time around. Only time will tell for sure!
Another interesting Relative VIX top observation is the low Relative VIX levels reached in late January when the absolute VIX hit 40. While 40 seems high historically on the usual absolute VIX scale, it only managed a Relative VIX level of a measly 1.20 times its 200dma, which is not high at all. On the graph above you will note that a relative VIX reading of 1.20 is barely enough to elicit even a bored yawn from speculators!
In summary, this Relative VIX may prove to be another valuable tool for active index speculators to consider. Perhaps this Relative VIX notion helps eliminate the changing VIX baseline problem for comparable VIX measurement.
So far in this Great Bear, a low Relative VIX level of 0.73 or so has proved to be an excellent moment to throw short or buy put options in anticipation of a coming waterfall decline. If you are interested in buying index puts today, the current April issue of our acclaimed Zeal Intelligence newsletter for our subscribers outlines some carefully selected specific index puts which will soar in value if this Relative VIX indicator proves right yet again. If the markets are destined to fall, you may as well grow your capital through the coming downleg!
In addition, the Relative VIX suggests that perhaps the old VIX 50ish topping levels marking V-bounce lows may be too modest with higher general volatility background noise. Perhaps the next major VIX spike will run to 55 or 60, or maybe even approach the fabled 70 level. When that day comes, do not hesitate to cover all your shorts, sell all your puts, and throw long and/or buy index calls to ride the inevitable subsequent V-bounce bear rally. We will certainly be aggressively buying and recommending specific index calls to our newsletter subscribers then!
While current market activity is confounding and annoying the longs, the shorts, and the outs alike, this initial exploration into the Relative VIX suggests that the bulls have much more to worry about than the bears.
If this new Relative VIX low this week proves to be as significant as its mirror-images in the past, the next big move in the US equity indices will be sharply lower. Get ready.
Adam Hamilton, CPA April 18, 2003 Subscribe |
|||||||
|
|
|
|
|
|
|
|
|
|
|
|
|
|
|
|||