|
|
|||||||
|
|
|
|
|
|
|
|
|
|
|
|
|
|
|
|
|
|
|
S&P 500 Neckline Challenge Adam Hamilton June 6, 2003 3107 Words
As the recent months of financial-market action have yet again proven, there is never a dull moment in the fascinating world of speculation!
The powerful bear-market rally that erupted out of nowhere days before Washington invaded and annexed Iraq has grown from a small and much-scorned blip on the radar to a major rally of monstrous proportions worthy of great respect from bears and bulls alike.
Since elite sentiment indicators like the VIX and PCR anomalously failed to show even a hint of fear in this entire current bear rally to date, I have been on the wrong side of the trade for this whole rally and have really felt its full wrath and fury. Bears are bleeding bright red and falling like flies these days, and popular consensus seems to resolutely believe that the Great Bear is dead and a glorious new bull has been born.
It is easy to understand why the bulls are so excited and the bears are so running scared. In terms of the flagship US S&P 500 index, the rally has continued to cut through key resistance levels almost as fast as the US military ripping through Saddam Hussein’s Baghdad defenses. It’s been unreal to witness.
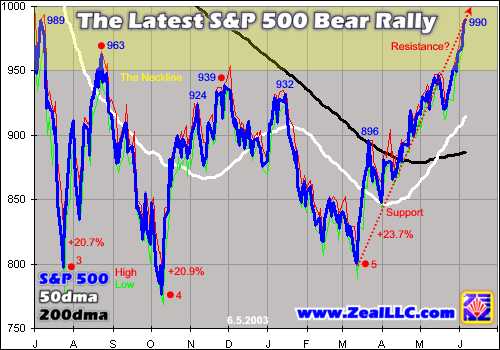
In mid-April, the rally knifed through the crucial 200-day moving average of the S&P 500 and kept right on charging. In late April the initial war-rally-surge interim highs around 896 fell too. The juggernaut continued in May, unabated and unstoppable, blasting through the latest major post-bear-rally interim top of 939 carved in late November. The S&P 500’s 50-day moving average also swung sharply north and crossed its 200dma to the upside, fanning the flames of bullish technical excitement.
As a speculator who studies both the long-term valuation and short-term sentiment cycles that ultimately drive the financial markets, I expected each of these key earlier resistance levels to hold and traded accordingly. The markets proved me dead wrong though, relentlessly marching higher in spite of valuation and sentiment extremes that ought to have crushed the rally based on historical precedent.
Yet, from a strategic technical-analysis perspective, all these earlier resistance levels that the bulls walked through like they owned were ultimately leading up to a giant ultimate technical test, the latest assault on the fabled S&P 500 neckline!
Watching the S&P 500 challenge this long-term neckline is like watching the Super Bowl and World Series of technical analysis combined, exciting stuff! This week I would like to discuss the massive technical formation that created the S&P 500’s neckline and the status of the current incredibly impressive rally’s challenge of this massive neckline.
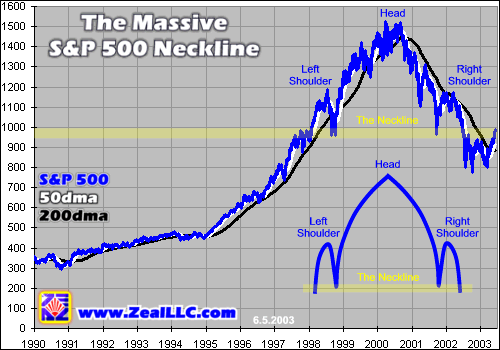
The best way to grasp the significance of the S&P 500 neckline is to see it on a long-term chart. It is one of the largest technical formations I have ever witnessed and easily the most important one as well, since around $9t of investors’ and speculators’ scarce capital is riding on the S&P 500 today.
The massive S&P 500 neckline that is so often discussed by technical analysts today is a critical part of a much larger enormous six-year-old technical head-and-shoulders formation.
The stylized drawing above shows why such a price pattern is known as a head-and-shoulders formation. Market action creates what looks like a left shoulder, then a much higher head, and then a right shoulder roughly symmetrical with the original left shoulder. The two “armpit bounces”, the beginnings of the head and right shoulder, define what is known as the neckline. It just sounds more polite than armpit line, I guess! The general S&P 500 neckline zone is shaded in yellow in all the graphs in this essay.
The ultimate result is this head-and-shoulders formation looks like the silhouette of a hulking man. Being an insatiable chocolate-chip cookie fan myself, the blue outline above reminds me of the Cookie Monster from Sesame Street!
The head-and-shoulders pattern is one of the most famed price formations in all of technical analysis. The S&P 500 example we are watching these days is a particularly excellent specimen, as its inherent symmetry and massiveness are outstanding by head-and-shoulder standards.
This formation is generally a reliable indicator of an imminent selloff, a bearish omen for whatever price chart in which it happens to make an appearance. In classical technical analysis a head-and-shoulders pattern is a sell signal, warning speculators that a price is breaking down and is likely not yet finished falling. As a matter of fact, in the celebrated lore of technical analysis chart patterns don’t get much more bearish than a head-and-shoulders formation!
It is easy to understand why this pattern is so powerfully bearish. When you look at a price chart like the one above, realize that each price point is the sum total of all the hopes, fears, dreams, and expectations of every S&P 500 investor and speculator on Earth on any given trading day. We can take a mental journey through each trading stage of the head-and-shoulders formation to help understand the interpretation of this major chart pattern.
The left shoulder is formed at the first major selloff near the top of a big bull run. In the S&P 500’s case, the left shoulder selloff that initially bounced off the neckline occurred in late summer 1998 during the frightening days surrounding the implosion of the elite Long-Term Capital Management mega-hedge fund. Everyone was terrified at the time, including the Fed which rounded up a consortium of influential New York banks to try and support the markets lest a systemic liquidity catastrophe snowball.
After the LTCM crisis blew over though, the S&P 500 Great Bull continued galloping higher, ultimately reaching its apex in early 2000 and forming the head of the formation. This head is important because it reflects a major change in momentum and buying interest. While not one market participant in a hundred recognized it at the time, a Great Bull had changed into a Great Bear simply because more folks were growing interested in selling than in buying.
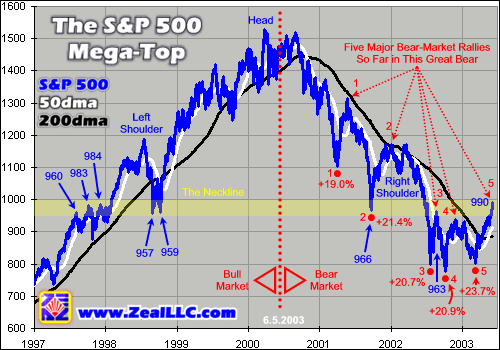
The head of the formation then began to crumble as selling outpaced buying. A bear was born! Then, over a year later just like clockwork, the S&P 500 bounced right on its major long-term neckline a couple weeks after the 9/11 attacks of late 2001. This right shoulder armpit bounce confirmed the S&P 500 head-and-shoulders formation and has been much discussed among technical analysts ever since.
Following the post-9/11 sentiment lows, a major bear-market rally was launched which started forming the right shoulder of this huge S&P 500 price formation.
From a pure speculative standpoint this was a normal bear-market rally initially driven by extreme fear following 9/11 that later failed at extreme greed in early 2002. From a moral perspective, however, Wall Street was despicable in driving this particular rally as they claimed after 9/11 that Americans had a “patriotic duty” to buy overpriced stocks in a Great Bear market. Hundreds of billions of dollars of scarce capital were wiped out by this particularly heinous Wall Street lie pulling on the emotionally-raw post-9/11 heartstrings of the American investors.
This post-9/11 rally ran up to heights not too far away from the left shoulder tops, and then the right shoulder also failed and crumbled. This right-shoulder failure below the neckline happened last July, which was the last time I wrote about this huge S&P 500 head-and-shoulders formation in depth. Since those days a year ago, the S&P 500 has lingered below its neckline, with the notable and important exception of today’s rally challenging the massive neckline this week.
In technical-analysis terms the neckline itself is important because it helps define the extent of the expected selloff after the right shoulder of a head-and-shoulders formation fails below its neckline. As a general rule of thumb, the bearish signal of a completed head-and-shoulders formation expects a selloff down to prices that are roughly as far below the neckline as the top of the head was above it.
If we use the popular estimate of the S&P 500 neckline today at 965, we can gain an idea of what this technical formation suggests is ultimately in store for the S&P 500. The top of the head of the S&P 500, also its all-time closing high, was 1527 in March 2000, the same month that the phenomenal NASDAQ bubble gave up its ghost and popped. The 1527 head minus the 965 neckline yields a head-to-neckline distance of 562 S&P 500 index points.
Since head-and-shoulders formations are generally expected to portend ultimate selling down to roughly the same distance below the neckline as the head was above the neckline, this formation yields a target S&P 500 level of 965 less 562, or S&P 403!
The S&P 500 at 400 may sound absurdly low, but it is not outside the realm of possibility. As I discussed last week in “Valuation Wave Reversion 2”, fair value for the S&P 500 these days based on the actual earnings power of its member corporations is roughly 550 or so. And after major bubbles valuations ultimately slice through fair value and head into the feared undervalued zone, making this S&P 500 at 400 technical target certainly possible in fundamental-valuation terms.
In addition, if you look at the long-term chart above, you will note that the S&P 500 upslope dramatically steepened as the Great Bull began accelerating into its terminal bubble phase in early 1995. In history the busts after bubbles tend to wipe out the gains from the preceding decade or so before the bubble top, which would take the S&P 500 back down to at least the 400-500 levels in which it traded for most of the early 1990s.
The massive S&P 500 head-and-shoulders formation is suggesting a target for the S&P 500 around 400 or so, and both fundamental and other technical factors support this downside estimate. In addition, the bigger a technical formation grows and the longer in time it gestates, the higher the probability it will ultimately resolve itself in the expected manner. Since this massive S&P 500 pattern has been in place for six years, its vast size unquestionably increases the probability that it will be resolved at roughly the same distance below the neckline that the top was above it.
With the appropriate grand strategic technical picture in mind, we can zoom in to the portion of the chart above that contains the S&P 500 head-and-shoulders pattern. This particular technical formation will be studied and celebrated for centuries to come since it marks the very apex of one of the greatest bull markets in world history.
The S&P 500 neckline is generally considered to be precisely at S&P 500 965, but in reality it is more of a region between 950 and 1000. The yellow shaded area above shows the major S&P 500 interim tops and interim bounces that helped define the neckline, which occurred between 957 and 984 prior to today’s rally. An average of these previous technical turning points yields S&P 500 967 or so, which helps illustrate why S&P 500 965 is so ingrained in technical analysts’ minds.
In my opinion, a major technical event has to move more than 2% outside of its expected major support or resistance levels in order to be taken seriously. I use this 2% rule since technical analysis can be quite subjective and visual. When looking at a long-term graph like the ones above, it is difficult for our human eyes to discern differences under a couple percent or so on the charts.
If we assume the center-mass point of the S&P 500 neckline is 965-967 based on the graph above, today’s rally has to close more than 2% above it or in the 984-986 range to seriously challenge the neckline. On Thursday of this week, the data cutoff for this essay, the S&P 500 did manage to close at 990, about 2.5% above its neckline. This is a notable achievement and very impressive for the bulls, as it is on the verge of being a true breakout above the neckline. As the chart above shows though, S&P 990 is still slightly within the broader yellow neckline zone.
So what does all this technical mumbo jumbo mean? Like many things in life, its interpretation depends on the biases of those who interpret it!
The bulls believe the S&P 500 neckline at 965 has decisively fallen, shattering a multi-year bearish pattern of lower highs and lower lows and heralding the glorious birth of a new bull market. Perhaps they will be proven right! Only time will tell.
The handful of remaining bears being flayed alive, on the other hand, the bloody and bruised camp in which I remain for powerful historical fundamental and sentimental reasons, still haven’t felt enough pain to be convinced yet.
Fundamentally the US stock markets remain grossly overvalued by all historical measures, like P/E ratios and dividend yields. In sentiment terms, this entire rally since mid-March has been marked by staggering levels of greed and complacency not witnessed since the euphoric bubble days of early 2000. The financial markets don’t like everyone being too fearful or too greedy at once, so the markets almost always move sharply in the other direction once whatever sentiment extreme that happens to be dominating at any given moment grows too outrageous.
In technical terms, the red annotations on the chart above help illustrate the continued skepticism felt by the few remaining bears. As of Thursday’s close, the current rally has powered up an incredible 23.7% above its most recent interim lows, a very impressive and respectable number. It is now the largest S&P 500 rally we have witnessed since the bubble top of early 2000, the head of the head-and-shoulders formation.
But, as is noted above, there have been four other major bear-market rallies in the 21%ish range that ultimately collapsed and slaughtered the bulls right when they were getting greedy again. Major bear rallies 1 through 4, marked above, had an average gain from interim trough to interim peak of 20.5%. Today’s 23.7% rally is certainly worthy of great respect as it has utterly crushed the bears including yours truly, but is a 24% gain all that different from an average 21% gain in the last four times the bulls were hugely wrong in this Great Bear?
In light of today’s staggering overvaluations in US equities and the breathtaking extremes of greed and complacency that the sentiment indicators are betraying, I still believe that the current rally, even at +24%, has not distinguished itself enough to appear significantly different from the past four major bear rallies that disastrously failed and cost investors hundreds of billions of dollars of scarce capital each time.
Even at this week’s latest interim top this rally is still within the general neckline zone of the massive S&P 500 head-and-shoulders formation. Zooming in even farther, the general profile of the current rally even looks similar to the third and fourth major rallies of this Great Bear that both catastrophically failed right when folks were getting too complacent and comfortable in August and November.
Beginning last July and October, two massive bear rallies erupted in the S&P 500 which both carried this flagship index up almost 21% from its latest interim troughs. As you can see above, both of these rallies had an incredibly sharp and violent early stage off of wild extremes of fear sentiment marked by stellar VIX levels.
After their initial violent bounces, major rallies 3 and 4 both traded higher but at a slower pace, with more down days mixed in. Then, when the rallies were finally getting mature and popular complacency was growing too euphoric, they abruptly failed and fell rather sharply after loitering near their latest interim tops for a week or two. This general pattern is typical of all major bear-market rallies and was discussed in more depth in my “Bear-Market Rally Autopsy 2” essay.
Much of the same general bear-rally profile is evident in the current S&P 500 rally. In early March it erupted out of nowhere, although its initial spike higher was not as sharp or extensive as earlier specimens since this particular rally didn’t erupt out of popular fear and panic but out of the one-time unrepeatable news that Washington was on the verge of annexing Iraq.
The rally then continued to power higher through April and May, crushing the bears like me into bone dust and turning many players who don’t understand the big strategic picture into insta-bulls. The rally’s initial support line was unbelievably steep and held until May, when it was finally pierced to the downside. Since then, there has been a second extremely sharp upleg in this rally that is very reminiscent of the steep final blow-off stages of the previous major bear-market rallies.
In addition, the rally is desperately trying to continue accelerating to the upside to overtake and catch up with its initial short-term support line, but with Thursday’s close at the line it may now be turning into short-term overhead resistance as often happens near technical tops. While there is no way to know yet if this latest sharp upleg represents the final terminal blow-off stages of this particular bear rally, it wouldn’t be surprising if it failed somewhere around here in light of recent-past bear-rally precedent.
Regardless of what happens in the coming weeks, the currently engaged S&P 500 assault on its fabled neckline is an awesome battle to watch unfold. This rally has already defied all my expectations of its magnitude and longevity by cracking short-term resistance levels one after another like dominoes, but it won’t run forever.
Perhaps the bulls are finally right this time for the first time since 2000. Maybe we really are in a New Era, where earnings and dividends are totally meaningless and all that matters is hype. A brave new age where unbridled greed is good, where no price is ever too high to pay for a stock, and no investor or long-side speculator ever loses a penny again as stock prices rise into infinity. And perhaps not.
As I watch this fascinating and epic S&P 500 challenge of its neckline unfold, I still believe that probabilities and market history strongly support the bearish thesis. Even if the S&P 500 rockets above 1000 and the neckline fails, the immense fundamental and sentimental gravity weighing on stock prices would probably soon catch up and rapidly drag any true breakout back down below the neckline.
However it all plays out though, bulls and bears alike are on the edge of their seats waiting to see if a dazzling new bull or the battle-scarred Great Bear emerges victorious from this epic melee.
Adam Hamilton, CPA June 6, 2003 Subscribe |
|||||||
|
|
|
|
|
|
|
|
|
|
|
|
|
|
|
|||