|
|
|||||||
|
|
|
|
|
|
|
|
|
|
|
|
|
|
|
|
|
|
|
Trading Volatility Bottoms Adam Hamilton August 2, 2002 2635 Words
Ahhhh, there’s nothing quite like these awesome relaxing summer days in late July and early August right? The days are gloriously long, the sun is bright and warm, and life is good! One would expect that the financial markets would calm down a bit as investors and speculators headed to the beaches and general trading activity waned until autumn.
Not this year!
All kinds of markets, from stocks to gold, have been whacked with enormous volatility thus far in the summer of 2002. It has really been exhilarating to watch the crazy action unfold, although definitely frustrating to trade at times. It never ceases to amaze me that the farther we trudge into the belly of this whole bubble experience beast, the more surreal the whole episode becomes.
It’s almost as if the Great Bear is patiently and systematically dismantling all the conventional wisdom accumulated over two long decades of virtually uninterrupted bull markets. Cherished old axioms, such as the widespread belief that summer is a slow trading season bereft of volatility and heart-stopping moves, are being shattered at frightening speeds.
No one ever said the post-bubble bust experience would be dull, and it certainly hasn’t been this time around!
The extreme volatility in recent weeks commanded my rapt attention. Volatility is a very useful concept to understand and to track as it has an impressive record of accurately marking tradable turning points, particularly oversold bounces to the upside. When markets fall, volatility gradually increases until a climax is reached, an incredibly violent day or a few where prices are caught in an epic tug of war between frantic sellers and bargain-hunting buyers.
The sterling record of volatility in marking bounces is not difficult to understand. While long-term equity prices are driven almost exclusively by core fundamentals such as earnings and valuation, short-term prices are subject to the fickle whims of investor psychology. Greed and fear have infinitely more influence on short-term market action than the strategic fundamentals that truly matter.
Greed and fear, while equally powerful emotions, are asymmetrical in the way they influence market behavior. Greed develops and festers slowly, over many months or years, as one investor at a time gradually realizes that someone out there is getting rich in the markets so he or she decides that there is no reason why they can’t do the same. Greed takes a long time to wax ecstatic and come to a boiling point among a large population of investors.
Fear, on the other hand, often strikes the whole herd of investors at once out of the blue like a bolt of lightning. Some unforeseen bad news explodes onto the scene, or prices drop rapidly, and, like a flock of sheep, the chilling specter of fear leads to sudden mass selling movements. There is not often a long gestation period for naked fear, it can rear up rather quickly.
It is this dark fear welling up deep within investors’ and speculators’ hearts that leads to volatility extremes, huge spikes in volatility accurately flagging interim selling climaxes.
I have been fascinated with volatility for a long time. Two summers ago, in our private Zeal Intelligence newsletter, I presented a study of major supercycle bubble busts throughout history and attempted to discern a distinct volatility signature, like a fingerprint, to help investors avoid the amazingly destructive post-bubble carnage. In the August 2000 issue I wrote to our clients…
“Since the NASDAQ intra-day volatility has ALREADY exceeded 4%, and the index itself is valued more highly than any other equity bubble in history, the probability of the final volatility top reaching greater heights than the DJIA in 1929 is very high… A 73% drop in the NAS since its first volatility top would put the index at an abysmal 850!”
When we did this fateful volatility study of bubbles in the summer of 2000, the NASDAQ was trading above 4000. Observing volatility signatures was crucial to our decision to get our own capital out of the NASDAQ bust and advise our clients to do the same exactly two years ago. In hindsight, I am tremendously thankful for those early volatility studies and the priceless wisdom we gleaned from them.
About four months later, in November 2000, I wrote an essay called “Volatility Squared” that continued our bubble volatility studies. That essay contained updates of many of the same graphs our subscribers had seen back in the summer of 2000. The bottom line was that great bubbles and busts throughout history always seem to have the same volatility signature, which I coined a “Double Volatility Top.”
We presented volatility graphs in that essay of the DJIA 1929 bubble bust, the DJIA 1974 secular bear market, the S&P 500 1974 secular bear market, the 1987 DJIA crash, the Nikkei 225 1989 bubble bust, and our perpetually entertaining NASDAQ 2000 bubble bust. If you haven’t seen these graphs, you may wish to briefly check them out. This week’s essay is a spiritual descendant of “Volatility Squared” delving farther into the crucial volatility indicators.
Interestingly, you don’t even have to be a wacky contrarian investor or speculator to pay homage to the wisdom of closely monitoring market volatility. Today every minute move of popular volatility indices including the VIX and VXN are eagerly watched by traders cutting across the whole spectrum of worldviews and market outlooks. For our clients, I even discussed the recent behavior of the VIX and VXN and its implications in the shiny new August 2002 issue of Zeal Intelligence just published.
While the popular volatility indices are excellent tools, they do have significant limitations. The VIX only tracks volatility in the elite S&P 100 index, comprised of a subset of the mega-cap S&P 500 companies. The VXN concentrates on volatility created only by movements in NASDAQ 100 companies. Unfortunately both of these widely-followed volatility indices only capture a relatively narrow cross-section of the entire US equity markets.
An alternative approach to analyzing volatility is the way we were doing it two summers ago, extracting raw market data for a given broad index, such as the NASDAQ composite or S&P 500, and analyzing actual intraday volatility. Intraday volatility is simply the difference between the high of any given day and the low of that same day. This number is then divided by the previous day’s close to arrive at a percentage intraday volatility.
Intraday volatility can add significant insight to volatility analysis because it is not shackled into only analyzing a narrow index of giant mega-cap US stocks.
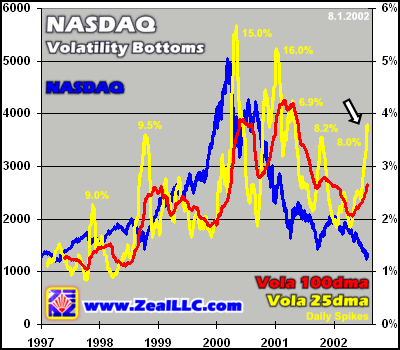
You stalwart survivors who have been suffering through my endless weekly rants long enough to have read “Volatility Squared” a couple years ago will recognize this first graph. It is the ubiquitous NASDAQ in blue with moving averages of intraday volatility superimposed on top. The red line, just as in the original essay, represents the 100-day moving average of intraday volatility. The yellow line is a much shorter 25-day moving average (25dma).
The small yellow numbers represent the highest single-day spike in intraday volatility that occurred at the climax of each individual volatility episode. Our graphs this week originally looked like a zealous 3-year old scribbled all over them when we included the raw intraday volatility data, so we ended up hiding that. We instead added the moving averages, and then simply labeled the points of maximum single-day intraday volatility spikes in the original unsmoothed data.
I hope you find these graphs as provocative as we did!
Although at first glance the red 100dma may look like a classic double volatility top, it is not. As I explained last year in “The Elusive NASDAQ Bottom,” the second hump in the trademark double volatility top signature of bubble busts always occurs after the ultimate bust bottom. Not even a Wall Street cheerleader could miss the obvious characteristic of the chart above where the apparent second volatility top occurred well before the NASDAQ lows to date!
As recent history has proven, the second apparent volatility peak above did not mark the final NASDAQ selling climax heralding its ultimate long-term post-bubble bottom. The index has continued falling like a rock even after that event, roughly April 2001. Just as I wrote last year, I still believe we have yet to see a true definitive second volatility top within the red 100dma.
The characteristic of this graph that amazed us this week was not the red 100dma line, but was evident in the new yellow 25-day moving average above. Pick a yellow 25dma volatility spike, any yellow 25dma volatility spike! Don’t be shy! There are six major completed yellow intraday volatility 25dma spikes above, and massive tradable rallies spawned after 100% of the spikes. If you deployed a short-term speculative stake immediately after any of these events, regardless of if they occurred during the pre-bubble bull market or post-bubble bear, you had a few months to make mega-bucks on the long side.
Each 25dma intraday volatility spike marked a rock-solid short-term long speculation opportunity, without fail! Some achieved very high single-day volatility climaxes, such as the 15% one marking the NASDAQ crash of March 2000, but they all unambiguously showed traders key tactical bounce points from which to launch immensely profitable short-term speculations.
Just as the asymmetrical temporal dominance that fear commands over greed suggests, selling climaxes bathed in intense daily market swings proved to be the perfect entry point for short-term trades, regardless of the primary trend. Buy when there is blood in the streets, as Baron Nathan Rothschild used to say!
The white arrow above points to the current massive intraday volatility 25dma spike. On July 24th, my favorite whipping boy of an index, the doomed NASDAQ, had an impressive 8% intraday swing from 1192 to 1290. In the last six 25dma vola spikes, the average maximum single-day vola top marking a tradable short-term bottom weighed in at about 10.8%. The actual current 25dma spike above looks like a perfect match amidst the stalagmite forest of other 25dma spikes marking past tradable short-term NASDAQ bottoms, or bounce points.
The implication? Perhaps we relentless NASDAQ bears ought to take a vacation for a month or two and let the wounded bulls do their thing. If the NASDAQ is about to bounce into another serious bear market rally, as the vola moving averages seem to suggest, far better price points for us opportunistic short sellers probably lie dead ahead.
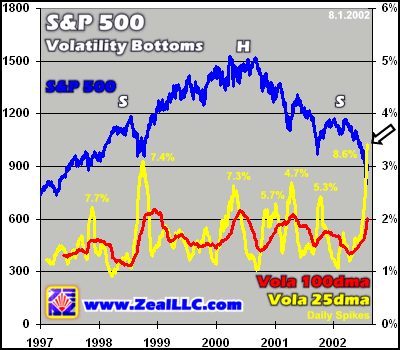
The S&P 500, graphed to the same specs as the NASDAQ above, is also quite revealing. In addition, the now broken colossal strategic head and shoulders formation I discussed a few weeks ago in “S&P 500 Slow-Motion Crash” is marked below. It never ceases to amaze and enlighten just how all these seemingly disparate lenses through which to view the markets all dovetail together beautifully to make for a much clearer whole.
While one could certainly make the case that the NASDAQ did not quite see enough intraday volatility in late July to absolutely mark an unambiguous temporary bear market rally bounce point, the S&P 500 volatility was truly extraordinary in the midst of the brutal mid-summer carnage last week.
On July 24th the S&P 500 witnessed an utterly massive intraday swing, from 776 to 844. This wild 8.6% intraday oscillation is by far the largest single intraday move since at least 1997 in the elite US index, and the sheer violence of this episode ought to turn more than a few speculators’ heads.
Once again, each major 25dma intraday volatility spike in yellow above corresponded well with a suitable entry point for a short-term long trade with a several week or month time horizon. The two center volatility spikes near the ultimate S&P 500 top, its “head” in technical terms, were a little less clear, but all the outlying vola spikes both in the bull and bear markets corresponded to perfect points of entry for short-term long speculations.
Pretty fascinating stuff, eh?
What to do about it? I know exactly what my partners and I are doing with this data in terms of actual trades, but to find that out you will have to honor us with a subscription to our private newsletter, Zeal Intelligence. While I truly love writing these essays and making them available for free, we need to feed our families too so we offer a separate premium service for detailed trading recommendations and more. We always save all our tactical tradable information for our awesome private clients. Thank you if you already subscribe!
Detailed tactical data aside, the strategic implications of our research on intraday volatility 25-day moving averages are obvious.
The enormously potent human emotions of greed and fear drive short-term market prices. Fear wells up much more quickly than greed and its cold boney hands touch many more investors at once than greed ever can. Because of the inherent asymmetry between greed and fear, episodes of tremendous intraday volatility always seem to mark tradable bounce points in the equity markets.
Under the spell of this innate and unavoidable tendency of group human behavior, investors panic and dump their shares with great enthusiasm as they attempt to end the pain and get out of the markets. These very wild episodes, however, typically mark the short-term bounce points. As contrarian investment theory teaches, most investors buy and sell at exactly the wrong time. They buy near the euphoric mania tops when they should be selling and they liquidate at the frightening dark bottoms when they should be buying.
While it is truly sad that most investors behave so dysfunctionally, they too have the option of researching how the markets truly work in historical context and applying the hard lessons to their own behavior. When the handful of investors who actually seek timeless market wisdom reach this point, they inevitably become contrarians because this is the only macro investment strategy that works flawlessly over decades and centuries.
As the vast majority of the thundering herd are far too lazy to do their own due diligence, they create marvelous short-term inefficiencies that we can capitalize upon. When most are selling the NASDAQ or S&P 500, the prudent contrarian looks to buy. When most are buying the NASDAQ or S&P 500, as at the apex of the ballistic arcs after each bounce, the wise contrarian looks to sell.
Please make no mistake, at best these 25dma volatility signatures may mark short-term tradable bottoms suitable for going long for a few weeks or months. There is absolutely no way, however, that the ones to date could mark the actual final secular bear market bottoms. As I have written in countless past essays on these chaotic markets, supercycle bubble busts always, 100% of the time, ultimately sweep stocks far down to pitiful valuations based on P/E multiples of well under historical fair value, which is 13.5x earnings.
No real, final long-term bottom will be carved out, in my opinion, until the P/Es of US equities are officially undervalued in historical context. Unfortunately we aren’t even close to that dismal point of legendary despair yet, with stocks still trading near bubble valuation extremes.
This Great Bear may only be roughly half done with its frightful work of destroying the gains of most of the preceding 20-year bull market! Only when the majority of investors from the last two-decade bull run throw up their hands in disgust, sell at any price, and vow to never again enter the unforgiving casino of the equity markets will the ultimate bottom be at hand.
Nevertheless, there are unmistakably tradable countertrend rallies that rear their fleeting heads even within the devastated midst of brutal supercycle bear markets. Check out any graph of a post-bubble bust period and they are quite evident. The market volatility indicators today are offering tantalizing clues that just such a short-term bear market rally may be imminent.
Adam Hamilton, CPA August 2, 2002 Subscribe |
|||||||
|
|
|
|
|
|
|
|
|
|
|
|
|
|
|
|||