|
|
|||||||
|
|
|
|
|
|
|
|
|
|
|
|
|
|
|
|
|
|
|
The Elusive Long-Term Adam Hamilton August 3, 2001 3440 Words
Lately, as I ponder the global financial markets and chat with folks around the world, I have been contemplating expectations. Every investor in the world, whether they are tech stock players, long-suffering gold investors, contrarians, or bond traders, all have some mental concept of the expected rate of return they hope to achieve. Occasionally, bubblevision or a financial newspaper runs a survey of what the average US investor expects to realize as a rate of return in the US equity markets. The revelation of these responses never ceases to amaze me, as it seems virtually everyone has VERY high expectations for rates of return in their particular investment arena of choice.
Many folks claim they are expecting 20% annual returns indefinitely. Others have more realistic expectations in the sub-10% range, while still others optimistically expect annual rates of return greater than 30%. Yet, very few people take the time to examine their expectations from a purely mathematical perspective in order to gain a more dispassionate focus on the probability of really achieving these expectations. In this week’s essay we step back from the lethargic August markets and examine rates of return from a mechanical mathematical perspective.
Warping back in time to my formative childhood years, I recall one specific bit of information that staggered me and blew my mind then and continues to today. This concept has critical implications for long-term investing as well. When I was about nine or ten years old I read a parable that attempted to illustrate an important real world numerical concept. My recollection of the specifics is very rusty, but Carl Sagan wrote a great version of this old tale for his book “Billions and Billions”. Here is the gist of the parable…
Back in ancient Persia there was a mighty king. The king ruled over a large kingdom and had great riches and power, but he was bored. The king had a trusted adviser, the grand vizier of the kingdom, who was in charge of its day-to-day management. In the legend, the grand vizier invents the ancient Persian game we know today as chess. The vizier showed his newly minted strategy game to the king and the king was delighted with the new diversion. The king was so excited about the engaging new game that he told the vizier to name his reward for the great invention.
The wise old vizier knew exactly what he wanted. He humbly asked the king to place one grain of wheat on the first square of the chessboard, two grains on the second square, four grains on the third, eight grains on the fourth, and on and on doubling the pile in each consecutive square until all 64 squares of the chessboard had doubled piles of wheat. The vizier simply wanted those piles of successively doubled wheat from the chessboard as his reward. The king was amazed at this small request from his vizier, as the king had huge royal granaries brimming with wheat from the year’s bountiful harvest. The king even tried to talk the vizier into a more desirable prize such as gold, precious gems, and even a palace, but the grand vizier refused the king’s generosity and stuck to his request for the piles of wheat on the chessboard squares.
The king finally shook his head in disbelief and consented to the vizier’s strange reward. He summoned his granary manager to begin placing the piles of wheat on the chessboard squares. Initially, the piles of wheat were very small. After the first row of eight squares, only 255 total grains of wheat had been piled on the chessboard, hardly a handful of wheat. Yet, as the granary manager continued to have his people haul in and count out the grains, the piles rapidly grew larger and larger. Soon they filled the whole room even though the chessboard still had most of its squares waiting for wheat. Finally the king realized that he had been tricked by his shrewd old vizier and that all the granaries in his kingdom couldn’t meet his pledge. The king had unknowingly subjected himself to the receiving end of an exponential increase in a series through a mathematical geometric progression.
Even in grade school, the parable fascinated me. I mulled it over for a couple days after I first read it and even talked to a friend about it. We could hardly believe that a succession of doublings on a chessboard could use more grain than an entire kingdom possessed. What a concept! Although we didn’t have spreadsheets to model the whole 64-stage geometric progression, I calculated the first 16 or so doublings and was astounded by the results. Ever the young opportunist, I decided to try the idea out on my unsuspecting parents.
I carefully planned what to say and told my dad and mom one night at dinner that they were paying me too much each week for my allowance. Instead of a few dollars a week, I proposed, why not pay me a penny this week, two pennies in two weeks, four pennies in three weeks, etc., doubling each successive week. I munificently informed them they would save money that way. Thankfully, my parents are infinitely wiser than myself, especially when I was ten years old, and they easily saw through my crafty scheme. Needless to say, they denied my humble request. So much for my dreams of unlimited wealth and world conquest in my youth!
Today with computers and spreadsheets, it takes mere seconds to take the 64-stage chessboard geometric exponential progression and mathematically model it. If my parents had agreed, they would have owed me $92 quadrillion on the 64th week alone. That is $92 followed by fifteen zeros! For comparison, this is the equivalent of 12,000 times the total M3 money supply in the United States of America today, an absolutely staggeringly large number.
No thinking person would ever expect to witness this kind of experience in the markets, year after year and decade after decade of 100% returns, yet many today expect 20%+ annual returns decades into the future. Whether a numerical series grows by doubling each successive iteration or grows by a slightly less extreme percentage like 20% every year, it is still a geometric progression that becomes inherently unsustainable in the long run simply by virtue of the massive numbers involved. In our jaded post-bubble investing era, a kind of new mythology seems to have sprung up around the fanciful idea that decades and decades of stellar compounding returns are not only possible, but probable.
This idea of geometric returns is pervasive in our markets today. It is sometimes very easy to perceive and sometimes much more subtle. A couple obvious examples include advertisements and television stock discussions. When mutual funds advertise they list their returns for the last few years, some of which are extraordinarily high, well into the double digits. Although they don’t explicitly make this statement, the implication is that they probably will achieve future returns of a similar magnitude through their superior capital management so investors should send them money. When bubblevision discusses a stock, they make statements like “XYZ has appreciated by 25% a year for the last five years”, implying geometric progressions are the norm in the equity markets.
On a subtler front, Wall Street is perpetually trying to convince everyone to invest for the long-term, saying that short-term pain is always wiped out over the long-term for the patient investor. Brokers and those with a vested interest in constant capital inflows into Wall Street cunningly try to convince their clients that “the long-term” is always rosy and appealing. The expectation is set that high returns compounding into the future are likely to be achieved. Financial planners are also guilty of setting these unrealistic expectations when they model cashflows decades into the future with high annual returns to show their clients their potential retirement assets.
Yet, when the raw math beneath these long-term assumptions is analyzed, it soon becomes apparent that they are very ethereal and continuing high returns into the long-term are virtually impossible to actually attain, at least in a single investment or class of investment.
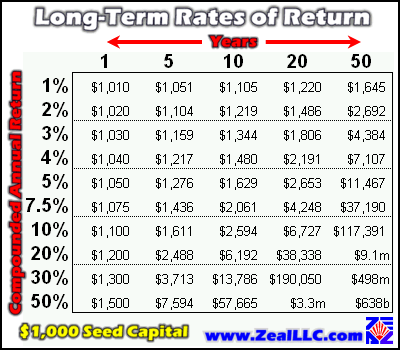
Our first graphic is a table documenting how cash will grow if a simple annually compounded return can be realized for varying amounts of years into the future. The columns represent years and the rows represent simple annual rates of return. The original investment in every scenario in this essay is $1,000, a modest sum of money that virtually anyone can scrape together if they are willing to save and live a little leaner for a while. No additional capital contributions are assumed, only the $1,000 seed growing at the various annual rates. The longest timespan we modeled was 50 years, as that roughly corresponds with the productive adult life of most investors fortunate enough to be living in the first world.
The ultimate cash that accrues even after 50 years of continuous investment for low rates of return is not terribly impressive. For instance, the 5% row above shows that $1,000 only grows into $11,467 after 50 years of compound interest. On the other hand, a 5% rate of return is probably achievable over a very long period of time by the prudent investor, so large amounts of capital can be grown for future generations. After 200 years at 5%, for instance, every $1,000 invested grows into $17.3m. The power of compound interest over the long haul is a wonder to behold!
The tremendous challenge involved in trying to achieve consistent returns over centuries, of course, is that every country in the world maintains fragile fiat currencies that they continue to inflate away into oblivion, that they inevitably have periodic currency devaluations against gold, and that it is extraordinarily difficult to protect capital across generations and centuries with immoral abominations like death taxes and inheritance taxes. If you can pull it off, however, maybe your great, great grandchildren can be the next elite moneyed family like the Rothschilds or Rockefellers thanks to your small initial investment.
The 7.5% row is very important as it represents the century-long average rate of return in the US equity markets. It is also synonymous with the historical average equity market P/E ratio of 13.5, which we have discussed in dozens of past essays. The inverse of this average P/E ratio implies a return of roughly 7.5%. One divided by 13.5 is approximately 7.5%. After a half-century at 7.5%, $1,000 will grow into $37,190, a nice chunk of change.
Since 7.5% is roughly the historical average rate of US equity returns, it is probably achievable. The great challenge here is to avoid getting caught on the wrong side of the Kondratieff waves that undulate through history in capitalist economies.
Nikolai Kondratieff was a brilliant economist researching in Russia in the 1920s. He was commissioned by Marxist dictator Vladimir Lenin to produce an economic study showing how and when capitalism would inevitably fail. Naturally, dealing with command-and-control despots, Kondratieff was expected to prove a political point with real data, not conduct true open-ended research. Kind of like the Wall Street analysts today who produce perpetually bullish reports because their Wall Street employers lust after the investment banking business. Kondratieff studied commodity prices, interest rates, industrial production, and wages over hundreds of years, ultimately reaching some startling revelations.
Rather than telling the communist thugs what they wanted to hear, in 1926 Kondratieff arrived at the conclusion that the hated capitalist system was not destined to fail, but was self-correcting and would continue into perpetuity. Every 50 to 60 years, Kondratieff noted that capitalist economies experience huge cycles. There is a boom, followed by a bust, followed by a long, slow, choppy period of growth, which leads again to a new boom. As in the 1930s in the US, a huge bust leading to a severe deflationary depression marks the beginning of a new growth cycle. This is followed by four or five decades of debt-based growth that ultimately becomes unsustainable, and another crash and depression ensues. These cycles are also known today as K-waves or long waves. Unfortunately for our friend Kondratieff, the Soviet tyrant at the time his study was completed, Joseph Stalin, was not happy with his “anti-communist” conclusions. Kondratieff was exiled to Siberia to a dark, cold, brutal life of forced labor until he was believed to have died in the 1930s.
Due to the Kondratieff waves undulating through history, the highest probability of achieving the average 7.5% equity return is realized by NOT buying in the last years leading up to the speculative mania blow-off and crash stage, or in the half dozen years following the crash. For instance, if you had bought the DJIA in 1928 or 1929, you would not have broken even, let alone realized 7.5% returns, for many decades. If you bought into the NASDAQ in 1999 or early 2000, the same type of phenomenon will likely prove true. Contrary to the popular Wall Street “any time is a good time to buy” mantra, timing is EVERYTHING for long-term investing. Buying at the wrong time in a long wave cycle in any investment arena ensures low or negative returns for many years.
Moving past 7.5%, we arrive at the surreal realm congruent with current wild popular rate of return expectations. $1,000 invested at 20% compounded annually for 50 years grows into an amazing $9.1m. At 30%, the terminal cache leaps to almost $500m. At 50%, you can expect to accrue a cool $638 BILLION after 50 years, equal to approximately 8.5% of today’s total money supply of the United States of America! Not bad for a mere $1,000 in seed capital!
Obviously, these stellar annual returns are impossible to achieve over the long-term. The reason is clear. Like the grand vizier’s Persian chessboard, geometric exponential growth projections become so enormous over the long-term that one would accrue more wealth than available on the entire planet if they were sustainable. Very high long-term returns are certainly exciting and titillating to model, but it soon becomes quite apparent that they are impossible to achieve in real life.
Stellar rates of return over the long-term are highly elusive, yet the average starry-eyed investor seems to expect them today in our jaded post-bubble environment.
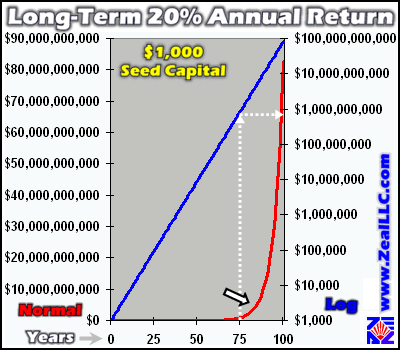
Our next graphic drills down on the popular 20% compounded annual return scenario over 100 years. Many people I have talked with and heard through the financial media lately seem to expect 20% annual growth as a baseline for future expectations. Yet, over the long run, even this seemingly modest return by recent NASDAQ standards grows into a monstrous pot of wealth if the returns can be sustained. As in our previous examples, this is a mere $1,000 of seed capital grown at 20% compounded annually, with no additional contributions, wizardry, or embellishments. Both lines are the exact same dataset, although the red line corresponds to the left axis which is a standard linear scale, and the blue line is tied to the right axis which is a logarithmic scale.
Once again, the staggering power of compound interest over the long-term is readily apparent. $1,000 invested at 20% for 100 years grows into an amazing $83 billion dollars! So, if you can put away a few thousand now and nurture it for 100 years, your descendants will be far richer than Bill Gates in nominal dollar terms.
Note the black and white arrow in the graph above. After 75 years or so, exponential growth takes an investment at 20% ballistic. Obviously, this kind of growth curve is unsustainable. Whenever we see this hockey stick-type of formation in a real-world market, it is an ultra-reliable indicator that a bubble blow-off is in progress. If this assertion can be confirmed by stratospheric valuations, the probability approaches certainty that any market or investment entering a parabolic growth phase is indeed right on the verge of a catastrophic crash.
Provocatively, long-term graphs of the Dow Jones Industrial Average and S&P 500 look very similar to this profile right now. The mighty NASDAQ long-term graph looked a lot like this in March 2000 before it crashed and shattered the dreams of an entire generation of hard-working Americans. Exponential growth has far-reaching and very important implications.
As marked by the dotted white arrows above, after roughly 75 years of 20% annual returns your $1,000 has grown into a billion dollars. You would cross the billionaire mark at year 76 to be precise. Interestingly, while it took you 76 years to make your first billion, it only takes 4 more years for your second billion to accrue. If you can hold out for only a couple more decades, you can retire at the end of your century-long 20% return stretch with a net worth of $82,817,974,522, over 80 times more money than you had at year 76.
If you can harness compound returns to work for you over many decades, wondrous results can be achieved. The same staggering power can be arrayed against you as well, however, through crushing debt accumulation. Long-term debt sucks away real wealth and years of labor at the same dizzying but inverted pace as long-term investment creates it. If more people in the United States understood these numbers and fully comprehended the enormous costs of paying someone else compound interest over many years, we suspect that the demand for 30 year mortgages would drop considerably.
With the benefit of these golden insights into growing wealth, a few important points become apparent. First, the investor is really rewarded in the long-term. The trick is to carefully shepherd and grow your capital until it becomes large enough for amazing growth to kick in through sustained returns. Second, it rapidly becomes obvious that high returns over decades are extraordinarily difficult to achieve. There is only a finite amount of real wealth on our planet, and if everyone grew their investments at these speeds soon all the wealth in the world would be insufficient to sustain the returns. Third, since high-rates of return over long periods of time are so elusive, people who are expecting 20%+ annual returns for decades into the indefinite future sure have their work cut out for them and may have to substantially lower their expectations.
Some gifted people CAN achieve high consistent returns over decades. We celebrate these rare individuals, like Warren Buffet, in our popular culture and financial world. Provocatively, the only folks we are aware of that are able to reap consistently high returns over decades are the steadfast contrarians like Buffet, those stubborn investors who fight the mania hype with all their might and only buy undervalued, out-of-favor investments. Conventional investors don’t have a snowball’s chance in Hades of achieving legendary returns over decades, as they are seduced into following trends and buying high after most of the gains were already won, but contrarians truly do have a shot.
Another important implication of the mathematics of high returns is that stellar long-term returns cannot be achieved by passive investing. One cannot buy market darling stocks and simply hold them for decades as Wall Street virtually commands investors to do. Since no individual stock is likely to grow at 20%+ per year for dozens of years in a row, the prudent contrarian seeking these enormous long-term gains must actively manage his or her capital. Perhaps an average holding period would be two or three years from purchasing an undervalued company to selling it at a fat profit. Buffet’s average holding period is even much longer than that. Some active and intelligent portfolio management is required to consistently beat the market, as markets are cyclical and capital must be periodically shifted out of overvalued investments into cheap, undervalued investments to maintain high returns.
Legendary long-term returns are highly elusive, and only a very small fraction of all investors are likely to come anywhere close to achieving consistently high returns over a lifetime of investing. The winners, those most closely mimicking this ideal, are the contrarians as history has proven. Contrarians buy low, bottom-feeding on stocks Wall Street hates. They sell high, happily forking over their shares as soon as the public catches on and bids up prices to fundamentally unjustified heights. The contrarians also zealously ignore the pervasive mania hype that perpetually emanates from the financial establishment. They are the mavericks of the investment world, the true individuals, and to them go the spoils.
The ultimate goal for all investors, especially contrarians, is to conquer the elusive long-term. Truly wondrous gains await those who can consistently grow their capital year after year, decade after decade.
Adam Hamilton, CPA August 3, 2001 Subscribe |
|||||||
|
|
|
|
|
|
|
|
|
|
|
|
|
|
|
|||