|
|
|||||||
|
|
|
|
|
|
|
|
|
|
Vexing Volatility Adam Hamilton May 26, 2000 2181 Words
As another dramatic week in the markets draws to a close, the continuing NASDAQ volatility stands out like an elephant in a badger hole. All week, huge daily swings occurred in the index, delighting adrenaline junky day traders and terrorizing conservative buy and hold investors. From the daily high to daily low, the NASDAQ Comp swung an astounding 6.5% on Monday, 5.9% on Tuesday, 7.4% on Wednesday, 5.2% on Thursday, and bled off to 3.3% on Friday in anticipation of a long weekend. Extreme volatility has been typically associated with inflection points in a market, when perceptions begin to change and the foundation for new bull or bear trends is constructed. Like an aerobatics pilot doing a hammerhead stall, investor perceptions seem to hang in space when they reach the top of their parabolic arc, and the whole world moves in slow motion. Is this mega-volatility and possible psychological paradigm shift bullish or bearish for NASDAQ and other equity markets in the short term? As usual, we’ll consult the dusty tomes of history to observe how rare mega-volatility is, whether it has historically been a positive or negative portent, and form some ideas that may help us interpret this incredible NASDAQ volatility.
What is “normal” intra-day volatility over an entire Kondratieff wave cycle? How does historical volatility compare to the current restless NASDAQ? In order to explore these questions, an analysis of the Dow Jones Industrial Average daily trading data from October 1928 to January 2000 was performed. This period encompasses over 70 years of market history, representing almost 19,000 trading days. Daily volatility was calculated by subtracting each day’s DJIA low from its high, and dividing the result by the day’s opening level.
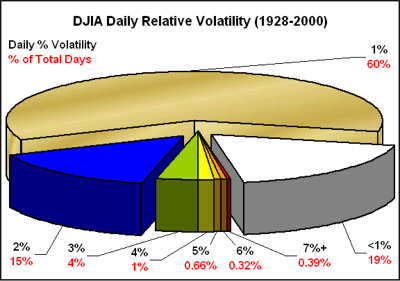
The average daily volatility for the DJIA over this sample period, which includes the crashes of 1929 and 1987, was 1.6%. 80% of the trading days in the data series had intra-day volatility under 2%. Only about seven tenths of one percent of these 19,000 trading days had an intra-day volatility exceeding 6%. The pie graph below shows the relative percentage breakdown of these intra-day volatility numbers. (On the labels, the percentage volatility is inclusive to the next highest integer, for example, 1% includes 1.00% -1.99%.)
Only 16 days of the 19,000 in this data series exceeded 10% intra-day volatility. Of these 16 days, 5 were in late fall 1929 during the crash and two were in October 1987. Extreme volatility has been very rare historically in the DJIA, as in all healthy markets.
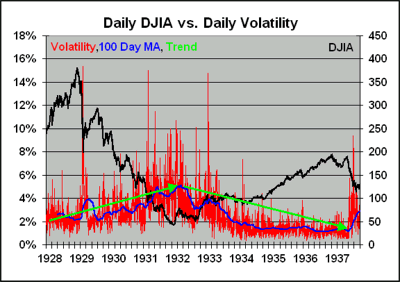
Drilling down on a portion of the data, take a look at the way volatility increased from the 1929 top to the 1932 bottom in the DJIA. Also, note the sharp declines that occurred in the market on dramatic increases in volatility. Typically extreme volatility has had a negative impact on the DJIA.
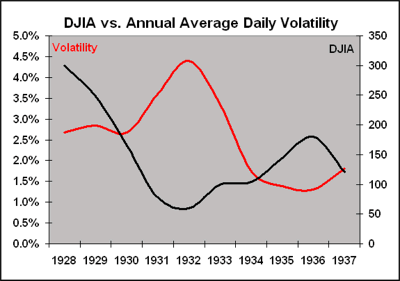
Removing some of the noise from the above graph, and looking at the annual average daily volatility relative to the annual final close on the DJIA, the inverse relationship between intra-day volatility and price levels is even more dramatic.
Continually growing intra-day volatility in a market appears to be an extremely negative influence. The public is spooked when the market becomes volatile, and may even be agitated into liquidating at all costs. Leveraged speculators can be annihilated by extreme swings, whether they are on the long or short side of a trade. The illusions of security in equity investing are shattered during periods of extreme market volatility, taking a heavy toll on psychological capital.
Market psychology is probably the single most important factor in valuation levels. If a sector is hot and popular, greed kicks in and people will buy buy buy even if they are buying at a price an order of magnitude higher than any logical analysis could possibly support. On the other hand, if the much more powerful emotion of fear surges in the psyche, investors tend to sell sell sell with no regard of the price they are commanding. This greed/fear psychology has been documented innumerable times through human history, and is the primary and almost sole cause of bubbles in markets. Volatility tends to trend upwards on the backside of a bubble for three reasons. First, as mentioned above, fear is a much more powerful emotion than greed. Any mass sequence of fear driven trades is much more temporally compressed than greed motivated trades. Second, as a bubble begins to burst, liquidity dries up, and there is less cash available to bid on falling stocks. Fewer bids imply lower volume, making it easier to push stock prices around in an auction market and increase volatility. Finally, the mathematics of down-trending price levels lower the denominator of the calculation and exaggerates the volatility trend.
As NASDAQ intra-day volatility continues to trend upwards, historical data suggests a bottom has definitely not been reached in the composite index. When a 100 day or 200 day moving average of intra-day volatility heads down decisively, the probability of being near a market bottom is much higher. Until that day, caveat emptor in the NASDAQ!
This week on the inflation front, fundamentals continued to deteriorate for the equity markets. Oil continues to hover around $30 per barrel, more than 100% more expensive than last year. In addition to the costly oil, the price of natural gas rose to over $4. This week gains the dubious distinction of being the first time in history with $30+ oil and $4+ natural gas. Gasoline prices at the pumps continued to trend up, and many families taking a road trip this holiday weekend are in for a rude awakening. The official statistics have continued to tell us inflation is low and manageable, and have even had the gall to remove food and energy from the so-called “core” rate of inflation. In addition, the numbers have appeared to error on the low side, as higher restatements of previous months’ numbers have become common. As families travel this weekend, any myths of stable prices in important goods and services in the US should be shattered. Although the source escapes me, I saw a fantastic quote regarding the downplaying of the critical food and energy price levels in the inflation prognostications. This helps put the importance of the prices of these items in perspective. “Without food and energy, we are all dead.”
The CRB index closed at another 2 year high this week, up 0.7% to 225. As a leading indicator of commodity price inflation, this level would be impressive on its own. It becomes quite amazing, however, when one considers the fact that gold continues to hover near 20-year lows, exerting a negative influence on the CRB index.
Like Rodney Dangerfield, the indisputable king of assets just “can’t get no respect” these days. After a tough week, the yellow metal closed down 1%, to $272. With the incredible turbulence we are observing in the equity markets, gold should be skyrocketing as investors flee cratering paper assets into a secure and proven safe harbor. With each day ageless historical relationships between general financial risk and the price of gold continue to be flaunted, the probability of serious and systemic manipulation of the gold price becomes much higher and more apparent. Last week we briefly discussed the actions of the Gold Anti-Trust Action (GATA) group in informing the US Congress of the incredible risky corner many important money-center banks are being painted into by continuing to use naked derivatives to suppress the price of gold. The arguments explaining the manipulation are very deep and scholarly. Although they are sound, one has to do much careful study to analyze and understand the evidence, the parties involved, and the motives of the meddling in a supposedly free market. As financial markets become more and more unstable, however, the price manipulations become much more brazen, making it easy for even an investing neophyte to detect the rotten odor of treachery in the gold market.
The Bank of England gold bullion sale this week was a prime example of an act that makes no logical sense from a purely capitalistic perspective. Since last year, the BoE has had a series of 25-ton gold sales. The latest traunch of 25 tons was liquidated this week. The BoE has cited the need to “diversify its assets” as the primary driving force of the gold sales. No intellectual disconnects so far, right?
The mechanics of the sales are quite interesting. Open bids are accepted. In a normal auction sale, the seller of an asset generally makes the sale to the highest bidder. As a capitalist seller, even third grade children with lemonade stands understand that a higher sales price is more desirable then a lower one. In almost all the BoE sales, bidders have asked for more than 2 to 3 times the gold that the BoE wanted to dispose of on a particular day. The free market has a solution for that problem as well. As a seller, you simply raise your price until the market demand exactly meets your supply. In the latest auction, the 25 tons of gold was oversubscribed by 2.7 times, indicating the market wanted to purchase 67.5 tons of physical gold from the BoE at current price levels. So as a seller, the BoE should be ecstatic, and keep raising prices until only 25 tons of gold is demanded at a higher price. After all, it should maximize its gain as the fiduciary steward of the assets of the people of Great Britain. So what does the BoE do? Instead of maximizing its profits, it picks an arbitrary allotment price that is UNDER the high bids, and then allocates the gold to all higher bidders at the allotment price, which is LOWER than their bids. The BoE would flunk as an investment manager or capitalist by giving away merchandise at deep discounts. In addition, the BoE doesn’t publish the higher bids, so the gold market does not know how desperately bidders want the 25 tons of physical gold. Does this sound like a logical capitalist transaction? Would any savvy business owner or capitalist run the “auction” this way?
Some thoughts to ponder … Why would anyone liquidate a proven asset of timeless value at 20 year cyclical lows? Three possibilities … First, the owner of the asset needs immediate liquidity, and is willing to sell at a loss to get cash NOW. Second, the owner of the asset is being coerced, conned, or blackmailed into selling at fire sale prices. Third, the owner of the asset has an intricate strategic plan that requires some tactical losses to achieve the ultimate strategic goal.
The World Gold Council recently did a survey of the English populace, and found that 48% strongly oppose the sales of the public gold and only 12% support the sales. Why would a central bank shirk its fiduciary responsibilities and ignore the wishes of those whose assets it “protects”? Why the continuing small sales? With the oversubscribed demand at each of its sales, the BoE could have liquidated all the gold it wanted in one or two sales. Why draw the sales out if the physical gold price continues to fall during the sales? If the BoE economists are forecasting continued weakness in the gold price, one would think they would want to sell as much as possible now before prices go lower, rather than drawing out the sales. I believe any thinking person would agree there is something fishy regarding these highly publicized sales of public gold. If I was a citizen of England, I would be furious that the government is liquidating hard-won assets of the British Empire that my ancestors painstakingly earned and fought for. I would also be asking legislators why they are allowing the liquidation of core holdings of the Treasury at fire sale prices and what the intended effect on future generations is to be. I strongly encourage everyone who is interested to do some research into the history of gold since the early 1900s and the continual failed efforts to suppress the price of the metal. These studies could have staggering implications on the future net worth of everyone reading this essay.
As the long holiday weekend in the States begins to unfold, the stage is set for an interesting and exciting week in the markets beginning on Tuesday. The US dollar index fell all week, and could indicate wavering foreign confidence in the US equity markets. The drop could be a head fake, or it could be the beginning of a major downward trend in the value of the benchmark currency. Following its 4% loss last week, the NASDAQ hemorrhaged another 6% of its value this week for a whopping 17.8% loss so far in May. Unless there is some macro good news for the markets in the next few days, the NASDAQ is on course to break 3,000 next week, and the DJIA could easily plunge below 10,000. If these critical psychological levels are simultaneously breached, we could be in for a very interesting and memorable Memorial Day week.
Adam Hamilton, CPA May 26, 2000 |
|||||||
|
|
|
|
|
|
|
|
|
|
|
|
|
|
|
|||


