|
|
|||||||
|
|
|
|
|
|
|
|
|
|
GOLD, HGMCY, and DROOY Adam Hamilton June 9, 2000 2902 Words
In what has turned out to be an intriguing week for gold, interest continues to grow in several of the major South African gold mining companies. Among the hardcore gold zealots, the three South African names that engender the most excitement and have legions of loyal followers are Gold Fields Limited, Harmony Gold Mining, and Durban Roodepoort Deep. Each of these excellent companies is in position to perform very well in a sustained bull market in gold. In this essay, we will attempt to explore the relative accounting leverage of each company to the price of gold.
Before we begin our discussion, an important disclaimer is in order…
This superficial essay is NOT professional investment advice. Your humble author is NOT a professional investment advisor, and currently maintains investment positions in all three of these companies. Investing and speculating in gold mining equities (or any equities, for that matter) is a risky endeavor with a very real probability of substantial losses. This essay is simply designed to facilitate deeper study of South African gold equity investment alternatives. Before making any investment decision, do your own research and consult a professional investment advisor.
Prudent investors in equities (with the glaring exception of bubblevision inspired “investors” throwing money at technology stocks at 200+ times earnings) make their purchasing decisions based on projected future cash flows a given investment may yield. Investors in gold equities are no exception, and are very interested in the projected effect of a given increase in the price of gold on the potential future cashflows of their gold mining investments. There are many excellent and varied methodologies available for gold equity investors to attempt to analyze and estimate the future effect of a material, sustained rise in the price of gold on the share price of a particular gold mining company. This essay will briefly examine one of those approaches, what we will call “accounting leverage”, and apply it to the three most popular South African gold mining equities.
Over the long run, the value of any company should closely track the cashflows generated from operations. If operations produce a large surplus of free cash, an investment will appreciate in value as investors bid it up to participate in the excess cashflow. If operations lead to cash losses which deplete capital, an investment will depreciate in value as investors sell out. In a gold mining company, operating profits may be defined as the realized price of gold less the cash operating costs of mining, milling, and processing the metal. Examining cash operating profits for our three South African gold mining companies under different hypothetical gold prices will allow us to visualize the relative leverage of each company’s operating cashflows to positive changes in the price of gold. The relative leverage we discover in operating cashflows for each company should be an acceptable proxy for the potential price appreciation in each stock relative to an increase in the price of gold. In a gold bull market, after investors are convinced gold will sustain a new high intermediate term equilibrium price, they will bid up the share price of gold mining companies to reflect the reality of vast new cashflows.
The first company we will examine is Gold Fields Limited, traded on NASDAQ in American Depository Receipt form under the very cool symbol “GOLD”. GOLD is the largest company of the three we are investigating in this essay by far, with a market capitalization exceeding $1.7b. GOLD produced an incredible 959,000 ounces of gold in the first quarter of 2000, and is one of the largest gold mining operations in the world.
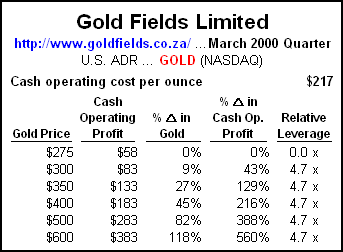
The table below shows the effect various increases in the price of gold would have had on GOLD’s operating profit in the first quarter of 2000. The second column, “Cash Operating Profit”, is simply computed by subtracting the “Cash operating cost per ounce” from the “Gold Price” in the first column. The center column shows the percentage increase in the price of gold from an arbitrary base of $275/oz. The “% Change in Cash Op. Profit” column shows the percentage increase in cash operating profits at a given gold price. Finally, the “Relative Leverage” column is calculated by dividing the “% Change in Cash Op. Profit” column by the “% Change in Gold” column.
As we can see, GOLD’s cash operating profits have excellent leverage to the price of gold. The accounting leverage of 4.7 indicates that any sustained, material increase in the price of gold should yield 4.7x that amount of an increase in cash operating profits. For example, a 10% increase in the price of gold would yield a projected increase in cash operating profits of 47%.
In addition to excellent leverage to the price of gold, Gold Fields Limited has many other highly desirable attributes. It is almost 100% unhedged, and maintains a hedging policy that currently does not employ general corporate hedging of the gold price. GOLD does place small hedges on certain new capital properties it is developing, but the size of these hedges is very immaterial to the company. GOLD shareholders will have virtually 100% participation in a sustained, material rally in the price of gold. Rumors are also swirling that GOLD is in merger talks with a major North American gold producer. This can’t fail to increase general interest in the company and probably will result in the share price being bid up. Finally, the symbol GOLD is priceless! In a neo-gold rush, millions of day traders will finally see the light and scramble to position their capital to surf the monster gold wave. Those who have not researched gold mining equities (99% of them) may type G – O – L – D into their online brokerages and frantically hammer the buy button!
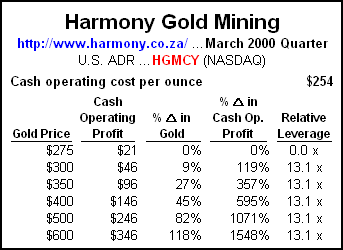
The second company we will examine is Harmony Gold Mining, also traded as an ADR on NASDAQ under the symbol “HGMCY”. HGMCY is about a third the size of GOLD, with a market capitalization over $500m. HGMCY produced a very impressive 547,000 ounces of gold in the first quarter of 2000. Harmony’s cash operating costs averaged $254/oz in the quarter, indicating the following accounting leverage…
With higher cash costs per ounce of gold, Harmony also has a much higher relative accounting leverage to the price of gold than Gold Fields. For a 10% rise in gold, Harmony’s cash operating profits are projected to increase an incredible 131%! In addition to its awesome leverage, HGMCY maintains an aggressive anti-hedging policy. Although the recently acquired Randfontein property had some hedges attached, Harmony is shedding these hedges as rapidly as the market will allow. Harmony will grant the investor essentially 100% participation in a material, sustained rally in gold. Finally, Harmony has an innovative program of marketing “branded gold”. Harmony creates small and attractive gold bars, stamps its name on them, and is marketing these bars via the web. The company is also pursuing market opportunities in traditional strongholds of gold demand including India. If Harmony brand gold catches on, it bodes well for the stock as it could greatly increase exposure to and knowledge of this excellent South African gold mining company.
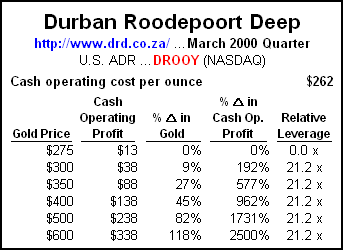
The final company we will examine is Durban Roodepoort Deep, traded as a NASDAQ ADR “DROOY”. DROOY is the smallest of the three companies by a long shot, weighing in at a market capitalization of a mere $107m. Belying its puny market cap, DROOY produced a whopping 292,000 ounces of gold in the first quarter of 2000. With more marginal deposits and higher operating costs than GOLD and HGMCY, Durban’s leverage to a rise in the price of gold is quite extraordinary…
The nature of accounting leverage dictates the smaller a gold company’s operating profits before the big jump in the price of gold, the greater the potential leverage of the company. DROOY sports a phenomenal 21.2x leverage of cash operating profits to the price of gold. This indicates for a material, sustained 10% rise in the price of gold, DROOY’s cash operating profits should increase a phenomenal 212%! Unfortunately, unlike GOLD and HGMCY, Durban does maintain material hedges to protect against a downturn in the price of gold. With more marginal deposits, and substantial accounting losses (adding in non-cash charges to the small operating profit), management has chosen to hedge some production in order to ensure the company can continue to generate sufficient cashflows until the inevitable gold rally of legend sweeps around the world like a mega-tsunami. These hedges can potentially retard accounting leverage and investor participation in a gold rally, so they need to be examined more closely.
From a quick glance at their website, Durban claims to be hedged 46% in the next twelve months, 37% in the following year, 14% three years out, and 13% in the fourth year. Taking a simple average, DROOY appears to be 28% hedged in the next four years. This is not too bad relative to some gold producers that are 100% hedged for many years, but it is a much higher hedging level than GOLD and HGMCY maintain.
Upon closer inspection the hedging numbers become much more favorable. DROOY does have “bad” hedges relative to a major rise in the price of gold which have potentially unlimited opportunity cost for investors. These include forward sales and written calls. Forward sales simply require Durban to deliver gold in the future for a specific price. Durban’s call writing gives counterparties the option of requiring Durban to deliver gold at a set price within a certain timeframe. To understand the potential impact of these two hedging techniques, imagine gold goes to $3,000/oz. Durban could be contractually required to deliver gold for $300/oz cash even if the market price is $3,000/oz, netting a $2,700/oz “opportunity cost” loss for investors. DROOY has another form of hedging, purchasing puts, which gives it the option to sell gold at a certain price. Unlike forward sales and call writing, the loss on these puts in a gold bull market is limited to the price paid for these options, as DROOY would not exercise put options at a loss.
In contrast to negative hedging, Durban offsets some of its “bad” hedgebook with a good hedge to own in a rising gold market, purchased calls. DROOY’s call purchases give it the contractual right to purchase gold at a certain price within a defined timeframe. In a gold bull, these call options can be used to offset the bad hedges discussed above, dramatically lowering the gross impact of its hedgebook.
Let’s take a closer look at Durban’s hedges, and compute the net “bad” hedges over the next four years. Purchasing puts will be ignored, as the cash paid for them is a sunk cost and they will be irrelevant in a gold bull. Annual production of 1.2m ounces in the next 12 months growing at 10% per year is assumed for these calculations. Taking forward sales and written calls, and offsetting them with purchased calls, DROOY’s hedgebook looks dramatically better for a gold super bull market. In the next 12 months, net negative hedge exposure drops to 2%, remains at 37% in the following year, drops to 15% in the third year, and falls again to 2% in the fourth year. This gives us a simple average of 14% hedging over the next four years. Theoretically, this indicates maybe 14% of the leverage of Durban’s operating cashflows to the price of gold may be neutralized over the next four years by hedging. With a new chairman at the helm and the recent retirement of 500,000 ounces in hedges, I suspect Durban will continue to whittle away at the remaining negative hedges and end up virtually unhedged at some point in the next couple years. Net net, it appears the incredible leverage of Durban’s operating profits to the price of gold is not materially compromised by its hedging positions. 21x accounting leverage less 14% still yields leverage of 18x, which is roughly 50% higher than HGMCY and almost 400% higher than GOLD. Durban’s extraordinary accounting leverage coupled with its small market capitalization makes it a gold speculator’s dream.
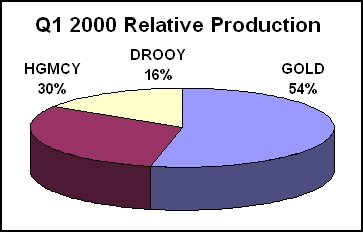
For another perspective on GOLD, HGCMY, and DROOY, it is educational to look at their relative production in Q1 2000 vs. their market capitalization. In total and aggregate, they reported 1.8 million ounces of gold produced in the quarter, having a market value of $495m at $275/oz. GOLD obviously produced the lion’s share of this gold.
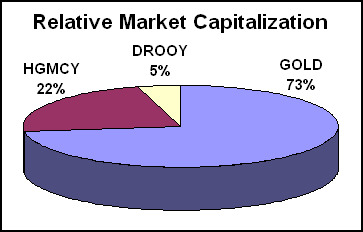
Now glance at the relative value the market is assigning to each company. Their total market capitalization is circa $2.3b.
It is not a surprise in the current low gold price environment that the highly profitable GOLD is valued disproportionately high relative to its production. A great gold bull, however, will have the effect of equalizing the profits on an ounce of gold mined for any cost under $275. At $600 gold for example, the differences between production costs will become much less important to the bottom line and the companies will seek relative valuations in similar proportions to their gold production. HGMCY and DROOY, due to their higher costs of production, lower valuation, and higher leverage, will show share price gains at a much faster pace and larger magnitude than the current market leader GOLD. All three companies will see incredible appreciation as the whole pie grows dramatically larger, but Harmony and Durban will grow at faster rates making this relative market cap pie graph look more similar to the production graph above.
So how much share price appreciation would we see in these companies at $600 gold? It is impossible to predict, of course, but I suspect that the increase in operating cashflow in each company will be a fair proxy for appreciation potential. Barring any material changes in production costs, at $600 gold GOLD’s appreciation could be on the order of 500%, HGMCY could see a revaluation near 1500%, and dark horse DROOY could end up over 2100%. All three of these numbers are quite impressive, even for jaded tech investors.
The above estimates are share appreciation in a RATIONAL market, where the gold stocks are bid up based on underlying cashflows. If gold goes to $600/oz fairly rapidly (over several months or less), rational investing will be damned in the mass rush to speculate in these high flying companies. In the case the public becomes enamored with gold stocks, the appreciation estimate for each company could probably be increased by another order of magnitude. There is NO rush like a GOLD RUSH! After all, have you ever heard of a bond rush, a wheat rush, a coffee rush, or a sugar rush? (uhhh, wait a second … better scratch the last two, but you get the drift!) The words GOLD RUSH define the ultimate in human speculative excess. It is interesting to study the history of humanity and learn of times when an insatiable lust for gold raged like a wildfire in the human soul. If gold fever catches in the general populace, these three stocks may appreciate between 50x to 200x. With a current total market capitalization of about $2.3b, an average 100x appreciation would yield a new total value of $230b, which is less than one half of the value mania investors are currently assigning several individual crowd favorite technology companies.
As a final bonus that will warm the cold, unemotional, calculating hearts of contrarians everywhere, these three excellent gold mines are very price-depressed at the moment due to the abnormally low gold price, relentlessly bearish popular gold sentiment, and a media created perception of increased political risk in South Africa. As soon as the shenanigans in Zimbabwe blow over, the South African investing skies will once more glow with sunlight. Buying low has never been easier!
GOLD, HGMCY, and DROOY all offer extraordinary investment opportunities in the coming bull market in gold. With GATA’s recently released report on the Gold Derivative Banking Crisis careening through the global halls of power like a runaway train, the probability of a material, sustained rise in the price of gold increases daily. With the widely documented massive short position in the metal, chances are the initial stages of the gold rally will be violent as shorts rush to cover before they are annihilated. All three companies offer substantial leverage to the price of gold, and should be among the best investments in the world in this type of environment.
If your fancy leans towards a large, institution grade, world-class unhedged gold producer with brilliant management, you can do no better than GOLD. If your veins course with adrenaline and you are seeking the ultimate leverage to the price of gold and are willing to speculate in a smaller South African gold producer, launch some further investigations on DROOY. For a happy medium between the two extremes, take a look at HGMCY as a high-leverage investment opportunity in an innovative and proactive gold mining company that is actively raising global investor awareness of the many merits of gold investing.
For over a hundred years South Africa has been the king of world gold producing nations. GOLD, HGMCY, and DROOY are the crown jewels of the gold empire. Each offers superior leverage to the price of gold, excellent management, and the opportunity for valuable international portfolio diversification. Unfortunately, this is a limited-time offer, as the supply of these excellent gold producers at fire sale prices is rapidly dwindling.
Adam Hamilton, CPA June 9, 2000 |
|||||||
|
|
|
|
|
|
|
|
|
|
|
|
|
|
|
|||

