|
|
|||||||
|
|
|
|
|
|
|
|
|
|
NASDAQ Neutron Bomb Adam Hamilton October 6, 2000 3778 Words
“And this shall be the plague wherewith the LORD will smite all the people that have fought against Jerusalem; Their flesh shall consume away while they stand upon their feet, and their eyes shall consume away in their holes, and their tongue shall consume away in their mouth.” - the ancient Israeli prophet Zechariah, in the Tenakh, ca 500 BC
The ancients never cease to amaze. Zechariah’s strange prophecy made no scientific sense at all for 2,500 years after he uttered it. Before the 1970s, the only way to conceive of this scenario occurring was by the direct supernatural intervention of Zechariah’s God, the God of Abraham, Isaac, and Jacob. In the last 20 years, however, humans have figured out a technical way to achieve similar results.
Zechariah’s foreboding apocalyptic prose, quite remarkably, is an accurate description of the effects of a neutron bomb. A neutron is simply a component of every atomic nucleus (except plain hydrogen). As we all learned in physics class, an atom consists of a nucleus, made of positively charged protons clinging to neutrons with a neutral (no) electrical charge. A negatively charged electron “cloud” surrounds the nucleus. In general, every proton must have a companion neutron and an offsetting electron to form a stable element. Neutrons are critical building blocks of every material thing in our universe.
When neutrons are where they are supposed to be, clinging to protons in atomic nuclei, they are vital for the existence of matter. When they are freed, however, they make an extremely lethal form of radiation. The neutron bomb exploits this deadly characteristic of free neutrons. A neutron bomb is a third generation nuclear weapon. In a first generation nuclear fission bomb, heavy atomic nuclei are split apart, and the power released from these large atoms is tremendous. In its much more powerful second generation descendant, the fusion bomb, or thermonuclear bomb, light hydrogen isotopes are fused together to form heavier atoms, releasing unfathomable amounts of energy. Fusion bombs make fission bombs look like firecrackers.
In one of these deadly thermonuclear bombs, the hydrogen isotopes of tritium and deuterium are fused together to form heavier elements, releasing about half the initial energy of the device. The fusion core of the bomb is wrapped in a blanket of very heavy uranium 238 atoms. The U-238 isotopes are split by the searing energy released from the fusion core, initiating a secondary fission explosion that can be more powerful than all the munitions ever expended in the history of humanity. Extremely devastating and lethal, these hydrogen bombs are very messy, vaporizing or burning everything, and leaving the very earth itself contaminated with radiation that can last for millennia. God forbid we ever decide to pull the red doomsday trigger and use these hell-spawned beasts on fellow humans.
The neutron bomb is another generation beyond a thermonuclear device. It has the same core of a fusion bomb, but the blanket of heavy U-238 isotopes is removed, so only the energy released from the fusion core comprises the total explosive yield. This energy is in the form of a massive flux of neutrons, combined with some gamma radiation. Neutrons are highly lethal to humans and animals, and the N-bomb instantly kills everything in its radius of lethality. Any living creatures that receive non-lethal doses of the neutrons will be dead within a day or two from radiation sickness. Neutron radiation literally vaporizes the soft flesh of humans at close range, and Zechariah’s remarkable prophecy, regardless of what he was really prophesying, is an extraordinary description of the effects of a neutron bomb on human beings.
Neutron bombs are also much cleaner than conventional nukes. A neutron blast only kills living things, leaving all buildings and weapons intact. It is the ultimate weapon to use against massed troops and armor, as all the enemies die instantly, no structures or vehicles are damaged, and, most importantly, no radioactive fallout is left behind. Unlike fission or fusion nukes, neutron bombsites are safe to walk into immediately after the explosion. Neutron technology has been developed to such a level that these devices can be produced in as small a package as the size of a common baseball! They can be used in field artillery and small rockets, and even soldiers dug in behind several feet of earth are not safe from a neutron blast. Until the Clinton/Gore Administration, only two nations wielded this fearful weapon, the United States and Israel. Thanks to the DNC/Chinagate scandal, however, China is now known to possess neutron devices, and several other countries are rumored to be actively pursuing this technology. Many global intelligence analysts believe that small neutron bombs may unfortunately become the weapon of choice for the discerning terrorist in the 21st century. It IS an ironic and sad commentary on humanity that the most intelligent humans (nuclear physicists) build weapons that the most power-hungry and unaccountable humans (politicians) use to kill the most courageous humans (patriotic soldiers). We truly live in a crazy world.
The NASDAQ of the last few months has been absolutely brutal, and the resulting damage before this whole thing plays out will have a similar effect on tech investors that a neutron bomb has on massed soldiers. As the NASDAQ continues its wicked bear market burn, small investors are being annihilated by cratering equity prices, margin calls, and rapidly decaying market sentiment. The NASDAQ neutron bomb will vaporize tech investors, while Wall Street and the virtual NASDAQ exchange itself will be left intact, like the real neutron bomb executes combatants and “ignores” infrastructure. This essay explores some of the incredibly negative and deteriorating technicals and fundamentals in the currently imploding NASDAQ stock market.
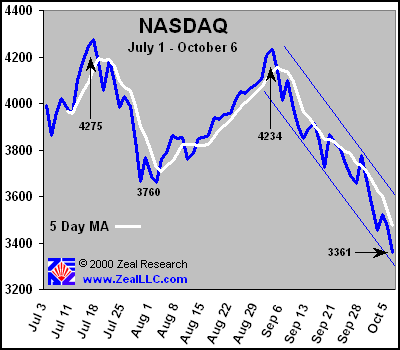
We will begin with a look at the beleaguered index since July 1…
The graph above is a simple look at the daily closing price on the NASDAQ in the last three months. Does this look bullish? Wall Street, bubblevision, and the major US television networks are attempting to convince us “All is well, our markets and economy are healthy, oil prices don’t matter… time to elect Gore for more of the same!” All the while, the critical NASDAQ is degrading by the day. A couple interesting observations emerge from the graph. First, a bear market can empirically be defined as a long series of consecutively lower highs and lower lows, grinding investors down on the millstone of fundamental reality. The first peak in the graph outlines the FIRST bounce since the March high in the NASDAQ of circa 5100. A level of 4275 was attained by the bulls in this opening assault. (close to a Fibonacci retracement for all you technicians out there) The second major rally culminated in an intermediate closing top of only 4234. Lower highs are NOT a sign that all is well in bubble land! The first rally fizzled and collapsed to 3760 around the end of July. The second rally ran out of kinetic energy in early September and is still collapsing. The NASDAQ closed at a frightening 3361 on Friday October 6. Truly a few months do NOT make a bear market, but it is a heck of a start and LOOKS like a classic bear market in NASDAQ equities is emerging. Also notice the STEEP negative channel that the NASDAQ has been trading in since the beginning of September, bounded by the light blue lines above. Contrary to many mainstream AND contrarian analysts’ expectations, the index did NOT pull out of its nosedive for the customary end of the quarter markup and window dressing in September OR the expected mutual fund buying in the first week of October. This portends ominous sailing ahead for the faltering index.
Mutual funds, needless to say, are perpetually VERY bullish and VERY pro-Wall Street. The whole industry, with a few immaterial exceptions, thrives on bull markets. When stocks are going up, people shift savings away from safer assets into the equity markets. The more money mutual funds have under management, the more profits they generate. Also, more money under management equates to much higher salaries for the mutual fund managers. They, as all capitalists, are trying to maximize their own personal returns. They have a HUGE vested interest in ever-higher equity prices, so they can continue to vacuum in capital from all over the globe. Typically, at the end of a quarter, mutual fund managers dump large amounts of their clients’ cash into the equity markets, in an attempt to boost up the market price of their primary holdings. Bonuses and incentives for money managers are typically based on quarterly performance. A mutual fund manager who had 10% of her fund in Cisco Systems, for instance, would like to bid up the price of CSCO near the end of the quarter to maximize her personal performance bonus. Every quarter in recent memory has witnessed this phenomenon, until now… In September, there was a nice rally on the second to last trading day, but it collapsed dramatically on the final day of the month… very odd. In the first week of this fourth quarter, mutual funds were expected to begin buying with new money they receive from clients. Many employers withhold money from paychecks that is wired to various mutual funds at the end of a month, or quarter. Hence, the mutual funds are usually rolling in fresh dough they want to deploy in the first week or two of a new quarter. In the first week of October, this past pattern of behavior was strangely not readily apparent. Either mutual funds were not spending this money, it had a negligible effect, or they did not have the money in the first place. With dismally large losses for the NASDAQ this year, maybe small investors are tired of having their hard-earned wealth vaporized by the emerging bear market and are pulling what is left of their cash out of ground zero. When redemption orders arrive, mutual funds have no choice but to sell stocks they own to repay their clients. If we are indeed seeing this phenomenon now, it could get much worse in the next couple weeks as mutual fund holders receive their third quarter statements and the NASDAQ carnage suddenly becomes quite tangible and personal. A bull market requires tremendous infusions of new capital to continue rising, and if mutual fund funding dries up, this waking bear could get really mean really fast. Definitely something to monitor in the coming weeks…
Adding to the melee of bear-like price action and the lack of expected mutual fund bullying of the index, internal fundamentals crucial to the NASDAQ continue to crumble…
Every day, some NASDAQ-listed companies’ stocks rise, and some fall. By taking the number of companies rising in price each day (advancing issues) and subtracting the number of companies falling in price each day (declining issues), the net advance/decline line is generated. Since the last intermediate top of the NASDAQ was breached in early September, the net A/D line has become very gloomy, as the graph above shows. The five trading day moving average net A/D line (white in the graph) continues to bleed. It is very difficult for a meaningful rally to occur when more stocks on an index are falling than rising. This is not the type of picture we would expect to see before a major rally in the NASDAQ. It is very bearish. The net volume on the NASDAQ in the last five weeks paints a similarly frightful picture…
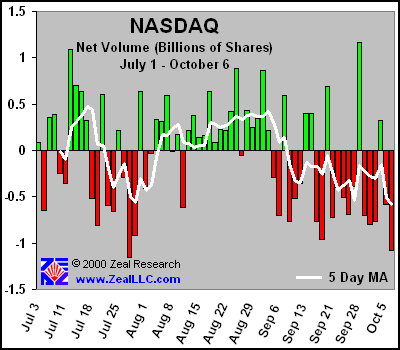
Net volume is computed like the net A/D line. Some stocks are up on a particular day, and some stocks are down. If a given stock closes a trading day higher, the volume of that stock traded on the day is considered up volume. If the stock closes lower, its volume traded is considered down volume. By subtracting down volume from up volume, the net volume on the NASDAQ is determined. The graph above shows a major deterioration in this key technical indicator since early September. In the last month, 75% of the trading days have been major down days in net volume, with the five day moving average approaching half a billion shares of net down volume a couple times. Just as with the ugly net A/D line, it is extremely difficult for the index to rally while more shares traded are dropping in price than rising. Technically, these recent developments are not pretty. One begins to consider feeling slightly sorry for the NASDAQ perma-bulls stampeding to the edge of the cliff just in time to witness their own slaughter.
Technically, the NASDAQ does not look like a robust and strapping young market. The bulls are claiming the technicals do not really matter because the NASDAQ “correction” has created a plethora of screaming bargains on the index. They proclaim that anyone who doesn’t buy at this very moment is making a “terrible mistake”. We will briefly give them the benefit of the doubt and analyze their bold assertion that the NASDAQ is now OVERsold and UNDERvalued. (hard to even type that without laughing out loud!)
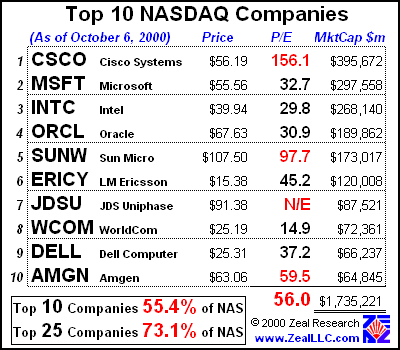
Fundamentally, of course, the NASDAQ is STILL the most over-valued equity index on the planet, and one of the most extreme equity bubbles in all of market history. Here are the ten largest companies trading on the NASDAQ and their generally outlandish valuation multiples…
Historically, the US equity markets have had an average price earnings ratio of 13.5. The top 10 NASDAQ stocks currently are sporting an average P/E ratio of 56.0! This indicates, assuming no growth and everything else is equal, it would take these companies an average of 56 YEARS for them to earn the amount of money that investors were willing to pay for their shares on October 6. One of the companies has yet to earn a single penny (JDSU), and three others have P/E’s over 50 (marked in red above), indicating EXTREME overvaluation. Only one of the biggest companies in the NASDAQ, WCOM, is even anywhere close to being fairly valued by all historical standards. Two of the companies, Microsoft and Intel, are also members of the elite Dow Jones Industrial Average. Interestingly, the bubble-king is still the outrageously valued Cisco Systems, trading at an unreal 156.1x earnings even after the recent NASDAQ carnage. These 10 companies represent a whopping 55% of the total value of the NASDAQ, which has over 4,500 listed equities. The top 25 companies make up almost three quarters of the total value of the index, and they have a simple average P/E ratio of 156.1 (interesting coincidence with CSCO), and five of them have never shown a profit. This thing is literally screaming, “I AM A BUBBLE!”, yet daring investors continue to ignore the warning. Bubblevision parades an endless stream of “experts” before the American public who are passionately arguing that investors should buy these 25 companies, the so-called “blue-chip” tech stocks. This constant corralling of small investors into the most dangerously overvalued index in the history of the world (only exceeded by itself earlier this year) creates an extremely volatile situation. When the NASDAQ neutron bomb blows, and it WILL or else 6000 years of history will be proven wrong, the small investors will be vaporized where they are standing just as Zechariah described in his ancient prophecy uttered millennia ago. For the folks who are ranting that the NASDAQ is currently oversold and undervalued, what kind of funny weed are they smoking? It is a speculative B-U-B-B-L-E!
At the beginning of each quarter, earnings season is the most important determinant of near-future stock market direction. The Q3 earnings reports so far have generally been BAD. Intel, the bluest of blue chip tech stocks, lost over 20% of its huge market capitalization in one HOUR on an announcement of lowered expectations. It was the third largest company on the planet in terms of market capitalization before the announcement. Apple was cut in half in a single morning on a negative earnings surprise. Priceline.com shareholders were mugged and left for dead when that company missed expectations, and a class-action lawsuit has already been launched against management for misleading investors of what was once considered one of the best internet companies in the world. It has lost over 90% of its value this year. At least those annoying Shatner commercials will cease to taint the airwaves! Dell, easily the best computer company in the world, is currently trading at a TWO YEAR low, after the company announced its sales were growing SLIGHTLY slower than analysts had predicted. (For NASDAQ bulls… we are talking INTC and DELL here! Two of the best technology companies in the history of humanity. You would have said this was IMPOSSIBLE six weeks ago! Valuation DOES matter!) The biggest trial yet for NASDAQ bulls will arrive the day Cisco Systems announces it cannot meet high analyst expectations for growth. It may not happen this quarter, but it is inevitable one of these quarters. Cisco alone represents over 10% of the value of the market-capitalization weighted NASDAQ index, and it is the last “safe-haven” in this tech storm. As a testament to the fact more and more market participants are crowding into fewer and fewer dangerously valued equities, CSCO accounted for a little under 7% of the total value of the NASDAQ in March, and now it is well over 10%, a 50% increase in the relative weight of this goliath. Cisco investors remind me of those great Roadrunner cartoons where the Coyote is on a small platform on the top of a steep mesa that is crumbling away around him. The Coyote crowds closer and closer to the center, seeking safety, but the center eventually falls out of the mesa as well, sending him plummeting to his comical fate. Just as a single small stone toppled the mighty Goliath of biblical fame, a single bad rumor or missed expectation can cause CSCO to lose 50% to 75% of its value in a single day … and it will STILL be greatly overvalued. Ironically, even perceptions of relative tech safety in CSCO are a farce as well, as Cisco was trading near $80 in March and now it is hovering in the $50s. The piling of more and more people into fewer and fewer stocks is a classical sign of impending doom for an equity market.
If the NASDAQ follows the abundant historical precedents for post-bubble proceedings, the whole index will have to plummet precipitously to a valuation level of around 7x earnings before the bear market runs its full course. After it gets to half the normal 13.5x valuation level, only then will it be fundamentally poised to begin a new bull market in earnest. ALL MARKETS ultimately regress to their mean values. Mean valuation has always been historically defined in terms of earnings and cash flows multiples. People ultimately only invest for a reasonable return on their hard-earned cash. Like all bear markets, sharp and violent rallies are to be expected from time to time, but lower highs and lower lows will become the rule of the day. From a fundamental valuation standpoint, contrary to popular wishful thinking, the NASDAQ has not even yet begun to correct…
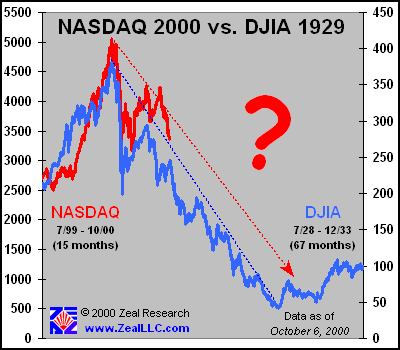
One final graph is in order, which is one of our favorites. We currently have this on our website at www.ZealLLC.com and update it periodically with current market data. It originally appeared in an essay titled “To Crash or Not to Crash.” Here is the current iteration…
History DOES matter, and many incredibly wise sages have pointed out that history repeats itself over and over and over ad infinitum. Humans generally do NOT learn from past mistakes, as so few study the stumbling blocks of past generations. Investor greed and fear drive speculative bubbles and their subsequent bursting. The human heart does not change, and greed and fear today are the exact same emotions that drove past speculative debacles. The NASDAQ will be no exception. I am utterly amazed how well the correlation presented in the graph is generally holding together. The NASDAQ timeframe is expanded by 2x (one NASDAQ trading day is graphed next to TWO DJIA trading days), as a rough proxy for the faster information flows and market reactions of today. Will the NASDAQ exactly follow the 1929 DJIA’s nauseating course? Probably not, but the decay curves of these two famous bubbles will most likely materially match after all is said and done.
The bottom line? The NASDAQ continues to dramatically deteriorate technically, and fundamentally it is still a basket case. Like a neutron bomb, this implosion of the NASDAQ will not destroy the exchange and will not destroy the exciting and very important new technologies of computing, fiber optics, the Internet, biotech, etc. These great technologies will still be around, and will help our civilization continue to make great leaps forward. Just as the 1929 crash did not destroy radio, the “Internet” of the day, the NASDAQ neutron bomb won’t alter our new technologic reality. The NASDAQ neutron bomb will kill all flesh, leaving the infrastructure intact. Investors who neglected to read history, understand valuation, do their own due diligence, and believed the hype will meet a fate for their capital as Zechariah described in his prophecy. They have been fattened up like Thanksgiving turkeys, and now their Wall Street shepherds are leading the fat lambs to the slaughter.
What do you do if you expect a neutron bomb attack? Get the heck out of dodge. Neutron bombs have a limited range, and their damage falls off at an inverse cube relationship to the distance from ground zero. Any capital in bloated NASDAQ big caps will be vaporized. Ironically, the only effective countermeasure for a neutron attack if one cannot get out of the way is to take a tactical position behind a few feet of lead, which absorbs the massive and lethal neutron flux. Even a 60 ton main battle tank will not protect its occupants, yet a simple lead wall will. One of the closest atomic relatives of lead, as everyone who has studied alchemy and the medieval search for the Philosopher’s Stone knows, is gold. The financial equivalent of a lead wall is a GOLD wall. Capital parked in the ultimate safe haven of gold will be protected from the continuing equity price implosion. Once the neutron flux of massive speculative excess has been wrung out of the financial battlefield, the capital can be safely redeployed in TRULY value priced tech stocks. Won’t it be fun to buy CSCO at $2 per share?
The NASDAQ neutron bomb is coming … take appropriate financial countermeasures before it is too late.
Adam Hamilton, CPA October 6, 2000 |
|||||||
|
|
|
|
|
|
|
|
|
|
|
|
|
|
|
|||


